
[PART I – MYSTERIES]
[PART II – CURRENT THEORIES OF OBESITY ARE INADEQUATE]
[PART III – ENVIRONMENTAL CONTAMINANTS]
[INTERLUDE A – CICO KILLER, QU’EST-CE QUE C’EST?]
[PART IV – CRITERIA]
[PART V – LIVESTOCK ANTIBIOTICS]
[INTERLUDE B – THE NUTRIENT SLUDGE DIET]
[PART VI – PFAS]
Lithium is the third element on the periodic table, the lightest metal, a hit Nirvana single, and a mood-stabilizing drug often used to treat bipolar disorder.
Lithium isn’t synthetic, of course, but it can still be an environmental contaminant. While it occurs naturally in small concentrations in groundwater, human activity might have led to serious increases over the past few decades.
Unlike the other contaminants we’ve reviewed, we don’t need to spend any time convincing you that lithium makes people gain weight: it does. Almost everyone who takes lithium at therapeutic levels gains some weight. About half of them report serious weight gain, on average 22 lbs (10kg), and about 20% of patients gain more than that. Weight gained is correlated (r = .44, p < .001) with dosage. Unsurprisingly, weight gain on lithium is related to an increase in leptin levels.
We’d love to tell you whether lithium concentrations in groundwater have increased over time. But while lithium is easy to detect, assessing lithium levels is not a part of the standard analysis of drinking water, so we don’t have reliable historical data to work with. There aren’t even EPA standards for lithium levels in drinking water.
We’d also like to tell you about how much lithium people are exposed to, and whether that has increased over the past several decades. Measuring serum lithium is relatively easy, and people who are starting lithium treatment get checked frequently to make sure that their blood levels aren’t too high. Despite this, there doesn’t seem to be any data on serum lithium levels in the general population. The NHANES data has records of how much uranium there was in your urine every year from 2000-2016, but not a single measure related to lithium. Great job, guys.
We can’t talk about trends in the groundwater or in people’s bodies directly. But what we can do is look at other trends that we would expect to be related. For example, this figure shows a graph of USGS-reported records for global lithium production since 1900:
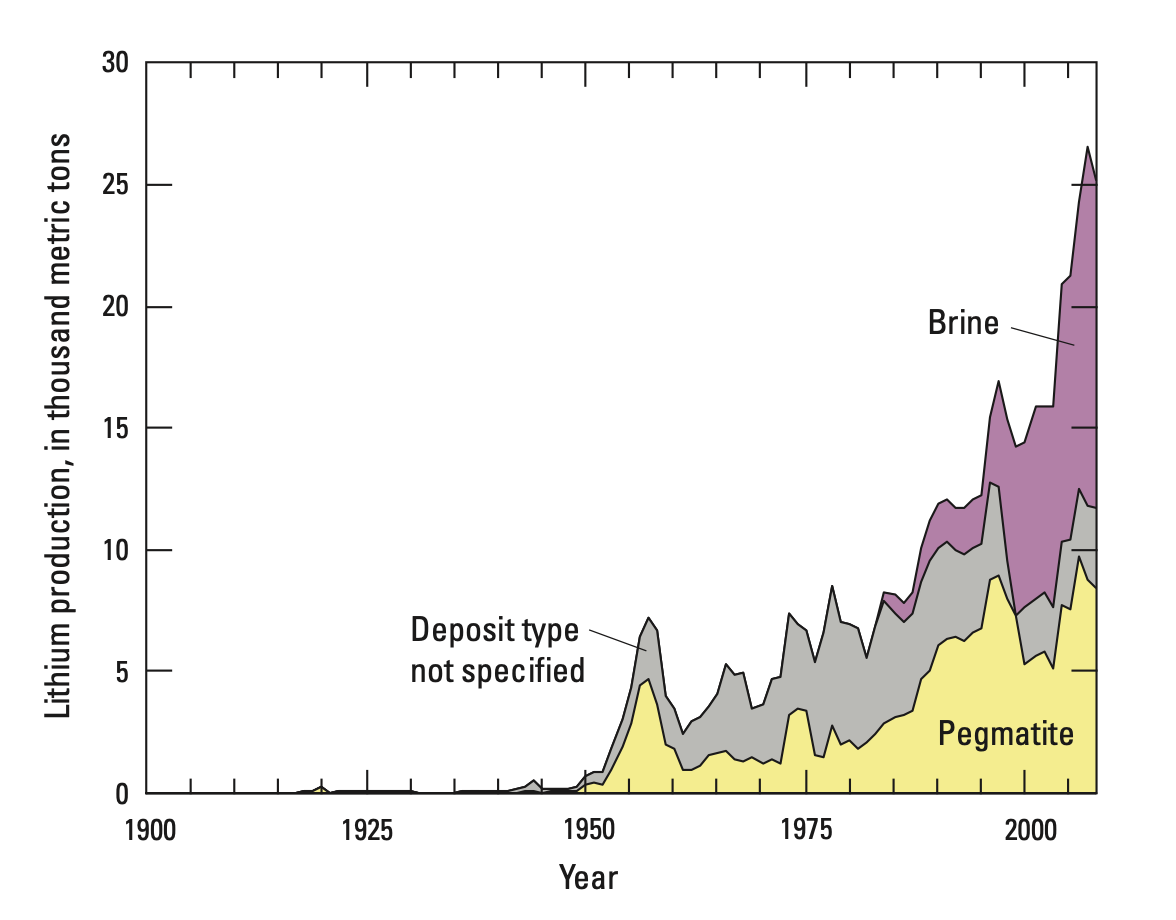
This graph is pretty telling. Almost no lithium was produced before 1950, so human activity couldn’t have been adding a meaningful amount to the groundwater back then. Serious lithium production started around 1950, which could help explain why obesity went from about 3% in 1890 to about 10% in 1980, but we see that lithium production truly spikes around 1980. While there have been a few ups and downs, production has as a rule continued to rise ever since. This graph only goes up to 2007, but USGS and other sources confirm that production has continued to increase, at about 11% per year from 2007 to 2017.
Lithium definitely ends up in the groundwater. It’s there in small concentrations naturally, but human activity adds more. In Seoul, South Korea, lithium concentrations sextuple as the Han river passes through the city’s densest districts. This is reflected not only in the river, but also in the tap water in the city — tap water from sites further along the river’s course have similarly elevated lithium levels.
This suggests that rivers pick up lithium along their course and generally have higher lithium levels as they flow downhill. This is supported by data from Austria, which shows that lithium levels in drinking water vary systematically with altitude, with higher concentrations of lithium found in districts at lower altitudes:

We should note that a paper looking at groundwater in the United States from 1992-2003 found the opposite effect: higher levels of lithium at higher altitudes. “However,” they say, “these findings should be interpreted with caution.” We agree. There are 3,141 counties in the United States, and they only looked at data from 518. They only examined data from 15 states, most of them states at relatively low elevation. These weren’t randomly selected, either; they were the sites with the highest number of lithium samples in the years 1992-2003.
We’ve already discussed the issues that come up when you conduct analysis on a restricted range of data. Further, the Seoul data shows that lithium levels spike around urban areas. If some of the high-altitude measurements were near or immediately downstream from cities or manufacturing areas, that might make it look like higher-altitude locations have higher levels of lithium on average.
Dosage
The therapeutic dose of lithium in blood serum is usually considered to be in the range of 0.8 – 1.2 mmol/L, though some sources suggest that lower doses are more effective, with the “minimum efficacious serum lithium level” being possibly as low as 0.4 mmol/L. To translate these to more familiar terms, 0.8 mmol/L is about 5600 ng/mL, and 0.4 mmol/L is about 2800 ng/mL.
That’s quite a lot. In comparison, lithium levels in groundwater rarely exceed 200 ng/mL. But perhaps surprisingly, even very low levels can have an influence on our health and mental states. One study examining data from 27 Texas counties between 1978-1987 found that rates of suicide and homicide (as well as other forms of violent and impulsive behavior) were negatively correlated with lithium in drinking water, over water lithium levels ranging from 70 to 170 ng/mL. Another study looking at various cities in Lithiuania (no relation to lithium) found a negative relationship between lithium exposure and suicide. The lithium levels in the public drinking water systems they examined ranged from 0.5 to 35.5 ng/mL, with a median level of 3.6 ng/mL. In general, reviews of this literature find that trace levels of lithium have a meaningful impact on behavior.
There’s only one randomized controlled trial examining the effects of trace amounts of lithium, but it finds the same thing. A group of former drug users (heroin, crystal meth, PCP, and cocaine), most of them with a history of violent crime or domestic violence, were given either 400 µg per day of lithium orally, or a placebo. For comparison, a normal clinical dose is 300,000 – 600,000 µg, taken two to three times per day. Even on this comparatively tiny dose, everyone in the lithium group reported feeling happier, more friendly, more kind, less grouchy, etc. over a four week period, “without exception”.
(These former drug users didn’t have normal moods to begin with — one said “I am always extremely moody and fight with my girlfriend frequently” before he was treated — so it’s not clear if trace amounts of lithium would improve mood in everyone else. Similarly, therapeutic doses are only given to patients with bipolar disorder, and it’s not clear what the effects would be on someone without this diagnosis.)
In the placebo group, people were just about as grouchy as before. When they switched the placebo group over to lithium, these people responded in exactly the same way.
This is pretty strong evidence that even very small doses of lithium can have meaningful effects. So should we be surprised that they don’t mention any weight gain? There isn’t much data on the time course of weight gain in lithium treatment, but it seems to come on pretty fast. In one study with normal therapeutic doses, 15 bipolar inpatients gained an average of 13 lbs (5.9 kg) over six weeks. While the sample size is quite small, this tells us that sometimes a lot of weight gain can happen fast.
We don’t think this is a huge problem. The randomized controlled trial on trace exposure only lasted a couple of weeks. Even if patients were gaining weight at the same rate as patients on a therapeutic dose, they might not have noticed. The researchers didn’t intend to examine weight gain, and probably didn’t measure it. They don’t report any other side effects. Heroin, crystal meth, PCP, and cocaine all make people lose weight, so it’s possible that weight gain in the former drug users would be seen as a sign of health. It’s also worth noting that while these trace amounts do appear to have real, consequential effects, the dosage was about 1,000 times smaller than a therapeutic dose. In this situation, it’s not crazy to think that weight gain might take a few weeks or even months to manifest. We see a version of the main effect — improved mood — in this tiny dose. It seems reasonable that we might see a version of this side effect as well.
This study can give us a lower limit not only of the dosage, but by extension, of the minimum effective serum level. As a ballpark estimate, therapeutic dosages are in the range of 1,000,000 µg per day and they lead to serum levels of around 5000 ng/mL. This means the 400 µg per day dose from the randomized controlled trial would lead to a serum level of around 2 ng/mL. Other sources suggest that blood levels may end up slightly higher on low doses. For example, doses in the range of 385 to 1540 µg per day lead to serum levels around 7 to 28 ng/mL. One study testing serum lithium as a compliance marker for food and supplement intake found that giving people lithium-tagged yogurt with a dose of about 1000 µg per day over a period of six weeks led to an increase in serum levels from 6 ng/mL to 46 ng/mL.
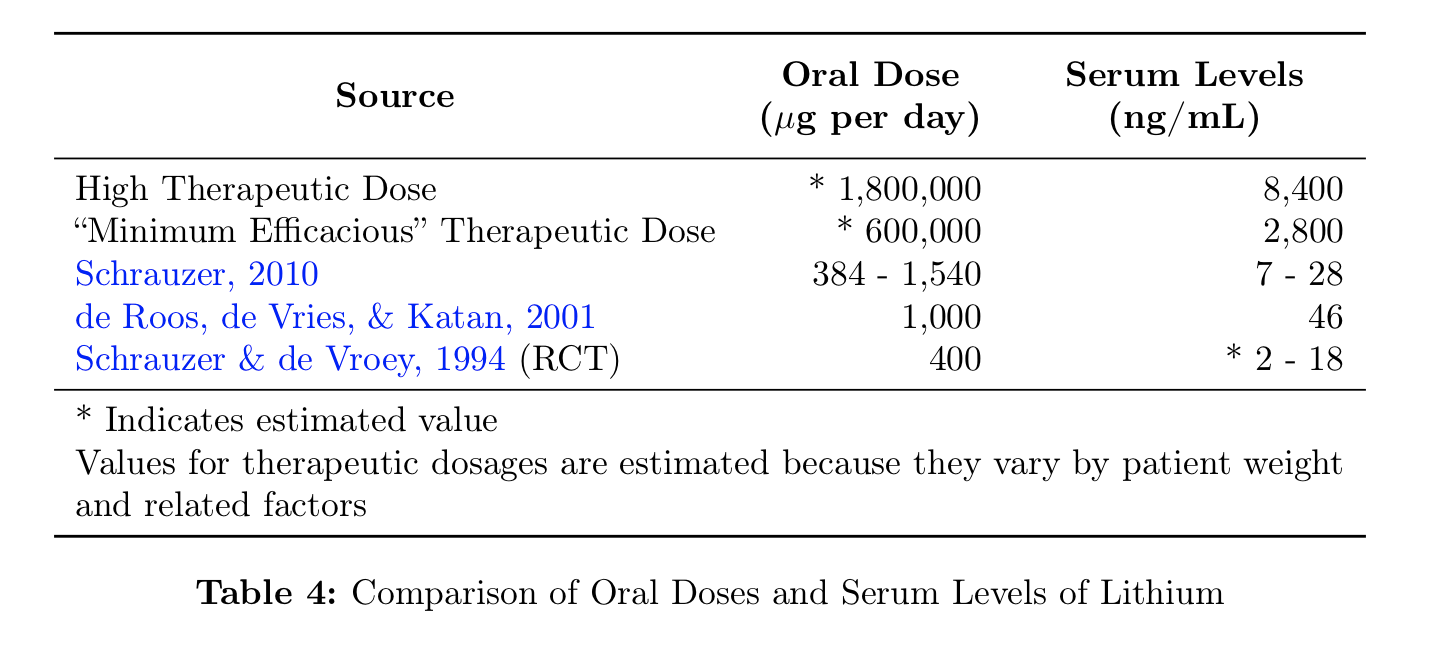
These papers disagree on the specifics but they agree on the general picture. A serum level in the range of 10 ng/mL is enough to influence mood, and a dose of about 400 µg per day is enough to get you there. Whether lower doses have an effect is unclear, but we should certainly be interested in numbers in these ranges and up.
Trace Exposure
There aren’t any other randomized controlled trials, but if trace amounts are enough to cause obesity, then we should see relationships between trace lithium levels and obesity rates.
In Texas, a survey of mean lithium levels in public wells across 226 counties (Texas has 254 in total) found lithium levels ranging from 2.8 to 219.0 ng/mL. Now Texas is not one of the most obese states — but it tends to be more obese along its border with Lousiana, which is also where the highest levels of lithium were reported.
West Virginia and Alabama, on the other hand, are two of the most obese states in the nation. We haven’t been able to find any reliable groundwater concentration data for these states, but we can certainly note that both of them have problems with lithium contamination coming from local mining operations. And it’s not just Alabama and West Virginia — other states are facing similar contamination.
In Greece, lithium levels in drinking water range from 0.1 ng/mL in Chios island to 121 ng/mL on the island of Samos, with an average of 11.1 ng/mL. Unfortunately there’s not much data on the prevalence of obesity in Greece, but we can conduct some due diligence by checking a few of these endpoints. Samos, with the highest levels, is the obvious place to start. On Samos, 10.7% of children aged 3-12 are overweight, compared to 6.5% on the island of Corfu. A full 27% of high schoolers on Samos island were overweight in 2010, and 12.4% were obese. In comparison, about 12.5% of American high schoolers were obese in the same period.
In the Caspian Sea, lithium concentrations are 280 ng/mL. As we’ve already reviewed, some of the most obese provinces in Iran border the Caspian. The Dead Sea has concentrations even higher, at 14,000 ng/mL, but for the obvious reasons, we don’t think people are getting a lot of their drinking water from the Dead Sea. On the other hand, obesity in the West Bank is pretty high — as high as 50% in men in 2003!
Very high concentrations of lithium have also been reported in Austria. For the most part, Austria has normal amounts of lithium in its drinking water, around 13 ng/mL. But in the east, the concentrations are much higher. In the Mistelbach district, the average level of lithium in the drinking water was 82 ng/mL, and the highest single measurement was near Graz, at 1300 ng/mL. Both of these are in eastern Austria, where obesity levels are highest. Mistelbach in particular is one of the most obese districts in the country.
Chile and Argentina are the most obese countries in South America (28% each) and are two of the biggest exporters of lithium in the world. Unsurprisingly, this is reflected in their groundwater.
In northern Chile, lithium levels in the groundwater can reach levels 10,000 times higher than normal. The rivers running through many small valleys see lithium concentrations of 600 – 1600 ng/mL. The drinking water in many towns has levels up to 700 ng/mL. And in the headwaters of the Rio Camerones, lithium hits concentrations of 24,880 ng/mL. In 1980, Zaldivar reported similar levels of lithium in the groundwater, stating that they were “the highest reported in the world”. He also measured serum levels in people at these different sites, and found values ranging from 22.3 ng/mL to 85.8 ng/mL.
(“We tried to find Zaldivar to learn more about his work,” says a later paper, “but to no avail. He left Chile when Pinochet came to power and effectively disappeared.”)
In Argentina, lithium can reach up to 1000 ng/mL in drinking water, and the locals end up with a lot of exposure. At the site with the highest levels, lithium concentrations reached an average of 4,550 ng/mL in people’s urine. The highest level in someone’s urine was actually a whopping 14,300 ng/mL. The locals seem to be getting much of their lithium exposure from their tap water, as the amount of lithium in urine was correlated with the number of glasses of water consumed per day (r = 0.173, p = 0.029).
These are all freshwater levels. In seawater, lithium concentrations are reliably quite high, ranging from 100 ng/mL to over 1000 ng/mL. Now, most people are not actually drinking meaningful amounts of seawater, but if you live near the ocean, you might still be exposed indirectly.
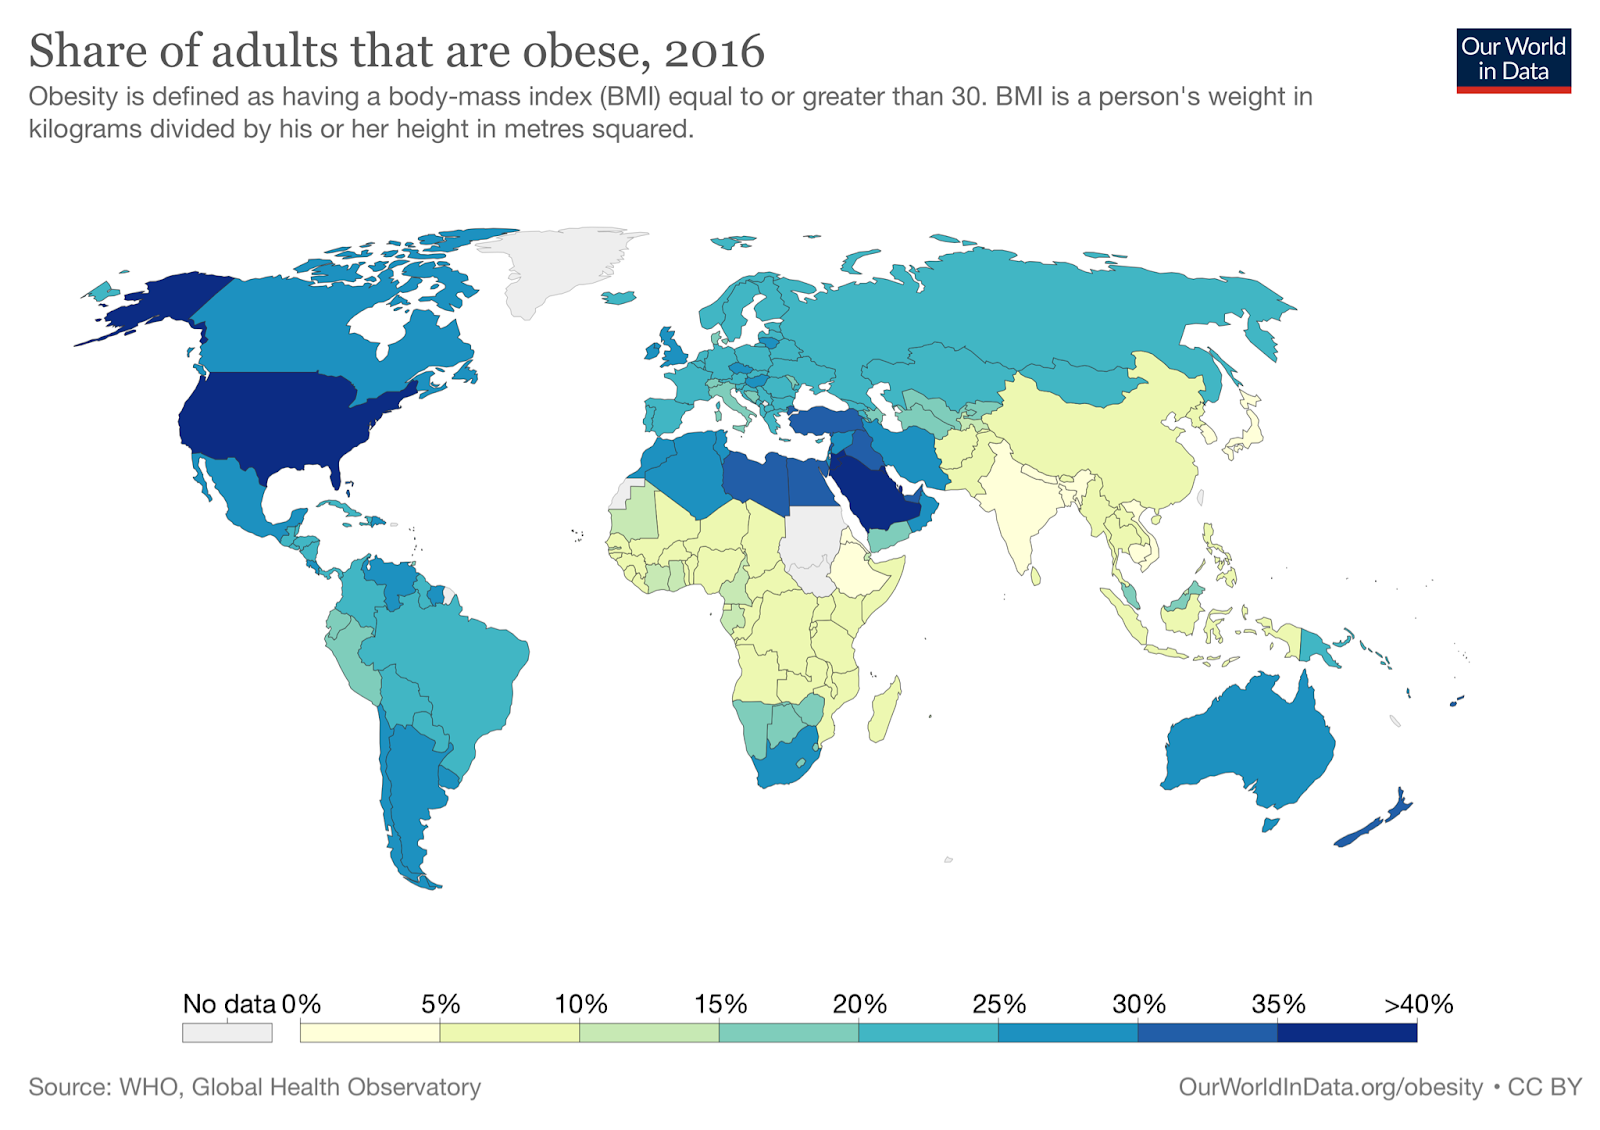
One mystery we haven’t mentioned yet is that the Middle East is extremely obese (see map below), one of the most obese regions on earth. Jordan, Qatar, Libya, Egypt, Lebanon, and Saudi Arabia all barely trail the United States in terms of obesity, and Kuwait is actually slightly more obese than the United States, about 38% obese compared to 36% in America. These countries are very dry, and so all of them get a lot of drinking water from desalinated seawater. Saudi Arabia gets about half of its drinking water from desalination and is one of the most obese nations on earth. Kuwait built its first desalination plant in 1951, and has actually been one of the most obese countries in the world for a long time. Back in 1975, when the rate of obesity in the United States was around 10%, the rate of obesity in Kuwait was about 18%.
Desalination removes all trace elements from seawater, but because distilled water corrodes metal pipes and trace elements are important to health, the desalinated water is remineralized by blending it with 5-10% brackish water. This means that desalinated water could easily have lithium concentrations of up to 100 ng/mL. Unlike contamination in some forms of drinking water, which might vary with factors like rainfall and industrial activity, we would expect lithium levels to be reliably high in desalinated water, because they are inherent to the source.
We even have some data about lithium levels in the waters of the Persian Gulf. Near Qeshm island, at least, seawater concentrations vary somewhat by season but are usually around 300 ng/mL. This is reasonably high for seawater and much higher than the levels usually observed in groundwater. Not all of that makes it back into the water after desalination, of course, but even if only 10% got back in, 30 ng/mL is still a pretty high dose to be receiving regularly.
(If you are a Kuwaiti or Saudi desalination engineer, please contact us! This blog has gotten 15 views from Kuwait and 26 from Saudi Arabia, we know you’re out there!)
In any case, if lithium from desalinated seawater doesn’t explain why the Middle East has such incredibly high rates of obesity, then some other explanation will have to be found for this extremely striking observation.
On average, people drink about 3 liters of water per day. If they’re drinking from a normal freshwater source with 1-10 ng/mL, they’ll get a dose of about 3-30 µg / day. If they’re drinking from desalinated seawater, with concentrations of about 30-100 ng/mL, they’ll get a dose of about 90-300 µg / day. If they’re drinking from sources like those found in Texas, Greece, and Mistelbach, with concentrations of about 100-200 ng/mL, they’ll get a dose of about 300-600 µg / day. If they’re drinking from sources like those found in Graz, Chile, and Argentina, with 1000 ng/mL, they’ll easily get a dose of 3000 µg / day or more:
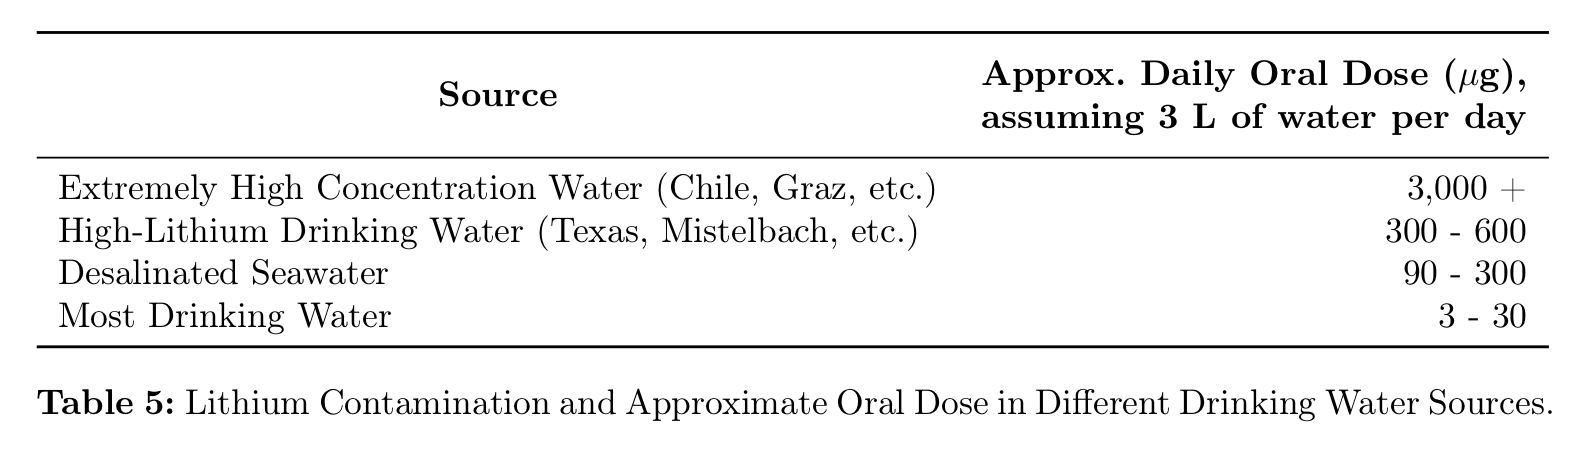
In comparison, therapeutic doses are in the range of 1,000,000 µg per day, but remember the randomized controlled trial showed effects at only 400 µg per day. Many people are getting doses of similar amounts from their drinking water alone. And this is assuming that they’re not also exposed to lithium in other ways.
Common Uses of Lithium
Which they probably are, because lithium has a wide variety of applications. In 2017, the USGS estimated that 48% of the global market for lithium was batteries, 26% was ceramics and glass, 7% was lubricating greases, the remainder being industrial uses like polymer production and air treatment. They also mention a couple uses like “agrochemicals”, airbag ignition, aluminum alloys, cement and concrete additives, and dyes and pigments.
You’ll remember from our review in the PFAS section that some of the most obese professions include firefighters, cooks, food workers, cleaning workers, motor vehicle operators, vehicle mechanics, transportation and material moving, healthcare support, health technicians, and some construction occupations (“Helpers, construction trades” and “Other construction and related workers”).
If you go and see your local auto mechanic, the black smears covering his hands and forearms might be engine oil. But they might also be lithium grease. This grease is ubiquitous in auto engineering, routinely applied to hinges, joints, and pivot points. It’s used in aviation and on many kinds of heavy machinery, including logging and construction equipment, trains, and tractors. It also has a number of household applications. You might put it on your garage door, or the hinges on the gate of your fence. About 7% of the global supply of lithium goes into lubricating greases of one kind or another. That’s a lot of grease.
In addition to any lithium they’re exposed to in their food and water, vehicle mechanics, truck drivers, and transportation workers are also constantly exposed to lithium grease at work. They may literally be rubbing the grease all over their hands. Like any grease, this is hard to get off your skin, in most cases requiring a special soap. Hopefully they keep it out of their eyes and mouth, but even so, it doesn’t seem like it would be great for you.
Construction workers also use lithium grease to lubricate their tools and equipment. They may be exposed through lithium added to concrete and cement. Lithium is used in agrochemicals like pesticides, though information on exactly what agrochemicals this includes is spotty. It’s possible that this explains the higher levels of obesity in cooks and food workers.
Lithium grease isn’t considered food-safe, and in theory it shouldn’t be used on food-handling equipment. In practice, however, manufacturers and restaurants don’t always follow regulations. A quick Google search reveals incidents like lithium grease being stored with food equipment, lithium grease being stored next to garlic bulbs, and lithium grease being stored above mustard.
It’s not clear if there’s a connection with healthcare professionals, firefighters, or cleaning workers. Maybe there’s a hidden lithium connection out there. But there doesn’t have to be. Lithium may just be part of the story — the rest could be explained by other contaminants, like PFAS.
And speaking of PFAS, there’s actually a connection. Lithium greases often include other substances to improve their performance, including Teflon, aka PTFE.
Bioaccumulation
One strike against lithium as an explanation for the obesity epidemic is that it only stays in the body for a few days, with a half-life of 18-36 hours. The medical consensus seems to be that it probably doesn’t bioaccumulate.
But this may not be a problem, for a few reasons. First, lithium may be able to affect weight without accumulating in the body. One possible mechanism by which environmental contaminants could cause obesity is by interfering with the microbiome. If exposure to lithium changes the composition of your gut microbiota, then exposure to lithium could have serious impacts on your weight without any bioaccumulation. Even brief exposure to lithium could have long-lasting effects. And in fact there is evidence that dietary lithium affects the microbiome, at least in rats.
Second, the medical consensus might simply be wrong. While lithium is traditionally measured in the serum, this may not be the best way to evaluate bioaccumulation. “In contrast to other psychotherapeutic drugs,” says one paper on the pharmacokinetics of lithium, “Li+ is fairly evenly distributed in the body, but in tissues such as the white matter of the brain, the bones, and in the thyroid gland the concentrations per kg wet weight are about twice those in the serum.”
A particularly interesting example is a case study of a patient who died after lithium poisoning. Researchers found that most tissue samples (“liver, spleen, kidney, lung, muscle, cardiac muscle, pancreas”) contained about the same concentration of lithium as found in the serum, in the range of 0.4-0.6 mmol/kg. But in the thyroid gland and in brain tissue (especially white matter), lithium concentrations were nearly twice as high as in serum, in the range of 0.7-0.8 mmol/kg. They suggest that this is to be expected, saying, “lithium has an increased affinity to thyroid tissue,” and, “high concentrations of lithium in brain tissue – especially in white substance – agrees with investigations that reveal the lithium elimination from brain tissue to be slow.”
This is particularly interesting not only because it seems to show evidence of bioaccumulation, but because of the particular tissues in which concentrations were found to be highest. The thyroid gland is very important to weight regulation, and so to find that lithium concentrations in that organ were second-highest in the body is very neatly in line with our expectations. Maybe it shouldn’t be a surprise, because lithium therapy is associated with thyroid disease.
For a while this was the best evidence of lithium accumulation in the brain, but a few weeks ago our friend Dr. Grace Rosen sent us this Nature paper published in March 2021. In this paper, the authors took 139 brain samples from three deceased individuals and took them to a nuclear reactor in Bavaria, where they were placed in a chamber and shot with a “well focused beam of cold neutrons with a neutron flux of ɸ = 1.2 × 1010 cm−2 s−1”. The lithium-neutron interaction gives a unique “associated coincident energy pattern”, which allowed them to measure the amount of lithium at different sites in the brains. Unsurprisingly, the patient receiving lithium therapy at the time of death had the highest concentration, but the brains of the other two individuals did as well, presumably from trace exposure.
Just like the case study above, they found that lithium was more concentrated in white than in gray matter. Additionally, the authors note that lithium concentrations were especially high in the thalamus and Brodmann Area 25. This is interesting for our purposes because Brodmann Area 25 “influences changes in appetite and sleep” and the thalamus governs “sensory relay in visual, auditory, somatosensory, and gustatory systems.” Both of these brain regions are related to eating behavior.
Sadly the authors did not examine any samples from the hypothalamus, which governs eating more directly, but this is still evidence that trace lithium bioaccumulates in brain regions that are important to the regulation of food intake and body weight.
[Next Time: HIGHLIGHTS FROM THE COMMENTS]

Not to be greedy on top of all this great work, but is it possible to conclude with any advice on “how to measure these contaminants in yourself / environment / drinking water and how to remove them” ?
LikeLike
No worries! We’re working on that and hope to cover it in a future post, it just takes a while to review and write up our findings.
LikeLiked by 1 person
The most important bit of any blog series-the parting advice.
LikeLike
That’s it kids, you’ve found it it’s got to be this. This seems like the toughest evidence so far. What could top this? Has to be it.
Campaign against Lithium NOW.
LikeLike
Surely, you mean “Randomized controlled trial NOW”?
LikeLike
Ordinarily yes BUT
For some reason, experimental methods in nutrition science seem to keep failing to come up with any generalizable conclusion. What I think is, before experimenting researchers need to consult with each other and ask themselves what would everyone consider strong, immediately actionable evidence and what would it take to provide that evidence? And then do exactly that and act on whatever the finding is. Otherwise you end up with someone somewhere who did an experiment that maybe shows this, but more studies need, oh here’s a critique, matter is still vague 15 years later with no end of back and forth, and basically a bunch of money was spent in one direction, leading to something, that wasn’t everything to anyone leading anybody anywhere.
TLDR nutrition science needs a massive return to the drawing board and a reassessment of how conclusions are meant to be made. If they are forever telling us the science is difficult, that we need to be patient, that they don’t have clarity yet, but they feel they are on the cusp of delivery, only to find a decade later. they’re saying the same thing, then I think we need to start questioning whether the money and effort in this direction is worth it at all.
LikeLiked by 2 people
A question I have is that the first half of the 20th century had popular consumption of lithia water and lithated drinks like 7-up and lithia coca-cola. It fell out of favour around the middle of the century around where the obesity spike starts. I don’t know enough about just how much was consumed to say whether it is a strike for or against your argument but it would be worth looking into.
LikeLike
Yeah good points — a friend of ours happened to send us something about 7-up being lithated totally by coincidence a few months ago.
We weren’t able to find much about historical consumption of these drinks and there’s pretty much no obesity data during the span they were consumed in (1929-1948). There are also some signs that, if trace lithium causes obesity, you gain more weight if the trace dose is more consistent. A lithated 7-up every few days may not be consistent enough to cause obesity? But this is all very speculative. If anyone has better data on lithated drinks we would be interested to hear about it.
LikeLike
Is there a correlation between increase in obesity and reduction in violence?
I’m thinking of the theory that removing lead from gasoline reduced violence, but reading this article today made me wonder if it was increase in lithium instead.
Great series!
LikeLiked by 1 person
Oh dang, you might be right!
Thanks!
LikeLiked by 1 person
One thing that makes me skeptical is the increasing depression rates.
Shouldn’t increasing exposure to lithium have an effect on that?
Just thinking out loud here.
LikeLiked by 1 person
This is a good question… lithium is primarily used to treat bipolar disorder, especially mania — “to stabilize mood and prevent manic episodes, but … also be helpful in the acute treatment of manic episodes”. We kind of suspect it is a sedative. In this case it seems like low doses of a sedative could cause something that looks like depression. Or to put it another way, there’s very little research on what psychiatric meds do to people without psychiatric disorders, but it seems likely that if lithium can take a manic person and make them stable, it could also take a stable person and make them depressed.
Rates of bipolar disorder do seem to be going up a tiny bit, but they haven’t increased much since the 90s. Also the minimum therapeutic dose for bipolar is much, much higher than what anyone would be getting from trace exposure.
LikeLiked by 1 person
If obesity is caused by anything (lithium or whatever) that accumulates in the body, people should get fatter as they get older. Is that the case?
Are people in their twenties more obese than people in their fities? Do you have data on this?
From my personal obervation, people might ideed get more obese as they age (with the exception of high age when they lose weight, but I assume this is an effect of an age related change in metabolism). However, as far as I can tell any age related increase in obeseity seems much smaller than the increase of obesity that apperently happened within the last 50 years or so.
LikeLike
Oh yes, people absolutely get more obese as they age. In addition, before 1980 or so, people actually got slightly leaner as they got older, so the getting fatter as you age thing is pretty new! See Part I where we review a little bit of the evidence on this: https://slimemoldtimemold.com/2021/07/07/a-chemical-hunger-part-i-mysteries/
This is a good comment, thank you!
LikeLike
FWIW, there are also several RCTs showing benefits of lithium microdoses for Alzheimer’s/dementia broadly (and, IIRC, pro-neurogenesis evidence in animals):
– A meta-analysis of 3 RCTs of using lithium for cognitive decline/alzheimer’s finds that L significantly decreases cognitive decline relative to placebo (I have the pdf, two studies had regular-ish lithium doses, one had a microdose of 0.3mg/day): https://pubmed.ncbi.nlm.nih.gov/26402004/
– A similar review for dementia (for both standard and ‘trace’ doses) with similar findings: https://pubmed.ncbi.nlm.nih.gov/24919696/
– A more editorial analysis of various studies on lithium and alzheimer’s/dementia/cognitive decline: https://journalbipolardisorders.springeropen.com/articles/10.1186/s40345-020-00188-z
– Danish correlation study finds an association between higher drinking water levels of lithium and lower incidence of dementia/Alzheimer’s: https://www.ncbi.nlm.nih.gov/pmc/articles/PMC5710473/
– Similar correlational study with equivalent findings in Texas: http://dx.doi.org/10.3233/JAD-170744
– However, another correlational study that sought to control for cofounders found that lithium didn’t help: https://jamanetwork.com/journals/jamapsychiatry/fullarticle/2680802
Myself and several family members, as well as some friends/acquaintances, have been on microdoses of lithium (orotate, 1-2mg/day) for a year+ now, because of the purported cognitive benefits. Myself and family get lithium tested every now and then; we’ve confirmed that, at least per the blood serum tests, we had 0-0.01 mmol/L prior to starting supplementation, and now are at around 0.09 mmol/L (normal therapeutic range for bipolar/etc. being 0.6-1.2 mmol/L, FYI).
How have we fared over the year? No weight adjustments for all but one, a male in 60s, who’s lost ~15 pounds after restarting physical activity following the lifting of COVID restrictions.
Will we see negative effects in 20 years of this? Perhaps, but I’m not sure. I’d want to see more rigorous analysis of locale-by-locale water lithium levels and obesity stats, with all the usual confounders controlled for. The water-content studies in the article are compelling, and go in contrast with our personal experiences supplementing lithium, but I am left wondering to what extent they represent a meta-analysis, or if they are just focused on studies and correlations that support the thesis of the piece.
I’m afraid everything is multifactorial and complicated!
LikeLike
“In any case, if lithium from desalinated seawater doesn’t explain why the Middle East has such incredibly high rates of obesity, then some other explanation will have to be found for this extremely striking observation.”
Could it be as simple as that the weather is horrible in Arabian oil states and most people are rich enough to afford AC and cars, so they rarely walk outside and overall get little exercise? I know you discounted exercise as a factor in an earlier post, but this seems like an extreme case.
LikeLike
Another connection that you might consider trying to get data for is another subset of “transportation and material moving” workers, namely seafarers. The reason I bring this up is because sea-going ships are equipped with desalination equipment (some are evaporators but more are reverse-osmosis types). But those folks (of which I am one) are getting a double whammy: both drinking water from the sea *and* working around lots of chemical lubricants. I imagine there are datasets from insurance groups covering maritime unions; most seagoing labor is unionized. I know that anecdotally, the joke among American seafarers goes something like, when doing AED training and discussing the things that predispose a person to cardiac arrest, all you have to tell the guys is to look around the room.
LikeLike
That’s a really good note, thank you!
LikeLike
To this point, the Navy is the fattest service branch at a 22% obesity rate. https://www.businessinsider.com/navy-is-fattest-branch-of-us-military-pentagon-report-reveals-2019-9
LikeLike
[…] with glyphosate. For what it might look like when they believe there is a connection, let’s take lithium as an example. They would love to be able to tell you how much lithium is in the groundwater, and how much […]
LikeLike
I moved to Colorado years ago and found out that high altitude states have higher suicide rates: https://www.ncbi.nlm.nih.gov/pmc/articles/PMC3114154/
Wonder if suicide/obesity correlate negatively in high altitude states?
Looking forward to figuring out how to get my water tested for lithium,
LikeLike
If Lithium is causing obesity by mucking with leptin levels and causing increasing hunger, then shouldn’t the data actually reflect increasing calorie intake? If one of the mysteries we’re trying to solve is why has obesity increased while calorie intake hasn’t increased that much, and the proposed mechanism is an element that causes obesity by increasing calorie intake, I’m not sure how to understand that.
LikeLike
Good question. The mechanism by which clinical doses of lithium causes obesity is poorly understood, but some studies suggest that people who gain weight on lithium don’t eat much more, so the mechanism may not have much to do with increased calorie intake. But OTOH, if you gain a lot of weight you will have to eat more just to support your body, so there may still be an increase? Again good questions, it’s not entirely clear.
LikeLike
Well, from a calories in – calories out model, just a tiny bit lower metabolism, thermal generation, fidgeting, or an extra french fry occasionally would lead over time to enormous weight gain. It might not be from a calorie change, and if it was, it would be a very tiny signal.
LikeLiked by 1 person
This may not correlate, but this study may have found that lithium intake decreased mitochondria (the powerhouse of the cell that produces ATP or energy from food) functionality (in sperm, but mitochondria function similarly in all cells?). I could be way off here though. Just want to join in the amazing conversation!
https://pubmed.ncbi.nlm.nih.gov/33842567/
LikeLike
Thanks, we’ll take a look!
LikeLike
One societal change that took place around 1980, at least in the US was a great increase in drinking water. We were told we were underhydrated and should drink 8-12 8 oz. glasses of water a day. Whatever chemicals we got with that H20, we got more of them. I don’t know how popular water consumption was in Japan and India during those years.
LikeLike
The series of articles has been very thought-provoking. Here are some thoughts provoked in me:
We should be focused on the “set point” or stasis level of weight that we return to after forays into dieting or overeating. But, although this set point seems more stable than our weight, is it really? No one was born 100 lbs. overweight, but at some point they were 10 lbs. over, then 25 lbs, and so on.
The articles seem to say it’s all beyond our control and environmentally based, but can’t we raise our stasis levels? Most all of us have in our life, to this point. We know that our set points have gone up over time, but how is that accomplished? And can we make this stasis point go down?
It’s been almost eight years since I lowered my set point weight, but I’m not sure what I did to affect that change. As a 65 year old, 6-footer in the Detroit area of Michigan, over 10 months I went from a BMI of 28.1 to one of 22.4, a 20% reduction in my weight. Over the subsequent years, my weight daily has rarely varied +/- 3 pounds over those years. Before the reduction, I was always a bit chubby. I don’t take any medications or vitamins. I walk 8,000-10,000 steps a day. I definitely eat less than before, but I eat everything and love sweets. I’m sure my genetics play a role in my overall health, but how did I lower my stasis point to where I wanted it and how can others do so? I’m not sure. But I’m open to thoughts about it.
LikeLiked by 1 person
I also noticed that my dads set point decreased around his 60s-70s, from normal/chubby adulthood to quite skinny. (He is 81 now). I also experienced a reduction of about 8kg or 15% body weight after a surgery, but have only been here for two years, so not sure how transient or stable this setpoint is.
And likewise, I am extremely curious to know what happened. Did something in my tissues change? If only it was in popular culture for us to have regularly measured biomarkers.
LikeLike
You’ve mentioned that Maine is an obesity outlier.
In the late 1960s or early 1970s, 2 Naples Maine relatives mentioned to me that someone (government or company official) was approaching people asking to pay them to use their old unused wells. The impression from my relatives was that it was happening fairly wide-spread and not an isolated incident. (This is the story as I remember it.) My relatives were highly suspicious as to what someone would want to do or dispose of in old wells. I found this creepy too and the story has always stuck with me 50 years later.
LikeLike
That is super creepy! Also creepy because our next interlude includes a whole lot about wells!
LikeLike
I just remembered that at the time, my concern was that it was nuclear waste or toxic waste that the government or much more likely, industry was looking to secretly dispose of. I was just a kid, so I have no idea if my relatives also suggested this or if it was just my own thought back then, and of course I have no first-hand knowledge at all.
LikeLike
I am curious if there are other conditions that side effects of Lithium that have also increases over the same period (or over the same geography). It looks like Bruxism is a potential lithium side effect. I can’t find good by state or by year date on Bruxism cases.
LikeLike
Many towns in Japan have Lithium in their water.
http://news.bbc.co.uk/2/hi/8025454.stm
https://www.ncbi.nlm.nih.gov/pmc/articles/PMC3863886/
https://pubmed.ncbi.nlm.nih.gov/32593289/
Besides advocating its use, this has a little info about prior use of lithium
https://nypost.com/2020/08/05/lithium-laced-drinking-water-could-curb-suicide-rates/
Does the theory take account of how much more of the day we spend eating? The system does not get a break and a chance to detoxify. Sachin Panda’s Lab at Salk Inst is doing a lot of work in circadian patterns. His interviews with Rhonda Patrick are worth listening to. His website has all his publications.
LikeLike
Yeah! We’re doing a review of lithium levels in Japan in our next post, but we hadn’t seen a couple of these sources. We’ll add them, thanks!
The upshot is that levels in Japanese drinking water are much lower than those in other industrialized countries, and about the same as levels in American drinking water in the 1960s.
LikeLike
The discussion with regarding lithium is interesting. I actually take lithium supplements as recommended by the Life Extension Foundation (trace amounts) as it presumably is a Longevity agent that improves mood and reduces Alzheimer’s risk.
https://www.lifeextension.com/magazine/2021/8/lithium-slows-brain-aging
LikeLike
I live in Munich and asked my local water works about the Lithium levels in the local drinking water, they were kind enough to respond. They say it is not one of the parameter that has to be monitored by law, but they still measure it sometimes. It is 0,001 – 0,002 mg/l, which is 2 ng/ml, so very low.
I think Munich residents have the lowest average BMI in all of Germany.
LikeLike
That’s great, thank you!
LikeLike
Middle east always reminds me of plastic water bottles, standing outside on pallets in the sun, before going into the shops. Leaching potential was always my first thought.
Thank you for an excellent article series.
LikeLike
I love the way your blog lays out the mystery of the obesity epidemic and explores many innovative theories. I was most convinced by your proposal that antibiotics are the root cause. Since they are put in the food chain specifically to cause weight gain in animals it would hardly be surprising if they were a major cause. And you point out many other reasons to suspect this as the cause.
I’m less convinced about lithium. I checked Google Scholar for papers that mention lithium and obesity. I found this paper that looks at the relationship between lithium and obesity (and Alzheimer’s) across different regions of Texas:
“Examining the Relationship between Trace Lithium in Drinking Water and the Rising Rates of Age-Adjusted Alzheimer’s Disease Mortality in Texas” (Journal of Alzheimer’s Disease, 2018)
https://pubmed.ncbi.nlm.nih.gov/29103043/
The paper found that lithium levels in drinking water are in fact negatively correlated with obesity (the opposite of what you propose). It’s true that this type of correlational study does not provide evidence of causality, but it is still hard to explain if you believe that lithium is a major cause of obesity. They gathered data across a large range of lithium in many regions, so how could no obesity signal show up to support your hypothesis? There are also many other papers in the literature on how lithium potentially prevents or delays Alzheimer’s, possibly due to preventing obesity and diabetes.
LikeLiked by 1 person
Yes, I found this study too, and I think this needs to be addressed!
LikeLike
> In Texas, a survey of mean lithium levels in public wells across 226 counties (Texas has 254 in total) found lithium levels ranging from 2.8 to 219.0 ng/mL. Now Texas is not one of the most obese states — but it tends to be more obese along its border with Lousiana, which is also where the highest levels of lithium were reported.
Looking at the map in the paper (https://sci-hub.se/https://sciencedirect.com/science/article/abs/pii/S002239561200372X) it looks like the border with Louisiana (the eastern border) actually has pretty low lithium concentrations. It’s a bit confusing because the shading is dark, but the caption says “darker areas represent lower levels”. I haven’t read the rest of the paper though.
LikeLiked by 1 person
This could get complicated if some chemical is responsible for both the obesity epidemic and is also suppressing violent crime or suicide rates at the population level.
First glance at studies seem to show obesity and homicide rates as correlated, obesity and suicide risk as anti-correlated, and homicide and suicide as correlated almost everywhere except in the US. So that’s weird, but you might want to look at other population level behavioral changes since the 1980s to see if anything else pops up.
https://www.ncbi.nlm.nih.gov/pmc/articles/PMC5907588/
https://pubmed.ncbi.nlm.nih.gov/22871535/
https://pubmed.ncbi.nlm.nih.gov/28104563/
Many others if you want to go down this rabbit hole…
LikeLike
> obesity in the West Bank is pretty high — as high as 50% in men in 2003!
This seems wrong according to your own source. It says
> The prevalence of obesity was 36.8 and 18.1% in rural women and men, respectively, compared with 49.1 and 30.6% in urban women and men, respectively.
LikeLike
update to EPA measurement of lithium: https://www.usgs.gov/news/lithium-us-groundwater#:~:text=Just%20this%20January,%20lithium%20was%20added%20to%20the,standards%20set%20under%20the%20Safe%20Drinking%20Water%20Act.
LikeLike
It’s interesting that sugar reduces lithium. Older women I knew used to diet by sucking hard candy to control their appetite. (This didn’t work for me fwiw). They made it sound like it was common back in the 1960s.
And I know their was an ad campaign telling people to use table sugar to control their “appetot” which seems to have been a similar concept to lipostat.
The ad campaign was countered in the 1970s with updated nutritional information about CICO and other things we now know are wrong. So I wonder if they weren’t on to something?
https://rarehistoricalphotos.com/sugar-vintage-ads/
LikeLike
A few comments:
1. Desalination
——————
While Li might be high in general in the feedwater in certain regions, I don’t see (but not a desalination engineer) how adding back brackish water automatically increase Li concentration.
If the water is distilled, all mineral stay in the brine and if a fraction x is added back to the distillate, the ratio of ions should stay the same.
There are a couple different approaches (distillation, nanofiltration, reverse osmosis, ion exchange, …), maybe they have different enrichment ratios.
2. Endorheic vs. River Basins
————————————
Lithium and other pollutants are not only washed into the ocean, but collect in endorheic basins without outflow (Death Valley or the Great Basin). What about e.g. the Humboldt River Sink? Owens valley? Searles lake? Do these places have high Li concentrations? Are people there overweight?
If a basin is at high elevation, are people still overweight?
River vs endorheic might give a hint as to whether the contaminant concentrates with the salts, or evaporates.
This would be a fairly simple analysis to do:
Plot the level of obesity vs. the distance from the center (lowest point?) of the basin the area is in, and distinguish between river and endorheic basins.
For more localized basins, upwind/downwind splits could show whether the pollutant is carried away in the air.
3. PFAS
———-
There is a huge variety of PFAS, but some are used in vast quantities in the electronics and semiconductor industries. In general, these people are fairly slim.
Very recently environmentally motivated changes to reduce single use plastics (e.g. straws) let do its replacement with PFAS impregnated papers. Did these changes lead to any uptick in PFAS intake?
LikeLike
what if it´s not lithium, but cadmium?
it could explain the following mysteries:
no weight loss with boiling poatoes – perhaps washing out the cadmium?
no weight loss with tomatoes – a natural antidote to cadmium
no weight loss with milk products – same like tomates because calcium?
i come to this after all the people wrote, that they loose their appetite and hunger. Signs for a intoxication, or?
and if we look at the signs of cadmium intoxication, we can see a connection to adiposity – impaired mitochondria and sex hormones.
make it sense?
greetings from germany
LikeLike