
[PART I – MYSTERIES]
[PART II – CURRENT THEORIES OF OBESITY ARE INADEQUATE]
[PART III – ENVIRONMENTAL CONTAMINANTS]
[INTERLUDE A – CICO KILLER, QU’EST-CE QUE C’EST?]
[PART IV – CRITERIA]
[PART V – LIVESTOCK ANTIBIOTICS]
[INTERLUDE B – THE NUTRIENT SLUDGE DIET]
[PART VI – PFAS]
[PART VII – LITHIUM]
[INTERLUDE C – HIGHLIGHTS FROM THE REDDIT COMMENTS]
[INTERLUDE D – GLYPHOSATE (AKA THE ACTIVE INGREDIENT IN ROUNDUP)]
[INTERLUDE E – BAD SEEDS]
[PART VIII – PARADOXICAL REACTIONS]
A natural prediction of the idea that anorexia is the result of a paradoxical reaction to the same contaminants that cause obesity is that we should observe anorexia nervosa in animals as well as in humans.
We’ve previously reviewed the evidence that pets, lab animals, and even wild animals have gotten more obese over the past several decades. We’ve also argued that anorexia is a paradoxical reaction of the compound or compounds that cause obesity. Since nonhuman animals are getting more obese when exposed to these contaminants, we should expect that some of them will experience a paradoxical reaction and become anorexic instead, just like humans do.
All the animals we have data on are getting fatter, but some species are gaining weight faster than others. It’s very likely that there will also be major differences in the rate and degree of paradoxical reactions. It would be very surprising if these contaminants affect mice in the exact same way they affect lizards or stingrays.
When we look at obesity data for animals, we see that primates appear to be gaining more weight than other species, and this makes sense. Primates are more closely related to humans than other animals are, so anything that causes obesity in humans is more likely to cause obesity in primates than in other mammals, and more likely cause obesity in mammals than in non-mammals, etc. As a result, we expect that anorexia is also most likely to be found in other primates.
Testing this prediction is a bit tricky. A wild animal that develops anorexia will likely die. As a result it won’t be around for us to observe, and won’t end up in our data. While pets and lab animals receive a higher standard of care, they may not survive either.
As far as we can tell, when veterinarians notice that an animal is underweight and not eating, they don’t generally record this as an instance of an eating disorder. Instead, when a young animal doesn’t eat and eventually wastes away, this is often classified as “failure to thrive.” This is further complicated by the fact that veterinarians use the term anorexia to refer to any case where an animal isn’t eating, treating it as a symptom rather than a disorder. For example, a dog might not eat because it has an ulcer, or has accidentally consumed a toxic substance, and this would be recorded as anorexia. In humans, we would call this something like loss of appetite, which is itself a symptom of many disorders — including anorexia nervosa. (We’d love to hear from any vets with expertise in this area.)
As a consequence of all this, we don’t expect to find much direct evidence for anorexia in different species of animals. We do however expect there to be plenty of statistical evidence, because there are many statistical signatures that we can look for.
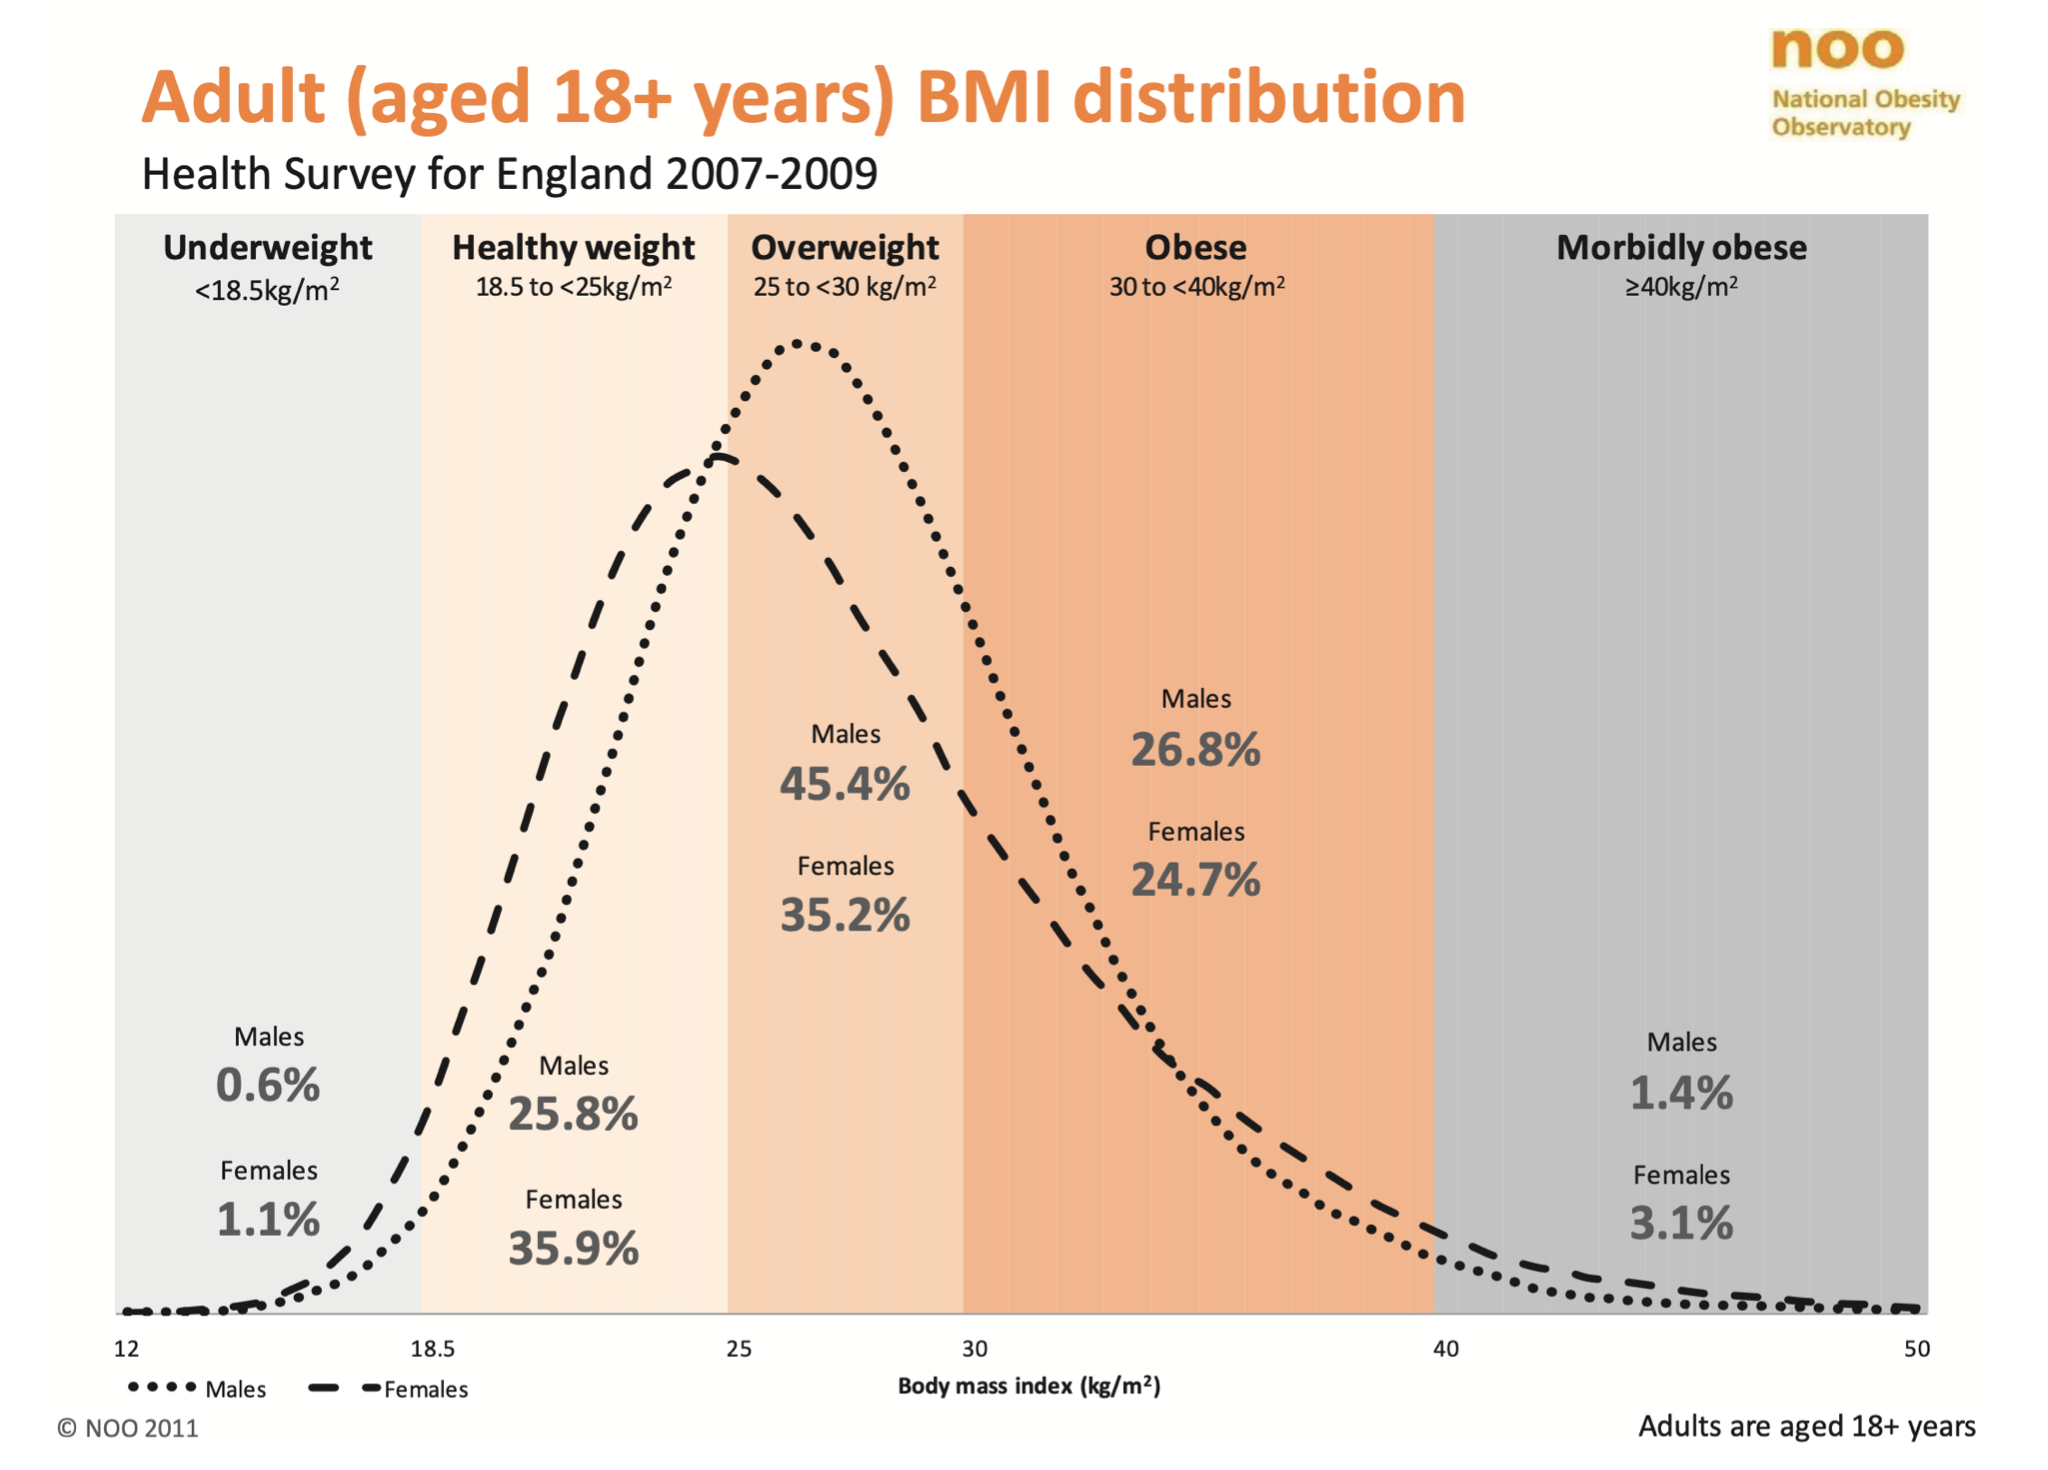
One thing we can look for is increased variance in body weights. Everyone knows that the average BMI has been going up for decades, but what is less commonly known is that the variance of BMI has also increased since 1975. When expressed in standard deviation, it has almost doubled in many countries. As correctly noted in The Lancet, this “contributed to an increase in the prevalence of people at either or both extremes of BMI.”
We should expect that animals today will have higher variation of body weights than they did in the past, just like humans do. We can similarly expect that animals that live in captivity will have higher variation of body weights than animals that live in the wild.
A particularly telling sign of this will be that while animals today (or in captivity) will on average be fatter than animals in the past (or in the wild), the leanest animals will actually be in the modern (or captive) group. We may not see animals with recognizable anorexia, but we should expect to see animals that are thinner than they would be naturally, which is presumably thinner than is healthy for them.
We might also expect to see different patterns by sex. In humans, women have higher variance of body weights than men do, which may explain why anorexia is more common in women than in men. This may not be the case in all species — it may even reverse. But a gender effect is what we see in humans and so we might also expect to see it in other animals as well.
Long-Tail Macaques
In nonhuman animals, we use BMI equivalents. Sterck and colleagues developed a weight-for-height index for long-tail macaques which they called WHI2.7, which can function much like BMI does for humans.
For BMI in humans, values above 25 are considered overweight and values below 18.5 are considered underweight. For WHI2.7, the authors suggest that values above 62 indicate the macaque is overweight and values below 39 indicate the macaque is underweight.
Sterck and colleagues developed this measure by looking at macaques in their current population of research subjects, but they also compared the measurements of their research population to the measurements of the founder generation at Utrecht University from 1987 to 1989, and to some measurements of wild macaques from Indonesia in 1989.
Consistent with other observations of lab animals, we see that the macaques in the research population in 2019 are quite a bit fatter than the wild macaques in the 1980s (see table & figure below). The current population has an average WHI2.7 of 53.95, while the wild macaques had an average WHI2.7 of only 38.26. The current macaques are also quite a bit fatter than their ancestors, the founder group from the 1980s, who had an average WHI2.7 of 48.76.
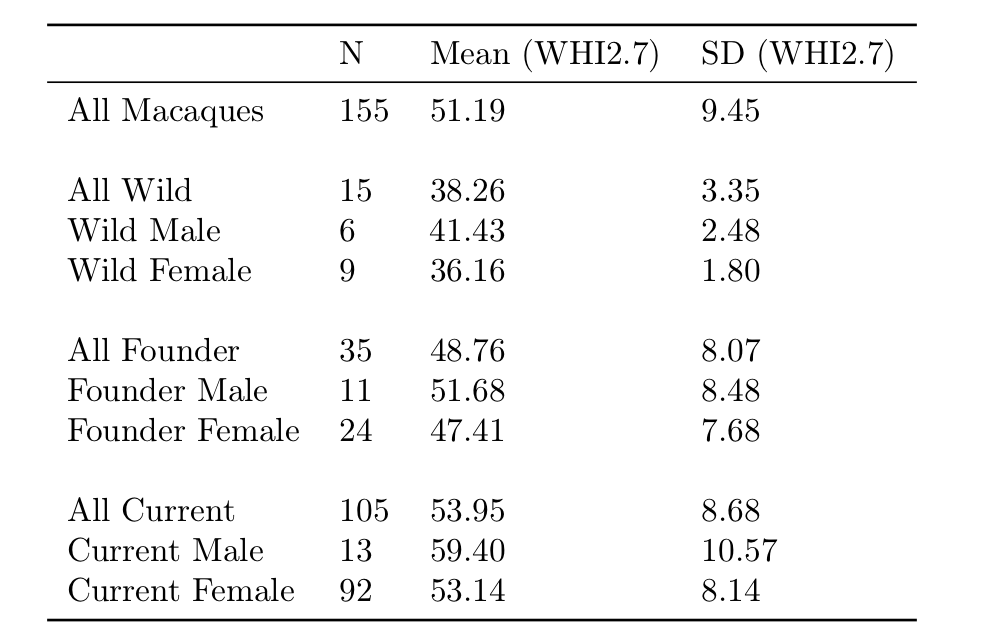
When we look at the standard deviations of these weight-height indexes, we find that the wild macaques in 1989 had a standard deviation of only 3.35, while the current population in 2019 had a standard deviation of 8.68! The founder population was somewhere in between, with a standard deviation of 8.07 (and this is slightly inflated by one extreme outlier). As macaques in captivity become more overweight and obese, the variance in their weight also increases. We can note that the standard deviation more than doubled between wild macaques and the current research population, and this is similar to the change in the standard deviation of human BMIs from 1975 to now, which approximately doubled.
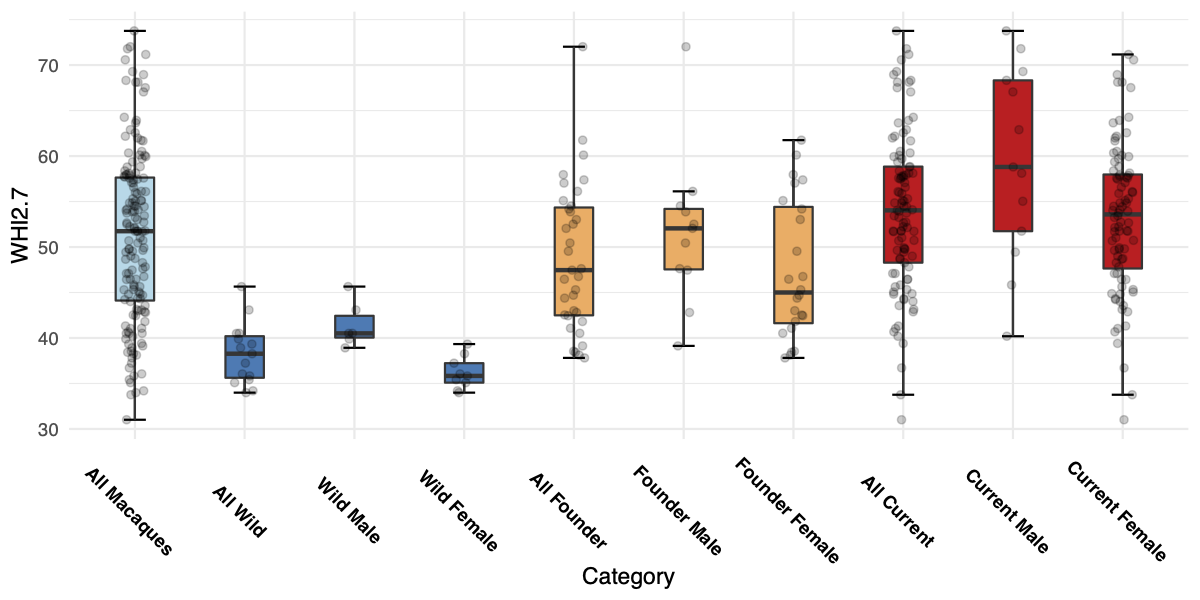
The wild monkeys were the leanest on average, with most of the wild females slightly underweight by the WHI2.7 measure. But the very leanest monkeys are actually in the current population, just as predicted. The leanest wild macaque had a WHI2.7 of 34.0, but the two leanest monkeys overall are both in the current population, and had WHI2.7 of 33.8 and 31.0. All of these leanest individuals were female.
As these observations suggest, there are consistent sex effects. In all three groups, male macaques have higher average WHI2.7 scores than females. In the wild group, the distributions barely overlap at all — the leanest male has a score just barely below that of the heaviest female.
Taking sex into account, the change in variance is even more pronounced. The wild macaques had a standard deviation in WHI2.7 scores of 3.35, but because the male and female distributions were largely separate, the standard deviation for males was 2.48 and the standard deviation for females was only 1.80.
This means that for the female macaques, the standard deviation of body composition scores increased by a factor of more than 4.5x, from 1.80 in the wild population to 8.14 in the current population.
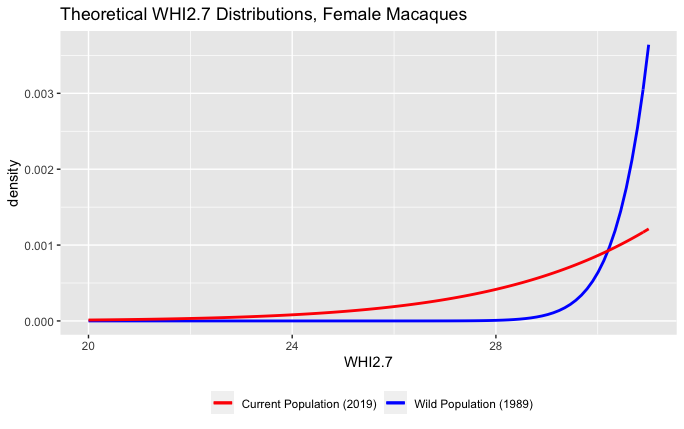
We can use these data to make reasonable inferences about what we would see with a larger population. Weight and adiposity tend to be approximately normally distributed, and when we look at the distribution for WHI2.7 in these data, we see that the scores are indeed approximately normally distributed.
For these analyses, we’ll limit ourselves to the female macaques exclusively. Every underweight macaque in this dataset is female — not a single male macaque is classified as underweight. In every group, the mean WHI2.7 is higher for males than it is for females. Just as in humans, being underweight seems to be more of a concern for females than for males.
We could use this information to estimate what percent of macaques are underweight (WHI2.7 of 39 or less). But this doesn’t make sense because we already know that the wild macaques are underweight on average (mean WHI2.7 of 38.26). This is because that threshold, a WHI2.7 of 39, is based on the body fat percentage observed in these same wild macaques.
(This is quite similar to humans who don’t live a western lifestyle. On the Trobriand Islands, the average BMI was historically around 20 for men and around 18 among women, technically underweight by today’s standards.)
The authors also suggest that a WHI2.7 of 37 is perfectly healthy. Even though some of the macaques have WHI2.7 scores below 37, all macaques were examined by veterinarians as part of the study, and seem to be perfectly healthy (99% had BCS scores above 2.5, which indicates “lean” but not thin and certainly not emaciated). Other sources suggest that macaques can still be healthy even when they are thinner than this. Essentially, the threshold of 39 or even 37 isn’t appropriate for our analysis, because macaques appear to be largely healthy in this range.
While it’s hard to determine what WHI2.7 would indicate that a macaque is dangerously underweight, we’ve based our analysis on the leanest macaques we have data for. All the macaques we have data for have WHI2.7 scores above 30. We know that they were all surviving at this weight and the leanest were rated by the vets as merely thin, not emaciated. As a result, 30 seems like a good cutoff, and we can calculate approximately how many macaques would have a WHI2.7 below 30 in a larger population.
The wild female macaques have an average WHI2.7 of 36.16 with a standard deviation of 1.80. Based on this, in a larger population about 0.03% of wild female macaques would have a WHI2.7 below 30.0.
The female macaques from the current research population have an average WHI2.7 of 53.14 with a standard deviation of 8.14. Based on this, in a larger research population about 0.22% of current macaques would have a WHI2.7 below 30.0.
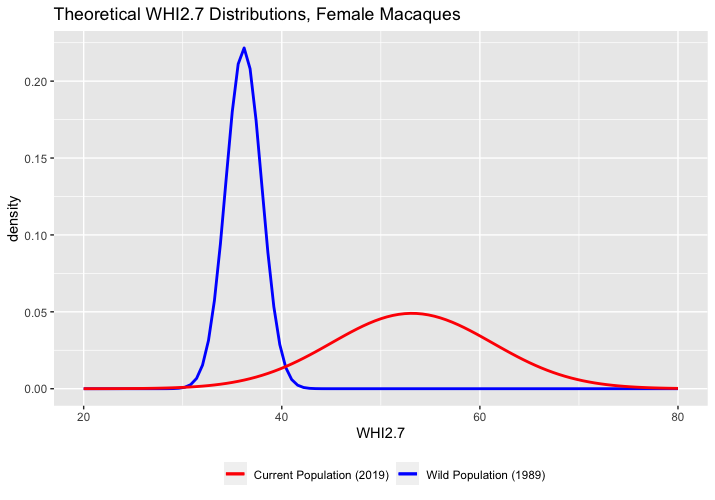
This shows an increase in the mean WHI2.7 and an enormous increase in the variation, just what we would expect to see if anorexia were the result of a paradoxical reaction. In addition, we see that the increase in variation also leads to an increase in the number of extremely underweight macaques (see below). If we tentatively describe a WHI2.7 of 30 or below as anorexic, then the rate of anorexia in female macaques in the current population is about ten times higher than the rate of anorexia in the wild population. The prevalence in the current female research macaques, 0.22%, is also notably similar to the prevalence of anorexia in humans, which is usually estimated to be in the range of 0.1% to 1.0% among women.
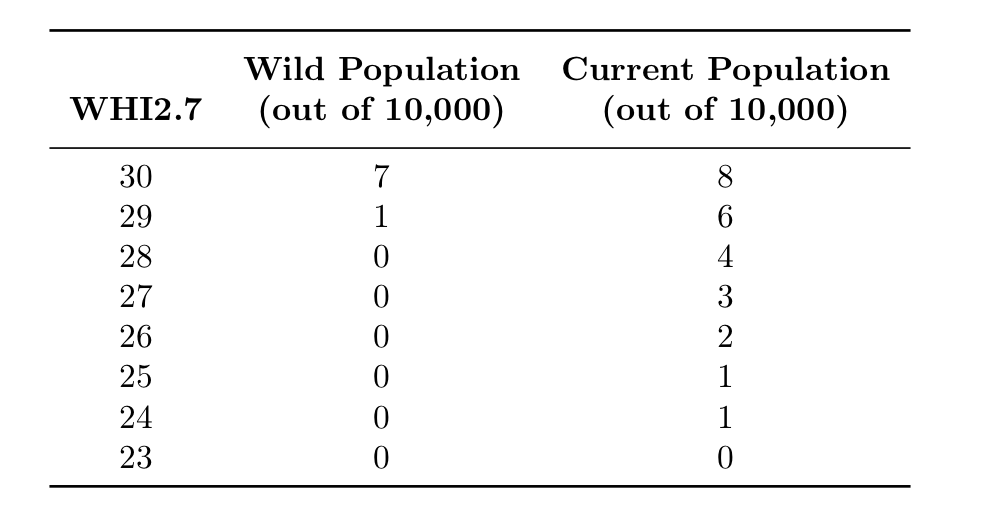
Another way to put this is that if we had a group of 10,000 wild macaques, we would expect about 7 wild macaques with a WHI2.7 of 30, 1 wild macaque with a WHI2.7 of 29, and no wild macaques with a WHI2.7 of 28 or below. In comparison if we had 10,000 macaques from a contemporary research population, we would expect about 8 macaques with a WHI2.7 of 30, about 6 macaques with a WHI2.7 of 29, about 4 macaques with a WHI2.7 of 28, about 3 macaques with a WHI2.7 of 27, about 2 macaques with a WHI2.7 of 26, about 1 macaque with a WHI2.7 of 25, about 1 macaque with a WHI2.7 of 24, and probably no macaques with WHI2.7 scores of 23 or below.
A different cutoff wouldn’t change the effect. For any arbitrary threshold, there will be more modern macaques at the extreme ends of the distribution. Based on what we know about healthy weights for these animals, 30 is a conservative cutoff, and the disparity only increases if we look at lower WHI2.7 scores.
It seems clear that a macaque with a score of 25 would be an extremely underweight animal, and from a simple analysis of the distributions, we should only expect to see these animals in a modern research population. In short, it’s clear that modern captive macaques have higher rates of anorexia than wild macaques from the 1980s, just the kind of paradoxical reaction this theory predicts.
[Next Time: DEMOGRAPHICS]

Very thought provoking and well researched piece. How about Japan? Very low rates of obesity. Similar issues with chemical residue. Anecdotally when I moved to Japan from the West I began to lose weight involuntarily, down to a BMI of 22. When I moved back to the West I regained weight. It’s a big rich country with plenty of processed, packaged food.
LikeLike
Yes, my daughter is going to college in Japan. They have the “Freshmen 15 lbs” over there as well, except it’s the 15 lbs the foreigners lose when they go on a Japanese diet. Got a few panicked messages about “not having anything to wear”… LOL
LikeLike
I think there’s a typo in the third paragraph from the end–it says “we would expect about 8 macaques with a WHI2.7 of 38,” when I think the number should be 30.
Really enjoying the series!
LikeLike
So it is! Good catch, thanks!
LikeLike
Oh my God the depth from start to finish is wonderful. Love when someone takes a slightly different, but thorough approach to a mainstream issue. That being said, while I think everything you’ve mentioned is likely related in some way to the obesity crisis, it seems unlikely to me that any of them, even in combination, can account for the sheer scale of obesity seen in recent decades.
Considering most of the calories any individual burns are a result of BMR, it seems to me that it probably relates to that somehow. We already know that human body temperatures have been reducing for decades in the developed world (https://elifesciences.org/articles/4955), so maybe this population change in BMR and what might be causing it is the smoking gun you’ve been looking for. At the very least, its a hypothesis worth exploring.
LikeLike
Aren’t there big intra country differences that go against some of these patterns? What about the income-obesity association? What about behavioral changes? Rise in TV watching while eating? End of family clearly defined mealtime -> scattered mindless eating?
LikeLike
Have you considered the rise of plastics and BPAs as a chemical culprit? Its use skyrocketed since the 80s it is in everything, water we drink wrapping our food etc. would be interesting to see what your numbers say.
LikeLike
Wouldn’t explain Japan’s lack of obesity.
LikeLike
Interesting. I don’t see much in the way of studies to see if BPA levels in Japan are comparable to the US and other nations with obesity problems. About the only info I could find on Japan was here:
https://www.scientificamerican.com/article/plastic-not-fantastic-with-bisphenol-a/
LikeLike
Very impressive.
How does lithium explain Japan’s lack of obesity? Lithium exists in Japanese drinking water (e.g. https://www.cambridge.org/core/journals/bjpsych-open/article/lithium-in-drinking-water-and-crime-rates-in-japan-crosssectional-study/9560374166F0D733F01F103BE5CE2E5C).
The length of the rivers is pretty short, so if it’s levels of lithium in groundwater, maybe that would explain it. But, that would seem to suggest that it was of natural causes which wouldn’t square with the rise in obesity across the world (since it was always in the natural background).
I vote for contamination of a new industrial chemical (e.g. PFAS) in water supplies.
LikeLike
Thanks, this is a cool source! A few thoughts: the average level in this sample was 4.2 μg/L and we see that most municipalities, levels were between 1-10 μg/L. In the United States, something like 45% of public-supply wells in the US exceed 10 μg/L, and 9% exceed 60 μg/L. This strongly suggests that Japanese people have much lower levels of lithium in their drinking water than Americans do. And this is entirely ignoring the fact that the majority of exposure is probably not from drinking water.
In addition, Japanese people appear to have a relatively high genetic resistance to whatever causes obesity. When Japanese people move to the US, they tend to gain a little weight, but they never become as obese as most Americans, even after multiple generations. So even if lithium were the only cause of obesity and even if Japan had the same level of lithium exposure as the US, Japanese people wouldn’t be as obese as the average American.
LikeLike
I feel like there’s a pretty major problem here in that we are talking about anorexia in macaques but handwaving away the lack of anorexia observed in human men. I think that topic requires much more discussion than simply attributing it to cosmetics use, and is currently a major hole in the broader argument…
LikeLike
The entire series seems premised on idea that 400 calorie daily increase on average is not much. It’s huge! The studies about how hard it is to rapidly gain large amounts of weight say nothing about likely effect of an extra day’s worth of calories every week year after year. Until that can be conclusively written off it still seems most obvious factor to me. But very interested in any counter to that!
LikeLike
Did you see our post on CICO specifically?
We don’t think 400 kcal/day is that much. But even if it IS, there’s the issue of causality. Drugs that make you gain weight can cause the weight gain by making you hungrier / making you eat more, so any increase in calorie consumption could just be the mechanism by which contaminants make you gain weight. Alternately the contaminants make you obese some other way, but then you have to eat more to support the activity of your body that is now heavier.
LikeLike
Thanks for these posts, been really enjoying the series. It seems like there’s no conclusive way to determine if the extra 400kcal/day is enough to cause the increase in obesity that we observe. I think a hypothesis based on chemical contaminants is fairly convincing, but how do we know for sure that it isn’t just a cultural shift? Can we thoroughly debunk the hypothesis that people have just gotten used to larger portion sizes and larger people being normal?
Thanks, and apologies if I’ve missed a section covering this.
LikeLike
It’s possible the anorexia presents differently in men. Eating disorders occur in about 8% of women. Well about 8% of men at some point abuse PEDs. Just as BMI occasionally has false positives where it flags people with excess muscle as overweight despite a healthy body fat. BMI will also miss people that have a body fat percentage that is too low if they’re carrying excess muscle.
LikeLike
I really want to thank you guys for putting this together. I am not a domain expert in this field at all. And you explained some very complicated topics clearly and consisely. And you challenged a number of the assumptions that I had unexamined regarding diet and exercise.
I enjoyed the series and I’m smarter because of it so thank you.
LikeLike
You’re welcome! Thank you for reading! 🙂
LikeLike
You guys have been mentioned here
https://mobile.twitter.com/arpitrage/status/1436484108176265235
LikeLiked by 1 person
Did you guys ever look at estrogen as a possible environmental factor?
Increasing prevalence of birth control in humans and agricultural settings. Plus there are a lot of pesticides that are estrogen-like. And it seems to be accumulating in the water supply.
https://www.sciencedaily.com/releases/2020/10/201023123100.htm
LikeLike
We did a little and found it not especially promising as a candidate (e.g. women who take hormonal birth control directly don’t become really obese) but if you think there’s something we missed we could look into it more.
LikeLike
https://mobile.twitter.com/alikjones/status/1438727094746292228
LikeLike
What about bleached pads/tampons used by women once they reach menstruation age?
LikeLike
Fascinating. I read the series in a single sitting – I couldn’t stop… and felt let down when I got to the end. I haven’t experienced that since my Masters program over a decade ago. Thank you so much! I look forward to learning more.
LikeLike
Thank you! 😀
LikeLike
Yes, fascinating. I have been chewing through these for the last couple of days, and forwarding the links as well to various ppl. I also would like to see more consideration of the connections between plastics, particularly micro plastics, and society-wide weight spectra. This is an ongoing issue with many widespread implications esp as concerns public health issues
LikeLike
Just a small comment re. the data on macaques: Why do you look at SD instead of %CV? When the mean goes up, so does the SD, even when variation doesn’t change. (Looking at the data set, the effects you describe won’t go away if you use %CV instead of SD, but significance should be way lower.) In general, I find this section less convincing than the previous ones, the data are pretty thin.
That said, I absolutely love this series and am hugely impressed by your dedication and the quality of your work!
LikeLike