
[PART I – MYSTERIES]
[PART II – CURRENT THEORIES OF OBESITY ARE INADEQUATE]
[PART III – ENVIRONMENTAL CONTAMINANTS]
[INTERLUDE A – CICO KILLER, QU’EST-CE QUE C’EST?]
[PART IV – CRITERIA]
[PART V – LIVESTOCK ANTIBIOTICS]
[INTERLUDE B – THE NUTRIENT SLUDGE DIET]
[PART VI – PFAS]
[PART VII – LITHIUM]
[INTERLUDE C – HIGHLIGHTS FROM THE REDDIT COMMENTS]
[INTERLUDE D – GLYPHOSATE (AKA THE ACTIVE INGREDIENT IN ROUNDUP)]
[INTERLUDE E – BAD SEEDS]
[PART VIII – PARADOXICAL REACTIONS]
[PART IX – ANOREXIA IN ANIMALS]
[INTERLUDE F – DEMOGRAPHICS]
[INTERLUDE G – Li+]
[INTERLUDE H – WELL WELL WELL]
It’s surprisingly hard to tell what the fattest and leanest American cities are.
We can’t find an official source — the closest we can find is this Gallup report from 2014 that lists some of the most and least obese US communities, out of 189 “Metropolitan Statistical Areas”. They offer a top 10 most obese list and a top 10 least obese list both for all US communities, and for “Major US communities”, which are communities with populations above 1 million. This isn’t perfect, but Gallup is pretty reliable, so for now let’s take it seriously.
We’ve already seen that communities in Colorado get most of their water from pure snowmelt and are exceptionally lean. It would be interesting to see if other communities on the leanest list seem to have exceptionally pure local water, and if there’s any evidence of lithium (or other contaminants) in the drinking water of the communities on the most obese list.
There are 38 communities on Gallup’s lists. We’re going to hit them all, so to keep this from spiraling out of control, we’ll focus on communities where we can find actual measurements of how much lithium is in their water. For everywhere else, we’ll give a decent overview, and let you know if we can make educated guesses, but keep the speculation to a minimum.
Because “major communities” is kind of vague and long-winded, we’ll be calling the communities on that list “cities”.
Lithium isn’t commonly recorded in water quality assessments, so for most of these communities, no direct measurements of lithium in drinking water were available — so we use other local measurements, like levels in nearby groundwater, instead. If you find actual tap water lithium measurements for any communities we missed, please let us know!
Before we start, let’s orient you to the lithium measurements we’ll be looking at:
- 2 ng/mL is low, about how much was in the water in 1964
- 10 ng/mL starts to seem like a concern, and is the EPA’s threshold for drinking water
- 40 ng/mL is the EPA’s threshold for groundwater contamination at power plants
- 100+ ng/mL is a lot, about how much the Pima were exposed to
Least Obese
Gallup offers these lists for the least obese communities in the United States:
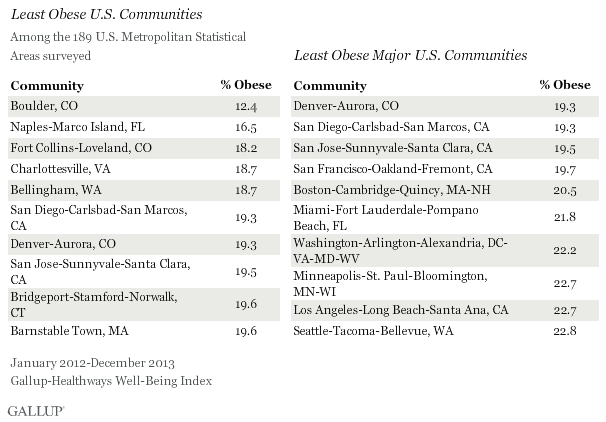
Boulder, CO – #1 Leanest Community
In our last post, we discussed how Colorado gets almost all its drinking water from snowmelt, so it’s no surprise that three of the ten leanest communities are from Colorado.
Even for Colorado, Boulder is a crazy outlier, at only 12.4% obese. Boulder is a college town, so age may be having some effect here, but nearby Fort Collins is also a college town, and their obesity rate is 18.2%. So is Boulder’s water source separate? Is it somehow crazy-extra-pure? Strangely enough, the answer on both counts may be “yes”. Boulder gets its water from a different company than Denver does, and its water generally comes from much closer by.
Naples-Marco Island, FL – #2 Leanest Community
Water in Naples “is drawn from the Lower Tamiami Aquifer via 51 wells.” We found this document suggesting that in 2008 the city of Naples was contracting analysis including lithium for the City Utilities Department. But we haven’t been able to find any actual lithium measurements either for the city or the Lower Tamiami Aquifer, and no other indications of lithium contamination in the area.
Fort Collins-Loveland, CO – #3 Leanest Community
Another Colorado town, Fort Collins’ appearance on this list is unsurprising. The water in this town comes from “the Upper Cache la Poudre River and Horsetooth Reservoir.” We can’t find any lithium measurements for these sources, but they appear to be snowmelt sources similar to other surface waters in Colorado. Their water appears to be at least partially provided by a company called Northern Water, which also provides water to Boulder.
Charlottesville, VA – #4 Leanest Community
Charlottesville gets its water from South Fork Rivanna River Reservoir and Ragged Mountain Reservoir. These collect water from the surrounding mountains, and the watershed appears to be about 70% forested. We haven’t been able to find any lithium measurements related to Charlottesville or from either of the reservoirs.
Bellingham, WA – #5 Leanest Community
The City of Bellingham gets its water from Lake Whatcom. According to this report, lithium measurements for Lake Whatcom should be available in a CSV called lakemetalstoc.csv on this page. All the other data files are indeed there, but lakemetalstoc.csv is not, and we can’t find it anywhere else. We fired up the Wayback Machine and found a version of the page from 2011, which helpfully tells us that “metals, TOC … are not posted in electronic format, but are included in the printed copies of the annual reports.” Ok then.
Denver, CO – #6 Leanest Community, #1 Leanest City
In our last post we reviewed how Denver gets its water from pure snowmelt off the Rocky Mountains, but we hadn’t tracked down any actual lithium measurements. Happily, we can now add something to that previous finding. This report from Denver Water in 2010 lists lithium as one of the “Contaminants Not Found In Denver’s Drinking Water” — “either below the reporting limit or the average result was less than the reporting limit.” Same for this report from 2016, this report from 2017, etc. etc.
San Diego-Carlsbad-San Marcos, CA – #7 Leanest Community, #2 Leanest City
In San Diego, 85-90% of city drinking water is “imported from Northern California and the Colorado River”. We haven’t been able to find any measurements of lithium in San Diego tap water, but this report from 2018 says that wastewater at the San Diego North City Water Reclamation Plant ranged from 12 ng/mL to 48 ng/mL in 2018. Similar numbers are found in this report about wastewater at the South Bay Water Reclamation Plant from 2011. In fact it looks like there are a LOT of wastewater reports, but we’ll stop there.
This doesn’t tell us how much is in San Diego drinking water exactly, but wastewater almost certainly contains no less lithium than the tap water it started as, so this suggests that the lithium concentration in San Diego drinking water is somewhere below 12-48 ng/mL.
San Jose-Sunnyvale-Santa Clara, CA – #8 Leanest Community, #3 Leanest City
For San Jose-Sunnyvale-Santa Clara, we’ve been able to find some lithium measurements for the tap water itself. This report from 2017 finds a range of “not detected” to 25 ng/mL in the water served to San Jose-Sunnyvale-Santa Clara, with a median level of 5.60 ng/mL. This is pretty low. The numbers in this report from 2018 are even lower — a range of “<5” to 6.2 ng/mL and an average of “<5”. There’s also this other report from 2018 finding a range from “not detected” to 8.1 ng/mL, with a median of 3 ng/mL.
Bridgeport-Stamford-Norwalk, CT – #9 Leanest Community
Bridgeport and surrounding towns appear to get their water from “mostly surface water drawn from a system of eight reservoirs (Aspetuck, Easton Lake, Far Mill, Hemlocks, Means Brook, Saugatuck, Trap Falls and West Pequonnock).”
We haven’t been able to find any lithium measurements for the city or for any of these reservoirs, but we do want to note that at least some of these reservoirs were in use back in 1964, and back then they all contained less than 0.50 ng/mL lithium, a truly miniscule amount. There isn’t any sign that they’ve been exposed to lithium since then (no nearby coal power plants, no petroleum mining in Connecticut at all), so lithium levels in these reservoirs may still be that low. There is a coal power plant in Bridgeport itself, but while it might be contaminating the harbor, the city isn’t drinking that water.
Barnstable Town, MA – #10 Leanest Community
Barnstable Town is a small town on Cape Cod. Like every part of Cape Cod, Barnstable relies on the Cape Cod Aquifer for its groundwater. We managed to find this report from 1988 where some hydrologists injected bromide and lithium into the Cape Cod Aquifer to test their transport in the aquifer over time. To do this they needed background readings of lithium levels so that they could track their own sample, and they found that the background concentration of lithium in the aquifer was “below the detection limit”, or something less than 10 ng/mL. Unfortunately their analysis wasn’t very sensitive so we don’t know how much less.
San Francisco-Oakland-Fremont, CA – #4 Leanest City
You may remember from above that the water in San Jose-Sunnyvale-Santa Clara contains very little lithium. This water system gets about 20% of its water from Hetch Hetchy Reservoir, a reservoir located in Yosemite National Park, and this is relevant to San Francisco because Hetch Hetchy supplies San Francisco with 85% of its drinking water.
We can’t find any lithium measurements for Hetch Hetchy itself (not even in the 1964 data!), but Hetch Hetchy water largely comes from snowmelt, and if it’s providing San Jose-Sunnyvale-Santa Clara with 20% of its drinking water, Hetch Hetchy can’t be holding much lithium. For this reason, we suspect that the lithium levels in San Francisco drinking water are probably low as well.
Boston-Cambridge-Quincy, MA – #5 Leanest City
Boston and most of the surrounding towns get their water from the Quabbin Reservoir in western Massachusetts. Again we can’t find any modern measurements, but Boston was drawing from the Quabbin in 1964, and in the 1964 data we see that water sourced from the Quabbin contained only 0.21 ng/mL lithium. Massachusetts hasn’t drilled any new oil wells right next to the Quabbin or anything in the past 60 years, so while we’d love to see some modern tests to confirm this, there’s no reason to expect lithium levels in the Quabbin to be much higher today.
Miami-Fort Lauderdale-Pompano Beach, FL – #6 Leanest City
In Miami, “water supply comes from the Biscayne Aquifer, the County’s primary drinking water source.” In the USGS well water dataset, there are 53 measurements from the Biscayne Aquifer, all from either 2010 or 2016. The average level of lithium in these samples is 1.26 ng/mL, the median is 1.11 ng/mL, the maximum level is a mere 2.60 ng/mL, and in a full 24 of these 53 samples, the levels of lithium were below the detectable threshold.
This aquifer is such an exceptional case, they mention it by name in the abstract: “no public supply wells in the Biscayne aquifer (southern Florida) exceeded either threshold, and the highest concentration in that aquifer was 2.6 [ng/mL].”
Washington-Arlington-Alexandria, DC-VA-MD-WV – #7 Leanest City
Water for DC comes from the Potomac River. DC Water provides detailed water quality reports online, all the way up through 2021, and in the report for 2021, the average level of lithium in DC water was 2 ng/mL and the range was 1 to 2 ng/mL. Now, the Gallup numbers are from 2014 — well, in the report from 2014, the average level of lithium in DC water was 2.1 ng/mL and the range was 1.2 to 4.0 ng/mL. Case closed.
Minneapolis-St. Paul-Bloomington, MN-WI – #8 Leanest City
Minneapolis and St. Paul both draw much of their water from the Mississippi River. This may not seem like a good idea, but they’re so close to the headwaters that the Mississippi hasn’t really had a chance to pick up all that much stuff on its way to the ocean. Unfortunately we haven’t been able to find any lithium measurements from either city.
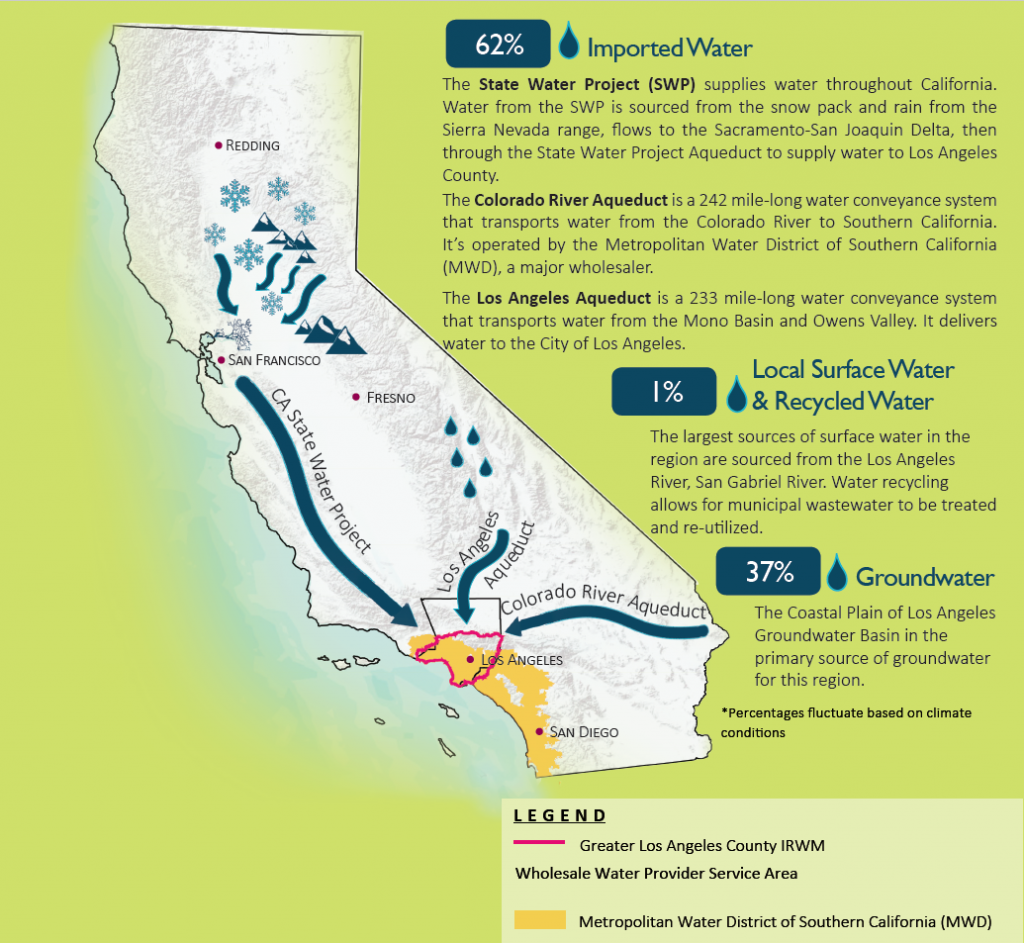
Los Angeles-Long Beach-Santa Ana, CA – #9 Leanest City
Drinking water in LA comes from a couple different sources — the Owens River, Northern California and the Colorado River, and groundwater. Again we haven’t been able to find actual measurements, but we can note that much of this water is piped hundreds of miles from distant mountain ranges (see figure below).
We also found this news report from 2015 about “a massive natural gas leak at Aliso Canyon” that appears to have contaminated tap water in the Los Angeles water system. This includes a picture of lithium measurements from what appears to be a powerpoint slide deck, indicating average lithium levels in LA drinking water of 65.4 ng/mL. This is pretty high, but of course the gas leak occurred in 2015 and the Gallup obesity numbers are from 2014.
The article also includes a statement from a Los Angeles Department of Water and Power spokesperson saying that “the agency doesn’t test for lithium and is not required to.” This suggests that there are probably no official lithium records to be found for the city, so it’s no surprise we weren’t able to find anything.
Seattle-Tacoma-Bellevue, WA – #10 Leanest City
Seattle gets most of its drinking water from two large watersheds in “mountain forests” to the east. The only lithium coming out of Seattle is a Nirvana byproduct. Ok but seriously, we couldn’t find anything.
Most Obese
Next, let’s look at the most obese communities.
Gallup sez:
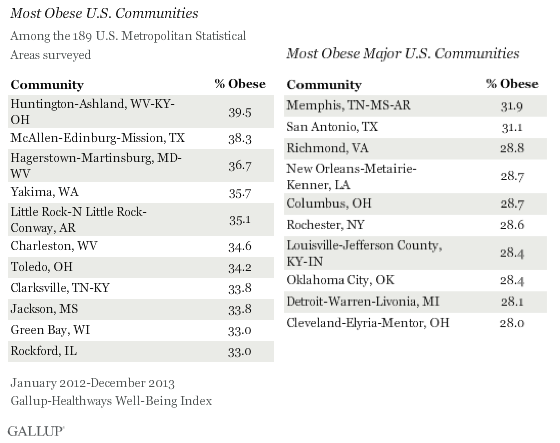
Huntington-Ashland, WV-KY-OH – #1 Most Obese Community
Let’s start at the top. Huntington-Ashland WV-KY-OH is the #1 most obese community on Gallup’s list and appears to get all of its drinking water from the Ohio River. We can’t find any measurements for lithium in the actual river water, but we found this report outlining several nearby power plants that show coal-ash contamination in groundwater.
Coal-ash contamination is relevant because fossil fuels and their byproducts are often extremely rich sources of lithium. This includes coal ash as well as oilfield brines and other “produced water” from petroleum extraction.
The first power plant we’ll look at is the Mountaineer Plant in New Haven, WV, which is about 70 miles directly upstream of Huntington-Ashland and was found to be contaminated with lithium in 2019. These reports are a little tricky to read, but if you flip through the plant’s own groundwater monitoring reports, it looks like the levels in the plant’s groundwater monitoring wells often exceeded 40 ng/mL and sometimes exceeded 100 ng/mL.
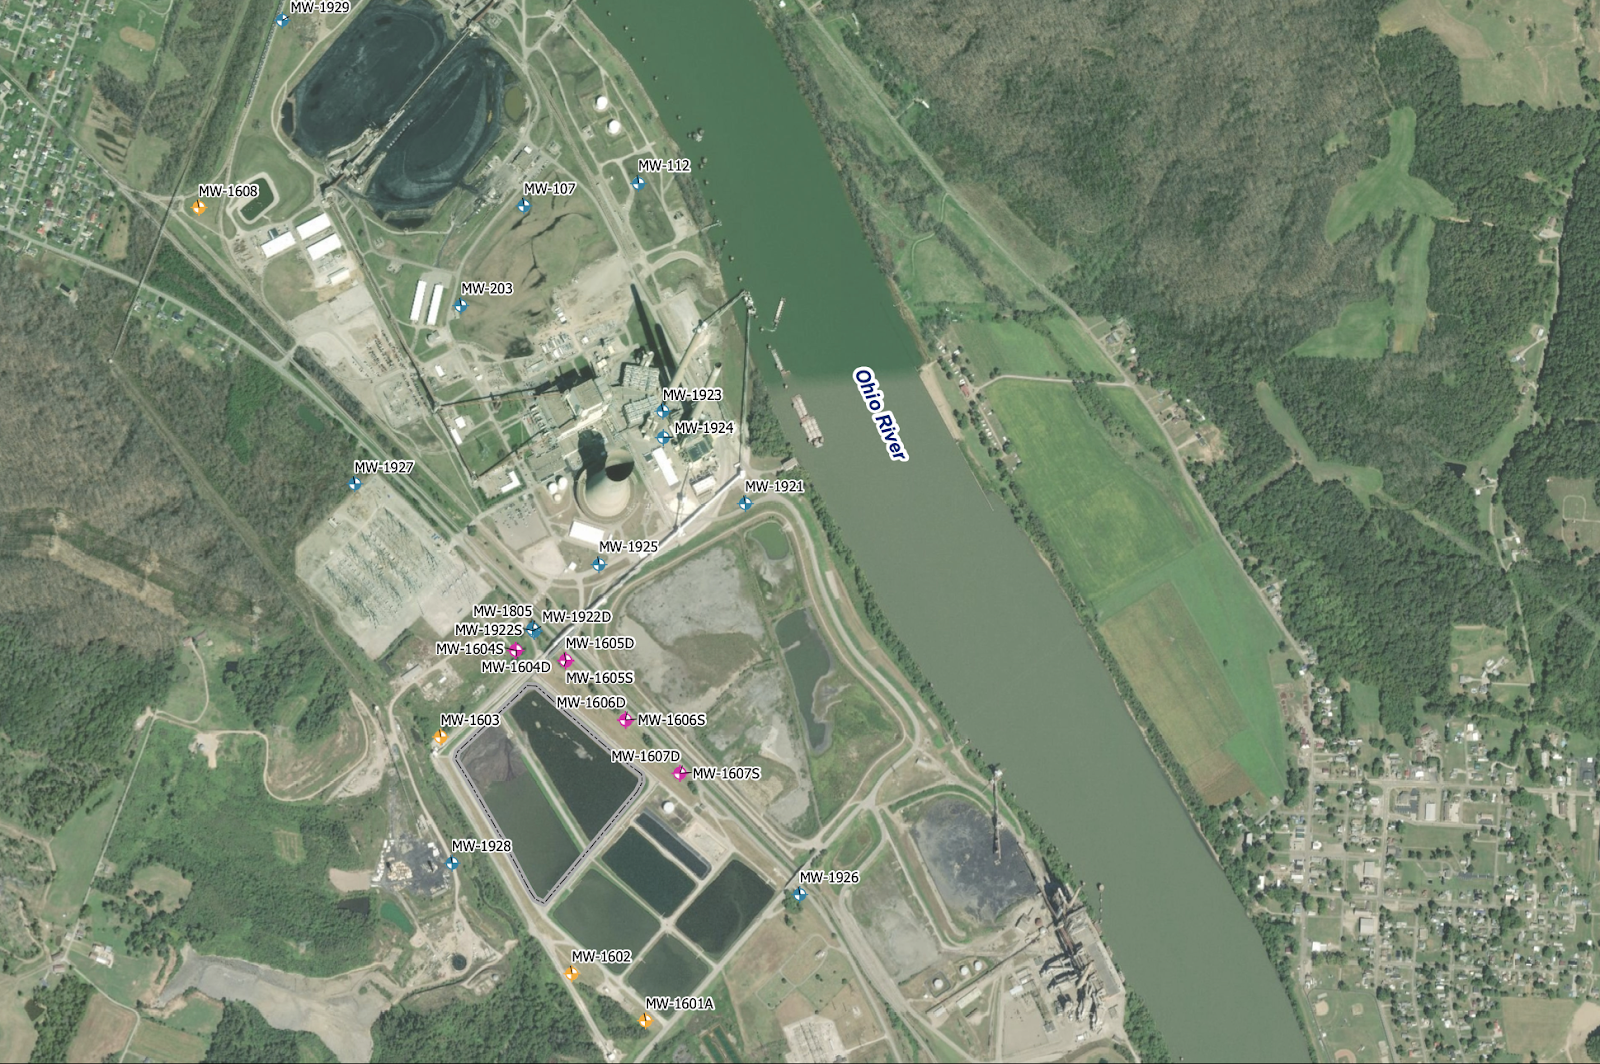
Just a few miles downstream on the Ohio River sits the Gavin Power Plant. This plant is split up into three sections on the groundwater testing reports. There isn’t much lithium in the Bottom Ash Pond, but in the Residual Waste Landfill, several wells are heavily contaminated, and the highest level recorded was 249 ng/mL. In the Fly Ash Reservoir, many testing wells contain more than 100 ng/mL lithium, the highest level detected being 702 ng/mL.
Just 1.6 more miles down the Ohio River, in the direction of Huntington-Ashland, sits Kyger Creek Station. Many of the groundwater monitoring wells at this plant also show high concentrations of lithium, including levels as high as 480 ng/mL.
How many other places in America are right downstream from three coal power plants? This seems too crazy to be a coincidence. If lithium causes obesity, then it’s no wonder that Huntington-Ashland is #1 in the nation.
McAllen-Edinburg-Mission, TX – #2 Most Obese Community
McAllen, Texas gets its water from the Rio Grande. This one is almost too easy — the USGS well water report says, “the highest concentrations [of lithium] were in the High Plains, Rio Grande, Stream-valley aquifers and Basin and Range basin fill aquifers of the West.”
We have access to the raw data, and we can confirm that the Rio Grande aquifer had the second-highest levels of lithium of all the principal aquifers in the dataset. In Texas, there were only 9 measurements from this aquifer, but the level of lithium was pretty high in all of them — the median was 59.7 ng/mL, the mean 64.83 ng/mL, and the range was 20.8 ng/mL to 115.0 ng/mL.
Hagerstown-Martinsburg, MD-WV – #3 Most Obese Community
Hagerstown-Martinsburg MD-WV is interesting because Hagerstown is in Washington County, MD. By coincidence, one of the few good sources we have for levels of lithium in the 1970s is a 1976 paper looking at 384 drinking water samples from Washington County. Back in 1976 they found very low levels of lithium in the well water in Washington County, with 90% of samples containing less than 10 ng/mL and the highest level being only 32 ng/mL.
Unfortunately we can’t find good modern data for lithium levels in Hagerstown or Washington County as a whole. As far as we can tell from their water quality reports, Washington County doesn’t test for lithium at all. Numbers from the state as a whole do seem to have increased since 1976, but the state’s trends don’t tell us all that much about this one town.
We can also mention that Martinsburg, the other half of Hagerstown-Martinsburg MD-WV, is notable for being exceptionally contaminated with PFAS, even for West Virginia. According to this source it looks like the USGS is planning to test West Virginia for lithium too, keep an eye on this one!
Yakima, WA – #4 Most Obese Community
Most of Yakima’s drinking water comes from the Naches River, though this is supplemented by 4 wells that draw from the Ellensburg Aquifer. This USGS report from 2013 suggests that well water in the area is pretty low in lithium, but most of their water doesn’t come from the wells. Unfortunately we haven’t been able to find any measurements at all for tap water in Yakima or for the Naches River in general. There is this 1987 USGS report that includes measurements of lithium in Yakima River Basin streambed sediment, if anyone wants to try to make sense of that.
There’s also a possible mining connection — the Bumping Lake Mineral Spring Calcium Mine is upstream of Yakima and has lithium listed as one commodity of interest. Even so, it’s not clear whether this is relevant.
Little Rock-N Little Rock-Conway, AR – #5 Most Obese Community
Drinking water in Little Rock comes from two surface water sources, Lake Winona and Lake Maumelle, which supply Jackson Reservoir. Drinking water in Conway comes from nearby Brewer Lake. Unfortunately we have not been able to find any lithium measurements from any of these bodies of water.
Now, Arkansas does sit on a huge amount of lithium in the form of the Smackover Formation, which is being mined by Standard Lithium Ltd., but this is all in southern Arkansas and should be downstream from the Little Rock area, so unless something weird is happening (which is possible) that shouldn’t be reaching Little Rock.
That said, there are plenty of petroleum jobs in Little Rock. Maybe it’s just more plain old oil-field brine spills — like this spill from 2015, when a pipeline under the Arkansas River near Little Rock ruptured, spilled 4 million cubic feet of natural gas, and blew up a tugboat.
Charleston, WV – #6 Most Obese Community
Charleston is the capital of West Virginia and the state’s most populous city. The city sits at the intersection of the Kanawha and Elk rivers. The city’s water supply appears to come primarily from the Elk River. We can’t find any lithium measurements either in Charleston tap water, or in the water from either river.
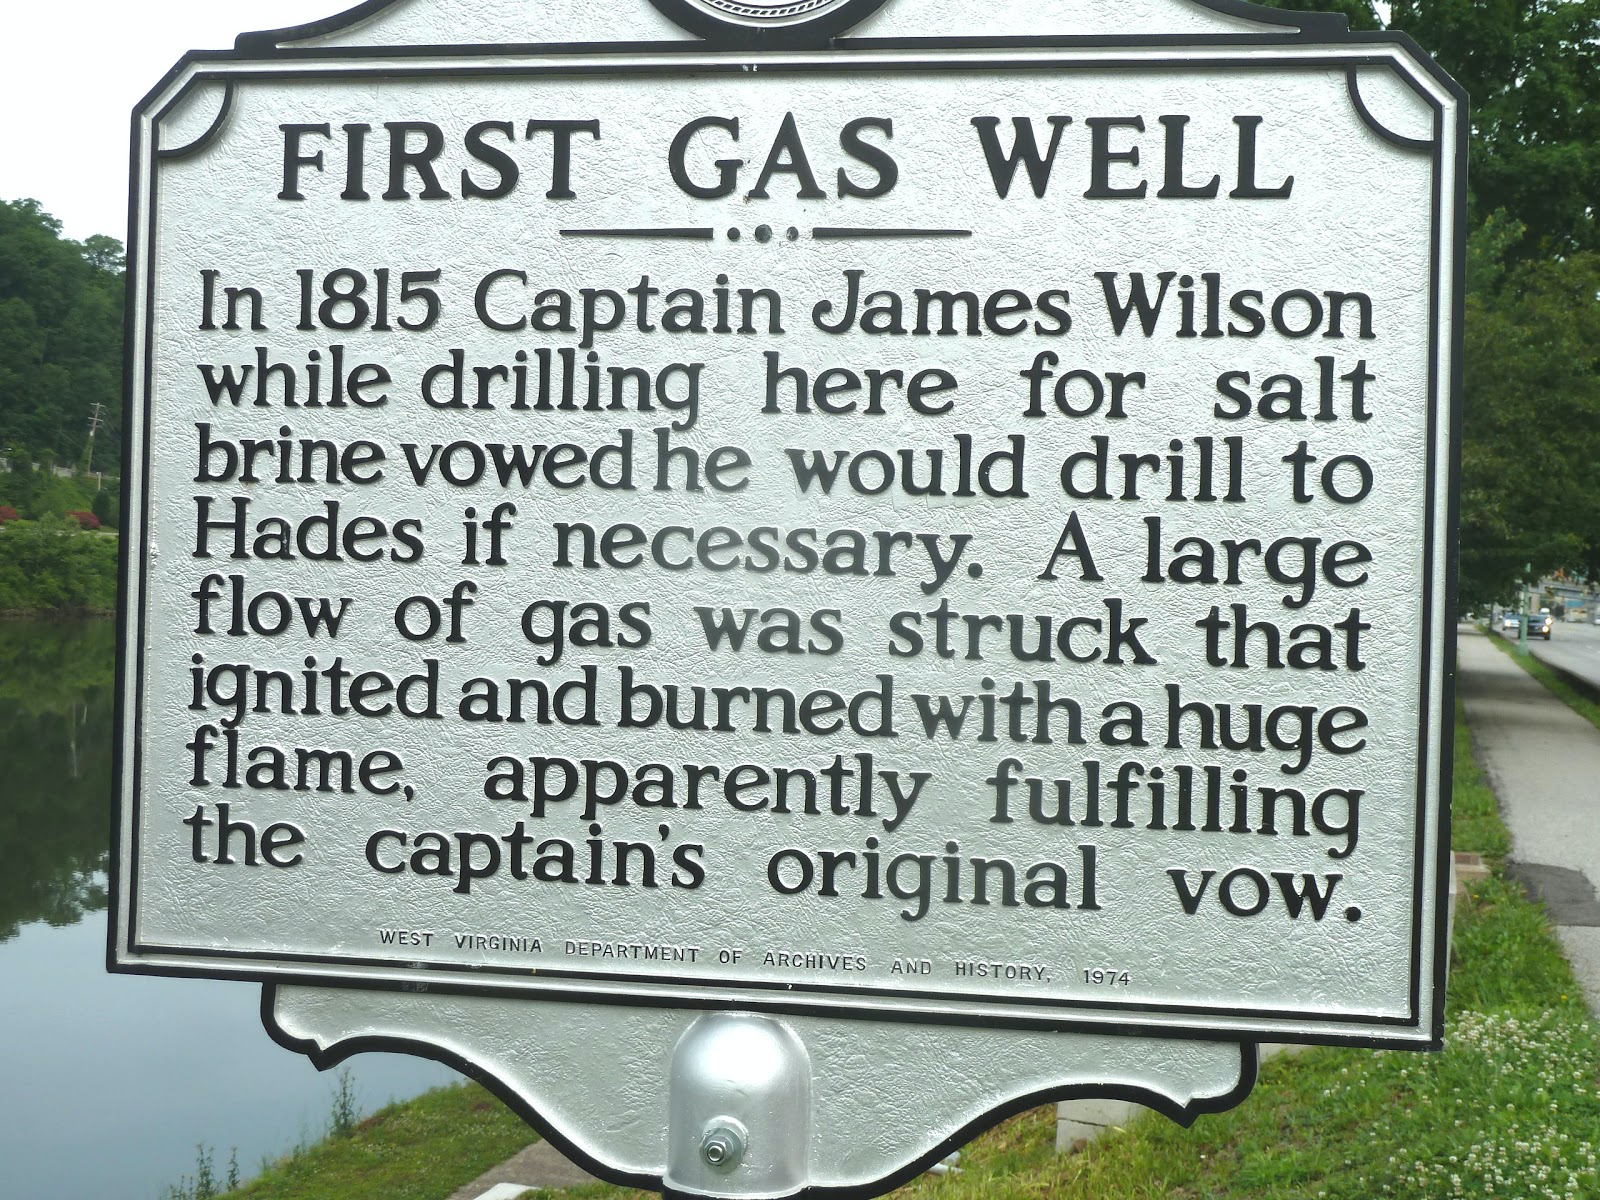
Even so, there are good reasons to suspect lithium contamination in the area. West Virginia has a long history of Coal and Natural Gas production, and Charleston is no exception. In fact, the first natural gas well in the United States was drilled in Charleston in 1815 by Captain James Wilson. Most of the official histories (including naturalgas.org) say that the first natural gas well in the United States was drilled in 1821 by William Hart in Fredonia, New York, but what they mean is that the first intentional natural gas well in the United States was drilled in 1821 by William Hart in Fredonia, New York. This is true, because when Captain James Wilson hit natural gas in Charleston in 1815, he wasn’t drilling for gas — he was drilling for salt brine.
This is because the Kanawha River has an even longer history with salt brines than it does with natural gas. It was such a big deal that the little community upstream of Charleston now known as Malden, WV, was originally known as Kanawha Salines! In some ways this shouldn’t be a surprise, since we already know that fossil fuels and salt brines tend to pop up in the same areas.
This is a concerning potential source of lithium contamination, but can we confirm this with any measurements? We can’t find any modern measurements, but this 1906 report includes an analysis of a sample of brine from Malden taken in 1905 and finds a level of lithium chloride of 0.101 “parts in 1,000 parts by weight.” Parts-per notation can be a little ambiguous, but this probably works out to around 101,000 ng/mL lithium in the brine. In any case, it was more lithium than was found in the brines in other parts of West Virginia — about 3x that found in Webster Springs and about 10x that found in Hartford City.
Toledo, OH – #7 Most Obese Community
When you Google “toledo ohio lithium”, one of the first links you see is this:

This leads to a news story about a chemical fire at the Lithium Innovations plant in central Toledo, Ohio. “The fire is releasing lithium gas, a potentially toxic fume, into the air,” reports WTOL11 News. “The gas could make the air difficult to breathe.” There’s even a police drone video of the fire on Youtube.
The fire was in 2017, so while it probably wasn’t good for the health of the community, it couldn’t have impacted Gallup’s obesity numbers, which are from 2014. But the Lithium Innovations plant came to Toledo in 2009, so it had a couple of years to expose people to the metal. The news report we quoted above also casually mentions, “during a 2010 inspection, fire inspectors found large quantities of lithium.”
We can’t find any direct measurements of lithium in Toledo’s drinking water, but this does look pretty bad.
Clarksville, TN-KY – #8 Most Obese Community
Water in Clarksville comes from the Cumberland River. Clarksville, and the Cumberland, are practically surrounded by fossil fuel plants. About 20 miles downstream, sitting right on the river, is the Cumberland Fossil Plant. Groundwater testing wells at this plant seem to have pretty high levels of lithium — in 2018, the highest level was 79 ng/mL.
About 80 miles upstream is a different plant, the Gallatin Fossil Plant, which also sits right on the Cumberland River. In fact it sticks way out in a bend in the river, so it’s surrounded by the Cumberland River on three sides. Several of the groundwater testing wells show an average of more than 60 ng/mL lithium, and the well with the highest level of contamination, right on the river’s edge, has a mean concentration of 1,660 ng/mL and a maximum of 2,300 ng/mL. This is further away, but the level of lithium contamination is almost 30x higher, and it is upstream.
Jackson, MS – #9 Most Obese Community
Water in Jackson comes from a couple different sources — the Pearl River, the Ross Barnett Reservoir, and six groundwater wells. Unfortunately we can’t find any lithium measurements for any of these sources.
Like some other places on this list, Jackson has a long history of natural gas mining within the city limits, which gives us this great line from Wikipedia: “failure did not stop Ella Render from obtaining a lease from the state’s insane asylum to begin a well on its grounds in 1924”.
They also tried to mine oil in Jackson, but it didn’t work out. Wikipedia gives us this other very interesting line about why: “The barrels of oil had considerable amounts of salt water, which lessened the quality.” Now is a good time to mention that Jackson sits right on the Smackover Formation, which is notorious for the high level of lithium in its brines. We can’t find any measurements for the levels of lithium in these brines around Jackson specifically, but this report does mention “lithium-rich produced water from Norphlet and Smackover completions in east central Mississippi” in the abstract.
There are also some weird records suggesting that people have been drilling for CO2 deposits from the Norphlet formation right on the banks for the Ross Barnett Reservoir, but these reports are much more vague than we would like.
We also found this report about oilfield brines contaminating groundwater and streams in Lamar and Marion Counties, Mississippi, and this other report about oilfield brines contaminating groundwater in Lincoln County, Mississippi. Neither of these are near Jackson but it does make you wonder. So no smoking gun, but it seems suggestive.
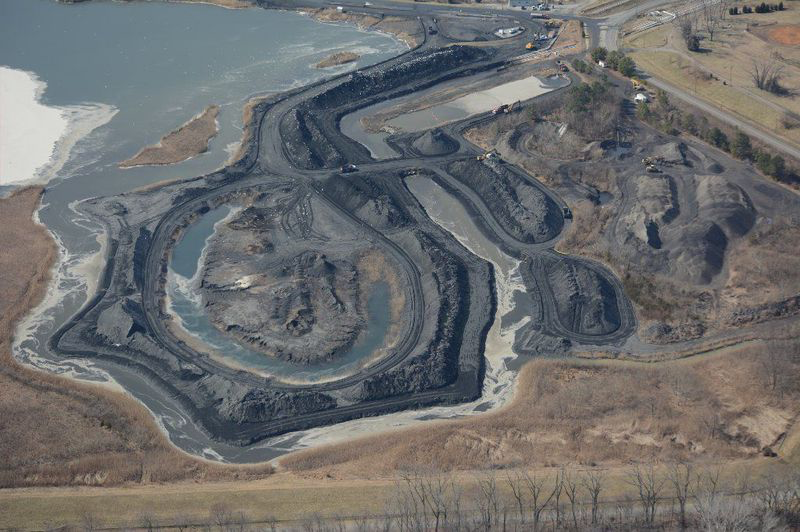
Green Bay, WI – #10 (tied) Most Obese Community
Lake Michigan is Green Bay’s “main source” of water. Green Bay also has a lot of coal stuff going on. They used to have two coal power plants, both right on the water. Green Bay West Mill (sometimes called Green Bay Broadway?) burned coal for more than 100 years, but as of 2020 they are switching over entirely to natural gas. There was also Pulliam Plant or JP Pulliam Generating Station, a coal and natural gas power plant which operated from 1927 to 2018. Unusually, we can’t find any groundwater monitoring data for either of these plants.
But these are not the end of Green Bay’s coal-based attractions. Arguably more interesting are the coal piles stored by C. Reiss Coal Co. right on beautiful riverfront property, right in the middle of town, and a 10-minute walk from the local elementary school.
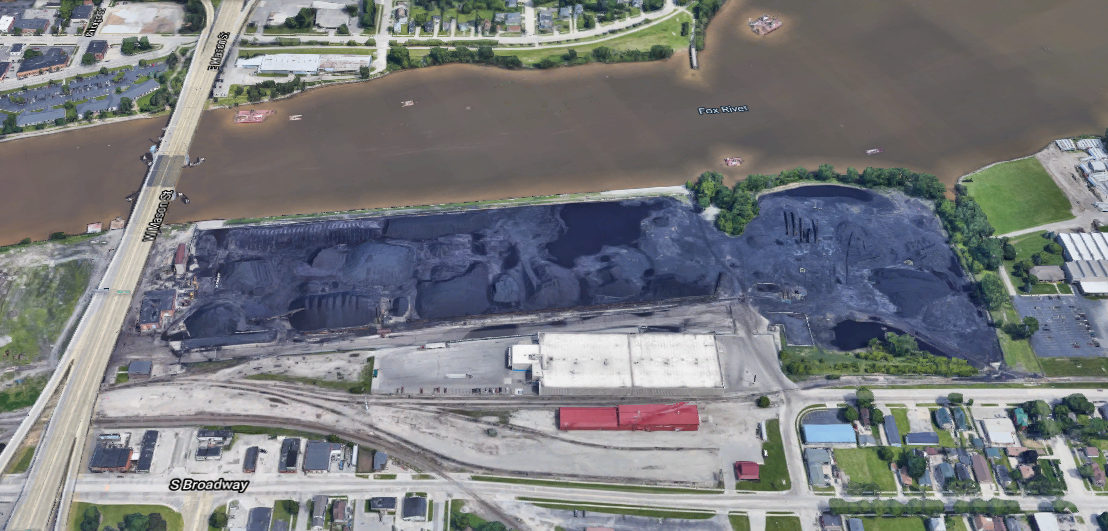
The locals have an interesting relationship with these coal piles. The announcement that the city might be able to move the piles was:
…embraced by residents of the Astor Neighborhood, across the Fox River from the coal piles, whose properties can be covered by a thin film of coal dust when the wind blows out of the west.
Resident Cheryl Renier-Wigg said the coal dust was “an unpleasant surprise” when she moved into the neighborhood in 1990.
“It’s that you don’t realize you’ve got this coal dust lingering in the air until you clean your windows or your outside tables and chairs,” Renier-Wigg said. “You wipe it down and it’s black. Plastic things get pitted to the point you can’t clean them anymore.”
So these are not lithium measurements, but the coal plants and coal dust blowing all over town are certainly the sorts of things that might be getting lithium into the local environment.
Rockford, IL – #10 (tied) Most Obese Community
According to the official report from 2020, “the source of drinking water used by ROCKFORD is Ground Water.”
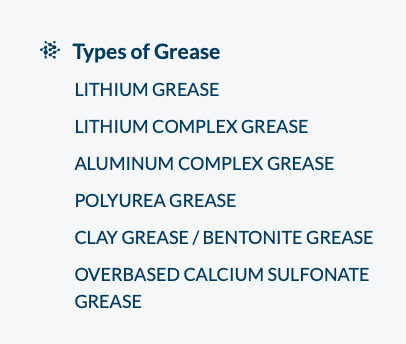
Rockford is located on the Rock River. Just upstream of Rockford on the Rock River is Rockton. A company named Chemtool built a new manufacturing facility in Rockton in 2008. What does Chemtool make, you ask?
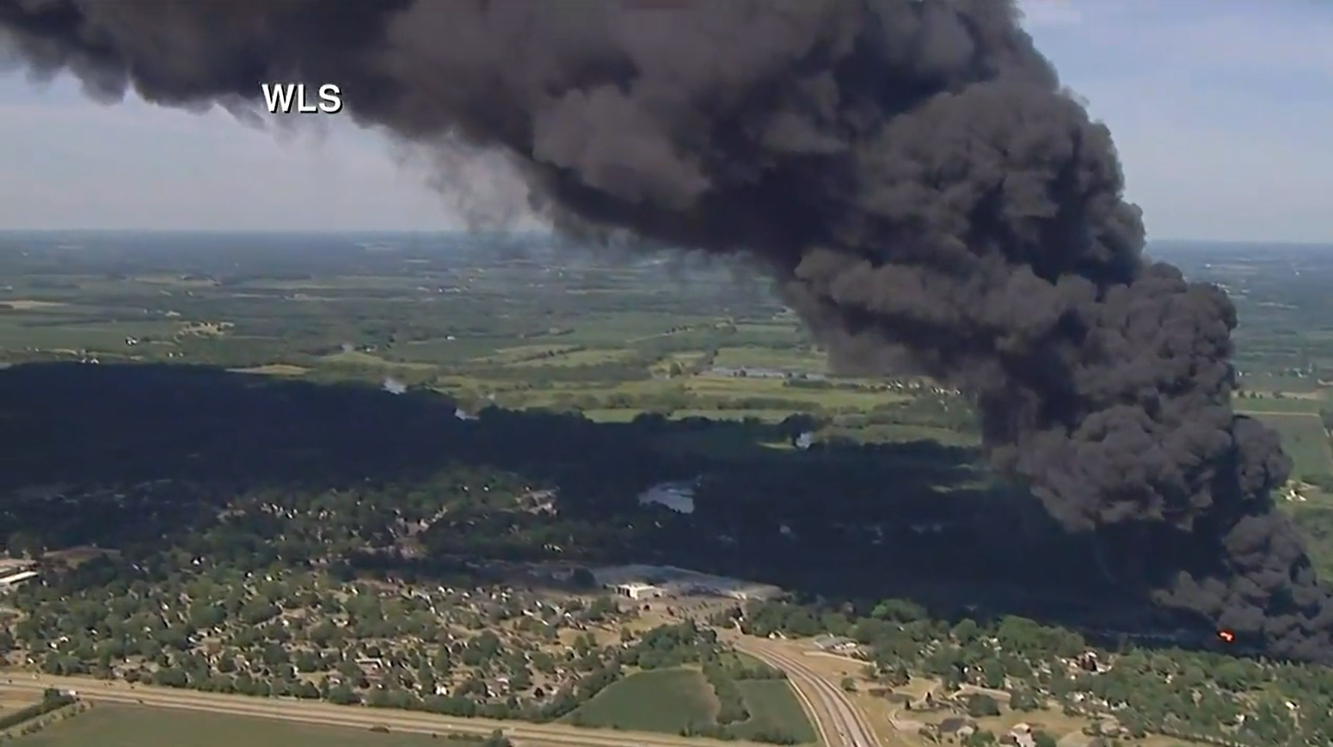
The plant grew and soon employed dozens of people. Everything was going well until June 14th, 2021, when the plant exploded.
Memphis, TN-MS-AR – #1 Most Obese City
We found this 2021 story from the Memphis Flyer about the Allen Fossil Plant, which is located adjacent to Memphis on the Mississippi River. The plant ran from 1959 to 2018 — according to the Flyer, it consumed 7,200 tons of coal per day, producing about 85,000 tons of ash every year. The plant is now closed but the ash remains, in “two massive ponds at the old coal-plant site.”
The TVA report from 2019 finds lithium in the monitoring wells at the plant — only one is above the safety threshold of 40 ng/mL, but it’s at concentrations above 20 ng/mL in other wells. There’s also something weird going on here, where many of the measurements are marked as “the result is estimated”, and there are a few much higher values (up to 125 ng/mL) that are marked as “the analyte was not detected above the indicated reporting limit.” It’s also notable that they report background levels, for theoretically uncontaminated groundwater, of up to 34 ng/mL. This isn’t a huge concentration — but it is very high compared to the levels found around Memphis in 1964, which ranged from 0.51 to 3.80 ng/mL.
Because coal power plants often use inadequate testing mechanisms, the true level of lithium around plants may be higher than reported. For example, in some cases power plants use methods with a reporting limit of 200 ng/mL, which makes any levels below this threshold appear on reports as “not detected”.
San Antono, TX – #2 Most Obese City
The San Antonio Water System “draws water from the Edwards Aquifer to service its customers in all 8 counties of the Greater San Antonio metropolitan area.” This is kind of complicated because the Edwards Aquifer is divided into different zones, and San Antonio sits right on the line between the freshwater and saline water zones, or “bad water line”. The saline water zone definitely contains a ton of lithium, up to 290,000 ng/mL.
Some of this also appears to end up in the freshwater zone, and in drinking water. This USGS report from 1987 looked at four “subareas” of the Edwards Aquifer and found 12.9, 13.0, 16.0, and 100.0 ng/mL lithium in each. This other USGS report from 1987 found 22 ng/mL lithium in a well in the freshwater zone. There’s also this 2014 report on the Edwards Aquifer from the Edwards Aquifer Authority, which is confusing and vague, but suggests that about 33 samples from the freshwater zone contained 50 ng/mL or more of lithium. We can also just look at the USGS well water data again, because they pick out the “Edwards-Trinity aquifer system” specifically. In these 100 observations from 2008-2018, the median level of lithium is 6.03 ng/mL, the mean is 20.74 ng/mL, and the maximum is 188.00 ng/mL.
And all of these measurements are much higher than historical values — in 1964, four wells in San Antonio were tested and found to contain only 1.5 ng/mL lithium.
Richmond, VA – #3 Most Obese City
Richmond gets its water from the James River and has since 1924.
Chesterfield Power Station sits on the James River downstream. In 2020, several monitoring wells at this site were found to contain more than 100 ng/mL lithium, the highest concentration being 265 ng/mL.
Bremo Power Station sits on the James River upstream. It was originally commissioned in 1931 and burned coal until 2013, when it converted to natural gas. In 2020, two monitoring wells were found to contain high levels of lithium — 121 ng/mL in one and 330 ng/mL in the other. Coincidentally, these seem to be the two wells closest to the James River, just a couple hundred feet from the banks. There are four monitoring locations in the river, and at the time of testing none of them registered high levels of lithium — but the reporting just says “<7.3” ng/mL for all four of them, suggesting they are not very sensitive.
New Orleans-Metairie-Kenner, LA – #4 Most Obese City
New Orleans gets its water from the Mississippi River. In the 100 cities paper from 1964, they report 4.3 ng/mL lithium in the Mississippi River near New Orleans. A similar amount was found in 1979, with this paper reporting 3.8 ng/mL lithium in New Orleans drinking water. By 1984, this paper reports about 15 ng/mL lithium in the Mississippi River near New Orleans.
Unfortunately this is where the trail goes cold. We can’t find any more modern sources for lithium in either New Orleans drinking water or in the lowest stretches of the Mississippi River (if you are a chemist in the area, would you mind going down to the river for us? or just turn on your tap).
Columbus, OH – #5 Most Obese City
Columbus gets its drinking water from — well, it’s complicated. Four wells in Franklin County provide about 15% of the city’s water supply. The other 85% comes from the Griggs and O’Shaugnessy Reservoirs, fed by the Scioto River, and the Hoover Reservoir, fed by Big Walnut Creek.
The only lithium measurements we were able to find come from this USGS report from 1991, where they found lithium levels in the Scioto River between 10 ng/mL and 45 ng/mL. This is south of the city, however, so these are the levels after it has passed through the city. Even so, it’s interesting that the levels were all above 10 ng/mL even back in 1991.
North of Columbus in Morrow County, there are a bunch of Class II injection wells, which are used to send oil brines BACK TO HELL back deep beneath the earth. This seems concerning for Columbus because Morrow county is the headwaters of Big Walnut Creek, and some of these injection wells appear to sit right alongside some of the area’s many streams.
The local injection authorities make all the usual claims about how these brines never get into creeks or public water supplies, but there have been spills — like this one in 2016, where a train plowed into a brine truck, spilling 3,200 gallons of brine. See also this senior thesis from 1974 documenting oil-field brines in Morrow County — it begins, “Since the discovery of oil in Morrow County, Ohio in 1961 the area’s ground and surface water has become grossly contaminated by oil-field brines.” And also this paper by Wayne Pettyjohn from 1971 which mentions extensive brine contamination, with several contamination events in Morrow County specifically.
Most of these reports don’t include any actual lithium measurements, but the Supporting Information for this paper does, and they find that oilfield brines in eastern Ohio contain between 202 ng/mL and 108,000 ng/mL lithium.
Oh, and they spread it on the roads as a de-icer, even though it’s definitely radioactive.
Rochester, NY – #6 Most Obese City
Rochester draws its drinking water from nearby lakes. Back in 1964, the local lithium levels were around 1.2 ng/mL. This report finds no lithium at all in Hemlock Lake between 1975 and 1977.
Today things seem like they are different. We found this USGS report on groundwater quality in western New York from 2006, which reports lithium concentrations in the local aquifers as high as 917 ng/mL. Thankfully the sites with levels this high don’t appear to be close to any population centers, but the two wells closest to Rochester contain 64.2 ng/mL and 78.9 ng/mL lithium.
We can’t find any actual measurements for either lake or for the local drinking water. The city’s annual water quality reports give a clear list of all the contaminants they test for and lithium isn’t on the list, so there probably aren’t any records out there for us to find.
Louisville-Jefferson County, KY-IN – #7 Most Obese City
Louisville appears to get most or all of its drinking water from the Ohio River. Like other cities we’ve looked at along the Ohio River, Louisville is downstream from a coal power plant with a lithium problem.
The Ghent Generating Station is about 70 miles upstream from Louisville. This news article from 2021 describes coal ash being moved to ash ponds near the Ohio River, and mentions that “groundwater monitoring wells at the Ghent power plant had lithium levels up to 154 times the amount considered safe … one of the highest lithium levels documented at 265 coal power plant sites.” We also found this news article from 2019 about how “Louisville Gas and Electric power plants are illegally contaminating groundwater flowing into the Ohio River”, which mentions lithium specifically. We tracked down some actual measurements, and found that levels of lithium found in the groundwater at this plant can be as high as 6,167 ng/mL.
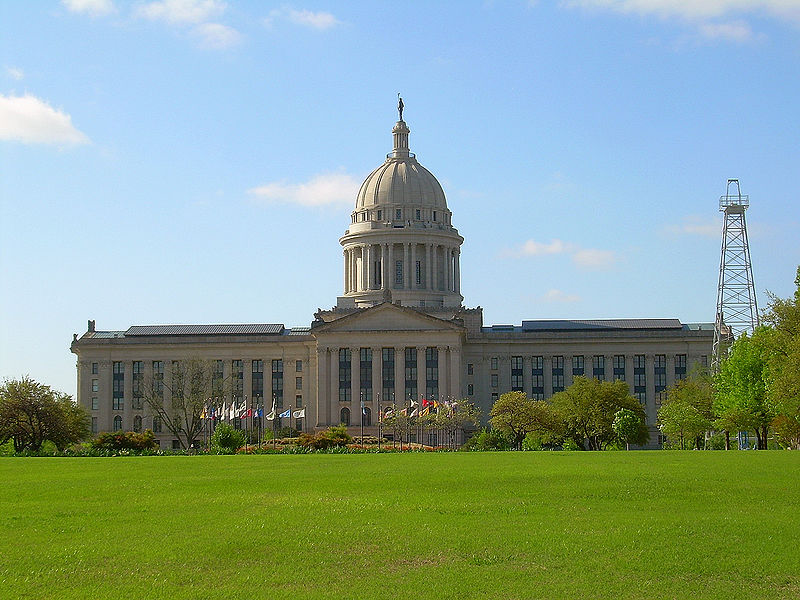
Oklahoma City, OK – #8 Most Obese City
The Oklahoma State Capitol has the interesting distinction of being the only state capitol grounds in the United States with active oil rigs. This is because Oklahoma City, Oklahoma sits on top of the Oklahoma City Oil Field. This produces a lot of oil and a lot of brine.
At this point the contamination should not be a surprise. Here’s a USGS report from 1998 on water quality in the confusingly-named Canadian County, Oklahoma, which is just one county over from Oklahoma City. They report one measurement from a test well in the area, which showed a concentration of 32 ng/mL of lithium.
We can’t find any more recent measurements in drinking water, or for the brine itself, but as always there are the news reports of oil and gas wastewater wells overlapping with drinking water wells, and news reports of oil-field brines polluting the water supply “to such a degree that no trees or flowers will grow.”
Detroit-Warren-Livonia, MI – #9 Most Obese City
It probably won’t take any special convincing to get you to believe that the drinking water in Detroit might be contaminated. Unfortunately Detroit is another one of those cities that just doesn’t seem to test for lithium, but it’s still looking pretty bad.
To begin with, at the Trenton Channel Power Plant on the Detroit River, all eight groundwater testing wells are heavily contaminated. Six out of eight had an average level of lithium above 40 ng/mL, and the highest level on record is 370 ng/mL.
And at the end of the day, the city is just generally polluted. Take for example the Samuel B. Jolly Site at 3445 West Warren Avenue, Detroit. This used to be a gas service station, but is currently a vacant lot. The service station structures have been removed, but three 8,000-gallon gasoline storage tanks, “temporarily out of use”, remain underground. The report calls this a leaking underground storage tank (“LUST”; no, really) site, and documents the petroleum contamination. The units are a little unfamiliar because they’re for soil rather than water, but suffice to say, of the 14 samples, 10 contained more lithium than the statewide background levels, and the highest measurement was almost 30x higher than background levels.
Cleveland-Elyria-Mentor, OH – #10 Most Obese City
Cleveland drinking water comes from Lake Erie. Cleveland doesn’t seem to test for lithium, and we can’t find any modern measurements for the lake, though we’ll note that Cleveland is downstream of Detroit.
Without any measurements, the best we can do is note that the water around Cleveland has a history of being really, really polluted. Cleveland sits where the Cuyahoga River empties into Lake Erie, a river so polluted that it has caught fire at least 13 times. Most of these were in 1969 or before, but another one came around in 2020, when an oil tanker truck crashed and leaked flaming gas into the river.
The timeline seems a little off for this, since the river was more polluted in the past than it is now. But a lot of these pollutants have stuck around in one way or another, leading to headlines like, “Cleveland’s water supply at risk as toxic blob creeps across Lake Erie, Ohio EPA says”.
But we can also just note that Cleveland was only 28.0% obese in 2014, which seems to be sightly less than the rate for Ohio overall in that year. We may have simply reached the point on the list where the cities are catching up to background levels.
In Conclusion
Looking at the leanest list, we were able to find explicit measurements of the lithium levels in the drinking water of five communities. In Denver’s drinking water, lithium is consistently tested for but not detected. In San Jose, the median level of lithium in the water was around 3-5 ng/mL, and the maximum observed was only 25 ng/mL, which seems to be an outlier. In Barnstable Town, the aquifer they draw their water from appears to contain less than 10 ng/mL lithium, though the analysis we found wasn’t sensitive enough to say how much less. Miami’s aquifer contains a median of 1.11 ng/mL, and the maximum level observed was only 2.6 ng/mL. Finally, in DC we found an average of 2 ng/mL and a range of only 1-4 ng/mL in drinking water.
There were also six communities where we weren’t able to find measurements of lithium in drinking water from modern sources, but were able to find evidence that suggests that the lithium levels are probably quite low. In most cases this is suggested by the fact that the community gets its drinking water from a pristine source, like remote mountain snowmelt, and in some cases we were able to support this with historical measurements. If a source wasn’t contaminated in 1964, and nothing has happened to change that, then the source probably still isn’t contaminated now.
Finally, in six of the communities on the leanest list, we weren’t able to find any indication of how much lithium is in their drinking water.
Looking at the most obese list, we were able to find good measurements of the lithium levels in the drinking water of two communities. In McAllen, the median level we found was 59.7 ng/mL, with a range from 20.8-115.0 ng/mL. In San Antonio, the most recent analysis found a median level of lithium of 6.03 ng/mL, a mean of 20.74 ng/mL, and a maximum of 188.00 ng/mL.
In twelve communities, we found evidence of groundwater and/or drinking water source contamination from fossil fuel sources — usually coal plants nearby or upriver, but also natural gas wells, injection wells, other coal sources, etc. In nine of these communities, we found direct measurements of the contamination, with levels of lithium levels in groundwater often smashing the reporting limit of 40 ng/mL, the highest being 6,167 ng/mL. In the other three, we found evidence of nearby coal plants or other major petroleum contamination, but couldn’t find direct measurements of lithium levels.
We also found five communities with evidence of lithium exposure or contamination from some other source — like explosions of local lithium-grease factories.
Finally, in two of the communities on the most obese list, we weren’t able to find any indication of how much lithium is in their drinking water and weren’t able to find any evidence of lithium contamination.
Overall, there is evidence of lithium contamination in most of the most obese communities. In contrast, when going down the list of the leanest communities, we didn’t find any indication of lithium contamination, and in the drinking water measurements we found, we never saw a lithium level above 25 ng/mL. We also didn’t find any evidence of fossil fuel mining or waste disposal near any of the leanest communities.
Drinking water is important, but this still surprised us — we didn’t expect such a clear association. There’s something kind of weird going on here. When we discovered evidence that wolfberries concentrate 100 ng/mL lithium in water to 1,120,000 ng/mL in the plant, we were pretty excited. Trace doses are really low compared to psychiatric doses, which makes it seem a little weird to expect trace doses to have any noticeable effect at all. But if other crops concentrate lithium like the wolfberry does, then people could be getting sub-therapeutic (i.e. pretty huge) doses from their food alone.
For a while there we thought this was the solution — that if lithium caused obesity, it did so via subtherapeutic doses in your food. But in our last post and in the examples we give above, we found what looks like a pretty strong relationship between how much lithium is in the groundwater and how obese people are, even down to the community level.
We’re not sure what to make of this. It could be that lithium doesn’t cause obesity, it’s something else that commonly co-occurs with lithium, something else found in coal ash and oilfield brines.
Maybe trace levels of lithium in your drinking water really are enough to make you obese, all by themselves. Or maybe it’s not “drinking” water per se. Maybe lithium has a different, much stronger effect when it’s absorbed through your skin, or when you inhale lithium-rich steam droplets into your lungs. If this were the case, then tap water levels would matter a lot, at least if you’re showering in the stuff. As far as we know there aren’t any studies where they had people shower in distilled water, but if you find one, let us know.
[Next Time: WHAT DO WE DO ABOUT IT?]

On Boulder vs Fort Collins, the populations are very different. Even though they are nearby and seem similarly situated, Boulder is a far richer area than Fort Collins (or just about any other city). That seems like it’d have more potential to explain the relatively small difference than water sources alone.
LikeLike
Just to echo this, The water situation all along the Front Range is similar: snowmelt that hasn’t traveled very far. The entire Front Range skews young. I would say the difference between Boulder and Ft. Collins is probably more wealth related than anything. You would also see relatively more effect of transience in Boulder because CU College kids are a higher percentage of Boulder’s population than CSU College kids are of Ft. Collins population. To get more “Permanent residents” you should probably look at Longmont or Loveland.
It would be interesting to see these lists adjusted for income and age to see if there’s a signal there.
LikeLike
Income, age and education levels. Those things stood out right away. All of the ‘obese’ places are concerning for other environmental and social reasons (eg: CT has the second best schools in the US, and OK the second worst).
LikeLike
Yakima, WA is an interesting data point. If it includes the whole county of Yakima, then it includes a substantial American Indian population (Yakama Indian Reservation), so that could help explain why it’s an outlier.
I think Yakima (like the other counties in the area) gets most of its power from hydroelectric from the Columbia River, so there shouldn’t be a lot of fossil fuel related pollution there. Although one confounding factor is that that area has a ton of volcanic ash contamination, from the Mt St Helens eruption. If you hypothesis about lithium-deep-in-the-ground is correct, perhaps that ash has a high lithium concentration? Might be worth looking into.
LikeLiked by 2 people
Those are both good points, thank you!
LikeLike
Yep, looks like there’s a history of high levels of lithium in volcanic ash, including in the Mt. St. Helens eruption specifically:
https://www.researchgate.net/publication/249521175_Vapor_transfer_prior_to_the_October_2004_eruption_of_Mount_St_Helens_Washington
Click to access report.pdf
LikeLiked by 3 people
That volcano does it christ
LikeLike
There’s pretty strong evidence that lithium levels in water correlate suicide rates I believe. Perhaps you should chekc for a correlation between suicide rates and obesity by city/state.
LikeLiked by 1 person
By state looks promising (eyeball method). By county, there is no correlation (I checked with Tableau). By individual though, it seems like there may be a negative correlation. At least according to
https://www.sciencedirect.com/science/article/abs/pii/S0165032712005290
> Eight studies evaluating completed suicide reported an inverse relationship between BMI and suicide, meaning that obese people are less likely to commit suicide than people of low or normal weight, whereas one study showed no association and one showed a positive association.
LikeLiked by 1 person
This is interesting. My understanding of suicide is that one of the most significant effects to keep in mind is that there’s an optimal level of sadness/depression at which it occurs. Before that point, the pain of living doesn’t overcome the discomfort of death, beyond it, it’s quite common to end up with people who are too depressed to kill themselves, as merely mustering the effort to perform basic tasks is too much, let alone the process of picking out a method, planning a time and place, maybe leaving a note, etc.
Perhaps this comes into play here? Obese people tend to have lower amounts of energy to begin with (no evidence here, though I’d be shocked if this weren’t true.) Perhaps their poor physical health pushes them over the hump into do-nothing-depression instead of suicide-y depression?
There’s also the fact that some of the easier methods of suicide become mildly more difficult as you gain weight. Jumping off something high requires getting high up, overdosing requires more drug, hanging requires something solid enough to hang yourself from etc. All of these methods require movement, which is inherently a more energy-consuming task the more you weigh.
Don’t forget that for suicidal people, something as simple as taking a shower can be a dauntingly difficult task at times, and even making it mildly more difficult to perform the task results in the odds of doing so dropping immensely. I think to a close friend of mine who, during the height of their depression, decided not to go in to class because they left their car keys in a pair of pants that made it into the washing machine. Retrieving them would have taken perhaps a minute, but that was too much. More scientifically, the difference in suicide rates between those with and without guns, or even between freely-accessible and securely locked guns, is significant.
LikeLike
To be clear, higher lithium levels in water are correlated with LOWER suicide rates, so if obesity is caused by high lithium levels one would expect a negative correlation between obesity and suicide rates.
Are you saying state obesity level has a positive correlation with suicide rates?
LikeLike
I have heard of an altitude effect with regards to suicide, but with the higher altitudes having higher suicides, and coastal areas being lower.
For instance, see here:
https://www.ncbi.nlm.nih.gov/pmc/articles/PMC3114154/
LikeLike
Maybe lithium is causing the obesity and also soothing people, so that they don’t commit suicide?
LikeLike
Cambridge (population ~120,000) has its own water supply, beginning with a reservoir (or perhaps that’s plural) near Route 128. Quabbin supplies the water to the MWRA (Massachusetts Water Resources Authority), supplying Boston and many Boston-area suburbs (the number keeps increasing, as more towns find their own source contaminated). One confusing thing: some communities have their own water supplies but use the use MWRA for wastewater. Cambridge is one example of that.
LikeLike
Cool, thanks for the clarification!
LikeLike
One route to consider for low doses of lithium is that it appears to undergo bone accumulation:
https://link.springer.com/chapter/10.1007/978-94-011-7197-7_40
If your bones acted as a lithium sink, that could explain why low doses in water could have an effect like therapeutic doses. A therapeutic dose over a short time will have a limited immediate bone surface area to seep into; drinking small amounts of lithium in water all your life will tend to slowly impound lithium in your bones. Perhaps it will affect the bone marrow there, or perhaps it just acts as a source for lithium if you don’t drink more.
As you age, you start losing bone mass and lithium is unlocked, so you gain some weight. Children growing up are somewhat shielded from obesity by their growing bones; when your bone growth finishes you start gaining weight, which does seem to roughly line up with age-obesity rates.
Nobody is able to figure this out by naturally experimenting with distilled water or lithium-poor foods, because they don’t experiment long enough to run out their bone stores. This might also help to explain racial discrepancies; blacks have the most bone mass and are more obese, while Asians have the least and are thinnest.
LikeLiked by 2 people
Oh how this plot thickens. I wonder if there’s any way to get it out of your system or counter-act it if it really is in your bones.
LikeLike
Now that’s a big brain idea.
However, I don’t think it can fully explain racial differences since black men don’t seem more obese than white men. It’s black women bringing the average up: https://en.wikipedia.org/wiki/Obesity_in_the_United_States#/media/File:ObesitySexRace2016.png
(assuming the measurement of obesity they use is equally valid for both races.)
LikeLike
That’s super weird! And you’re right that I can’t really explain it.
Which leads me to wonder- what could be so different between black men and black women that it’d account for an 18% gap? Is it the same thing that leads to a 4.8% gap between Asian men and women? Why doesn’t it affect white men/women?
LikeLike
This has probably been said already, but people move to boulder because they like outdoor sports. This might account for part of it’s performance versus similar cities.
LikeLiked by 1 person
I did say something very roughly like that before!
LikeLiked by 1 person
This post actually makes me a tiny bit more skeptical, here is why: when discussing the most obese cities you often point at coal power plants. But we’ve been extracting and burning coal for quite some time, and in fact it has been on the decrease precisely in the time period of interest (especially in Western Europe). Perhaps you discuss this and I missed it, but is there any reason to think coal plants release lithium or anything else in much higher quantities now than in say 1930?
Not directly related remark: it seems plausible that most forms of water pollution or even pollution in general are (weakly) correlated with one another, eg if there’s chemical industry it is going to emit all sorts of different pollutants, and you might expect the worst areas for pollutant A to overlap with the worst areas for pollutant B.
LikeLiked by 1 person
Good point. One thing that might make up the difference is that the level of lithium in fossil fuels seems to vary widely. Some oil brines have huge amounts of lithium, and some have almost none. And when we were looking at coal power plants, many showed high levels of lithium contamination, but a large portion (about 40%) did not.
It’s clear that not all coal and not all fossil fuels contain lithium, but some do. We’ve seen some claims that there’s more lithium associated with fossil fuels from arid climates, like the Middle East and the southwestern United States. We may be tapping different kinds of coal reserves now than we used to in the past, and so it’s possible that we switched from a low-lithium source to a high-lithium source. We could be mining deeper, mining different types, we could be burning it differently, etc.
In fact this is almost certainly the case, because we have good tap water lithium measures from 1964, and the levels of lithium were quite low back then, much lower than today.
You’re right on the money with the second comment too — if anyone can find a contaminant particularly correlated with lithium contamination, we’d be interested to hear it!
LikeLiked by 1 person
Looking at top mines to see what else they produce…
( https://www.mining-technology.com/features/top-ten-biggest-lithium-mines/ )
https://en.wikipedia.org/wiki/Wodgina_mine : produces iron too. lithium seems to come from Spodumene concentrate which is “a lithium aluminum silicate mineral”
Spodumene seems to be extractable using physical means, without chemical byproducts, AFAICT: https://www.sgs.com/~/media/Global/Documents/Flyers%20and%20Leaflets/SGS-MIN-WA109-Hard-Rock-Lithium-Processing-EN-11.pdf
Pilgangoora Lithium-Tantalum Project also produces Ta2O5 ie Tantalum pentoxide .
nemaska mine: “The major impurities extracted were aluminum and iron. The aluminum in the final solution varied between 3,600 and 5,000 mg/L and the iron varied between 1,200 and 1,700 mg/L.” https://www.nemaskalithium.com/assets/documents/NMX_NI4301_20190809.pdf
^ Also see on page 130: “Table 13.3 – Chemical Analysis of the Flotation Pilot Plant Composites” . Seemes to have Beryllium and some other stuff…
Idk if any of those chemicals/elements do something in your brain or if they stay in water
LikeLike
I’m a Colorado native who lived in Boulder for the first few years of my life before moving to Denver. Specifically Eldorado Springs in Boulder County which is just a few miles away. My family homesteaded there in the 1800s, and our water was from several natural springs. It was always a big deal going to check the well with my uncles. The water is exceptionally clean, and a point of pride for us. I never had a weight problem until moving to California (and turning 30). I now work during the week in Pima County, Arizona, and I’ll tell you the people around here are very fat but no one drinks the tap water as it tastes terrible. Everyone gets drinking water from the little ice/water kiosks at the gas stations. I will be in the Circle K at 5am and watch an obese mother have her kids all fill up massive big gulps and slushies. If the lithium is causing this it’s probably not through simply drinking tap water.
LikeLike
Keep in mind, that those soft drinks and slushies, are created from tap water and syrup.
LikeLike
Do they use tap water for cooking?
LikeLike
The difference in obesity between Boulder and Ft Collins could be due to the fact that there is fracking in northern Colorado and none near boulder. Also ft Collins just started getting “cool” 10 years ago and before was very much a chubby cow town.
LikeLike
Thanks for writing this very thought-provoking series. I’ve been following you guys for the past couple months. You debunked a specific paper about hypoxia leading to weight loss (1), but I’m unconvinced that hypoxic hormesis as a whole is debunked.
It is my understanding that inhibiting mTOR (i.e. through fasting or through consuming rapamycin) can help your body maintain leanness. Hypoxia downregulates mTOR activity (2). Therefore, living in a high-altitude (i.e., hypoxic) environment might help you regulate your weight.
Weaknesses with the hypoxic-hormesis-explains-altitutde-effects theory:
– West Virginians live at high altitude and thus should experience hypoxic hormesis and yet many are obese
– Doesn’t explain why obesity skyrocketed when it did
– Still requires some external explanation as to why people began becoming obese
It seems plausible to me that hypoxia might be a protective factor against obesity. But it would be just one piece of a much larger puzzle.
(1) https://slimemoldtimemold.com/2021/02/04/investigation-hypobaric-hypoxia-causes-body-weight-reduction-by-lippl-et-al-2010/
(2) https://doi.org/10.1007/978-1-61779-430-8_4
LikeLike
One thought (not sure if it’s been covered), do we know where the water for products that have wide spread consumption comes from e.g. coke/Diet Coke? It seems to be that much of the hypothesis above relies on high consumption of local drinking water, and whilst intuitively this must be the case could consuming centrally produced drinks which have water as a base and are widely distributed also contribute to the issue? Thanks
LikeLike
If we drop the idea that the issue is lithium levels in food and instead attribute the obesity epidemic to lithium in water, doesn’t this mean lithium can no longer solve “Mystery 6” from https://slimemoldtimemold.com/2021/07/07/a-chemical-hunger-part-i-mysteries/ where lab rats gained the most weight when eating highly processed human food? Even if lithium turns out to play a central role in the obesity epidemic, I wonder if there there be some kind of feedback effect with lipostat theory discussed in section 2.5 of https://slimemoldtimemold.com/2021/07/11/a-chemical-hunger-part-ii-current-theories-of-obesity-are-inadequate/ — maybe lithium could somehow weaken the brain’s natural ability to make you resist eating when it would take you over some caloric set point, even when “tempted” by especially palatable food which may have combinations of nutrients (like both high fat and high carbohydrates at once, common in a lot of junk food) not usually found in less processed foods. In that case, keeping lithium levels constant but varying the amount of temptation could still have some significant effect on weight, but the effect might be less pronounced at lower lithium levels.
Anecdotally, in early 2020 I had a blood sugar test that put me in the pre-diabetic range so I tried to start eating food with a lower glycemic index, especially for before-dinner meals and snacks, inadvertently following Guyenet’s recommendation to eat more “bland” or relatively unprocessed food (oatmeal, fruits, peanut butter, greek yogurt etc.). Even though I was making no effort to lose weight and would still eat whenever I felt hungry, the result was that I quickly dropped about 25 pounds (around 15% of my previous weight) and have stayed at that new weight since. So unless eating less processed food would actually result in less lithium or some other chemical, that unscientific observation makes me suspect the lipostat explanation might be at least part of the answer, even if it’s in combination with other effects.
LikeLike
wondering how the various theories interact with the microbiome dysbiosis causing metabolic syndrome.
is that something you’re looking into?
LikeLike
I can’t speak for them but to me it seems extremely hard to run experiments on, let alone infer from ambient statistical data. My bet is it’s a big factor though.
LikeLike
I think it’s also interesting to note that Memphis gets its water from a super deep aquifer. 500-1000 feet deep if I recall correctly (deepest points going down to like 2500 feet or something like that). I remember reading how the water is very old, which seems relevant to your WELL WELL WELL blog post.
From the Memphis utility website: “Memphis is one of the largest cities in the world with a water supply that relies exclusively on artesian wells.”
LikeLike
I found lithium data from Los Angeles County in the Water Quality Database Files from the State of California’s California Water Boards’ website at https://www.waterboards.ca.gov/drinking_water/certlic/drinkingwater/EDTlibrary.html. I’ll e-mail nitty-gritty details and a spreadsheet to the original author if possible.
From taking a quick look, the data supports the post’s assertions.
The people who get water from the City of Glendale’s Water Department, they have <5 ug/l of total lithium if the water at "GOU TW BEFORE DISINFECTION" is representative as of 2/9/2022.
And for people in the City of Riverside, if "GAGE WELL 29-2" is meaningful, then they have <10 ug/l of total lithium as of 1/27/2022.
LikeLike
Love the work!
One thing I don’t remember seeing is “immigrants v.s. locals” ratios. San Jose/Santa Clara have a large population of South and East Asian immigrants, whites from other coastal cities, and Hispanic immigrants (not that many, tbh) v.s. local whites and Hispanics who are mostly 2nd and 3rd generation locals.
If there is an effect where there is a slow build-up, it’s not going to show up in this metro area for another 10-20 years.
Another possibility for slow build-up is communicable background diseases, like CMV, cold virii, adenovirii, HPVs, gut biome, etc. If one of these is a cofactor, an immigrant population will be “localized” over a period of years.
LikeLike
You can expand your dataset of metro areas and BMI by using the CDC’s Behavioral Risk Factor Surveillance System (BRFSS). You can download microdata on many individuals having lots of health info including BMI. There is a geocode called _MMSA which identifies 118 metropolitan areas in the US. So, for those 118, you can calculate obesity prevalence (you need to use the sample weights to do this properly). Here is the web page:
https://www.cdc.gov/brfss/smart/Smart_data.htm
Click on a year to show data and documentation for that year.
LikeLike
This is a really interesting analysis. I wanted to mention that for the San Francisco-Oakland-Fremont area,large parts of the East Bay (Oakland) have water is delivered by the East Bay Municipal Utility District (EBMUD), which gets water from the Pardee Reservoir and Mokelumne river. Like Hetch Hetchy, Pardee is up in the Sierra Nevada, so the water quality is probably similar. Unfortunately the water quality reports don’t include lithium measurements:
https://www.ebmud.com/water/about-your-water/water-quality
But I think it could be interesting to see if there are regional differences in obesity in the Bay Area that could be correlated with water sources.
LikeLike