
One thing that makes lithium a plausible explanation for the obesity epidemic is that clinical doses of lithium cause weight gain as a side-effect. A clinical dose of lithium is in the range of 1000 mg (“300 mg to 600 mg … 2 to 3 times a day”), and people pretty reliably gain weight on doses this high. In a 1976 review of case records, about 60% of people gained weight on clinical doses, with an average weight gain of about 10 kg.
But those are clinical doses, and it seems like the doses you’re getting from the environment are generally much smaller. There’s usually some lithium in modern drinking water, and there’s more lithium in drinking water now than there used to be. It seems to get into the water supply from things like drilled water wells, fracking, and fossil fuel prospecting, transport, and disposal. But even with all these sources of contamination, the dose you’re getting from your drinking water is relatively low, probably not much more than 0.2 mg per day. If you live right downstream from a coal plant, or you’re chugging liter bottles of mineral water on the regular, you could maybe get 5 or 10 mg/day. But no one is getting 1000 mg/day or even 300 mg/day from their drinking water.
So what gives?
Effects of Trace Doses
One possibility is that small amounts of lithium are enough to cause obesity, at least with daily exposure.
This is plausible for a few reasons. There’s lots of evidence (or at least, lots of papers) showing psychiatric effects at exposures of less than 1 mg (see for example meta-analysis, meta-analysis, meta-analysis, dystopian op-ed). If psychiatric effects kick in at less than 1 mg per day, then it seems possible that the weight gain effect would also kick in at less than 1 mg.
There’s also the case study of the Pima in the 1970s. The Pima are a group of Native Americans who live in the American southwest, particularly around the Gila River Valley, and they’re notable for having high rates of obesity and diabetes much earlier than other groups. They had about 0.1 mg/L in their water by the 1970s (which was 50x the national median at the time), for a dose of only about 0.2-0.3 mg per day, and were already about 40% obese. All this makes the trace lithium hypothesis seem pretty reasonable.
Unfortunately, no one knows where the weight gain effects of lithium kick in. As far as we can tell, there’s no research on this question. It might cause weight gain at doses of 10 mg, or 1 mg, or 0.1 mg. Maybe 0.5 mg a week on average is enough to make some people really obese. We just don’t know.
Some people in the nootropics community take lithium, often in the form of lithium orotate (they use orotate rather than other compounds because it’s available over-the-counter), as part of their stacks. Based on community posts like this, this, and this, the general doses nootropics enthusiasts are taking are in the range of 1-15 mg per day.
We haven’t done a systematic review of the subreddit (but maybe you should, that would be a good project for someone) but they seem to report no effects or mild positive effects at 1 or 2 mg lithium orotate and brain fog and fatigue at 5 mg lithium orotate and higher. Some of them report weight gain, even on doses this low. The fact that a couple extra mg might be enough to push you over the line suggests that the weight gain tipping point is somewhere under 10 mg, maybe a lot under. And for what it’s worth, all of this is consistent with the only randomized controlled trial examining the effects of trace amounts of lithium which found results at just 0.4 mg a day.
Clinical and Subclinical Doses
Another possibility is that people really ARE getting unintended clinical doses of lithium. We see two reasons to think that this might be possible.
#1: Doses in the Mirror may be…
The first is that clinical doses are smaller than they appear.
When a doctor prescribes you lithium, they’re always giving you a compound, usually lithium carbonate (Li2CO3). Lithium is one of the lightest elements, so by mass it will generally be a small fraction of any compound it is part of. A simple molecular-weight calculation shows us that lithium carbonate is only about 18.7% elemental lithium. So if you take 1000 mg a day of lithium carbonate, you’re only getting 187.8 mg/day of the active ingredient.

For bipolar and similar disorders, lithium carbonate has become such a medical standard that people usually just refer to the amount of the compound. It’s very unusual for an ion to be a medication, so this nuance is one that some doctors/nurses don’t notice. It’s pretty easy to miss. In fact, we missed it too until we saw this reddit comment from u/PatienceClarence/, which begins, “First off we need to differentiate between the doses of lithium orotate vs elemental lithium. For example, my dosage was 130 mg orotate which would give me 5 mg ‘pure’ lithium…”
Elemental lithium is what we really care about, and when we look at numbers from the USGS or serum samples or whatever, they’re all talking about elemental lithium. When we say people get 0.1 mg/day from their water, or when we talk about getting 3 mg from your food, that’s milligrams of elemental lithium. When we say that your doctors might give you 600 mg per day, that’s milligrams lithium carbonate — and only 112.2 milligrams a day of elemental lithium. With this in mind, we see that the dose of elemental lithium is always much lower than the dose as prescribed.
A high clinical dose is 600 mg lithium carbonate three times a day (for a total of 1800 mg lithium carbonate or about 336 mg elemental lithium), but many people get clinical doses that are much smaller than this. Low doses seem to be more like 450 mg lithium carbonate per day (about 84 mg/day elemental lithium) or even as little as 150 mg lithium carbonate per day (about 28 mg/day elemental lithium).
Once we take the fact that lithium is prescribed as a compound into account, we see that the clinical dosage is really closer to something like 300 mg/day for a high dose and 30 mg/day for a low dose. So at this point we just need to ask, is it possible that people might occasionally be getting 30 mg/day or more lithium in the course of their everyday lives? Unfortunately we think the answer is yes.
#2: Concentration in Food
The other reason to think that modern people might be getting clinical or subclinical doses on the regular is that there’s clear evidence that lithium concentrates in some foods.
Again, consider the Pima. The researchers who tested their water in the 1970s also tested their crops. While most crops were low in lithium, they found that one crop, wolfberries, contained an incredible 1,120 mg/kg.
By our calculations, you could easily get 15 mg of lithium in a tablespoon of wolfberry jelly. If the Pima ate one tablespoon a day, they would be getting around 100 times more lithium from that tablespoon than they were getting from their drinking water.
The wolfberries in question (Lycium californium) are a close relative of goji berries (Lycium barbarum or Lycium chinense). The usual serving size of goji berries is 30 grams, which if you were eating goji berries like the ones the Pima were eating, would provide about 33.6 mg of lithium. This already puts you into clinical territory, a little more than someone taking a 150 mg tablet of lithium carbonate.
If you had a hankering and happened to eat three servings of goji berries in one day, you would get just over 100 mg of lithium from the berries alone. We don’t know how much people usually eat in one go, but it’s easy enough to buy a pound (about 450 g) of goji berries online. We don’t have any measurements of how much lithium are in the goji berries you would eat for a snack, but if they contained as much lithium as the wolfberries in the Gila River Valley, the whole 1 lb package would contain a little more than 500 mg of lithium.
So. Totally plausible that some plants concentrate 0.1 mg/L lithium in water into 1,120 mg/kg in the plant, because Sievers & Cannon have measurements of both. Totally plausible that you could get 10 or even 100 mg if you’re eating a crop like this. So now we want to know, are there other crops that concentrate lithium? And if so, what are they?
In this review, we take a look at the existing literature and try to figure out how much lithium there is in different foods. What crops does it concentrate in? Is there any evidence that foods are further contaminated in processing or transport? There isn’t actually all that much work on these questions, but we’ll take a look at what we can track down.
Let’s not bury the lede: we find evidence of subclinical levels of lithium in several different foods. But most of the sources that report these measurements are decades old, and none of them are doing anything like an exhaustive search. That’s why at the end of this piece, we’re going to talk a little bit about our next project, a survey of lithium concentrations in foods and beverages in the modern American food supply.
Because of this, our goal is not to make this post an exhaustive literature review; instead, our goal is to get a reasonable sense of how much lithium is in the food supply, and where it is. When we do our own survey of modern foods, what should we look at first? This review is a jumping off point for our upcoming empirical work.
Context for the Search
But first, a little additional context.
There are a few official estimates of lithium consumption we should consider (since these are in food and water, all these numbers should be elemental lithium). This review paper from 2002 says that “the U.S. Environmental Protection Agency (EPA) in 1985 estimated the daily Li intake of a 70 kg adult to range from [0.650 to 3.100 mg].” The source they cite for this is “Saunders, DS: Letter: United States Environmental Protection Agency. Office of Pesticide Programs, 1985”, but we can’t find the original letter. As a result we don’t really know how accurate this estimate is, but it suggests people were getting about 1-3 mg per day in 1985.
These numbers are backed up by some German data which appear originally to be from a paper from 1991, which we will discuss more in a bit:
In Germany, the individual lithium intake per day on the average of a week varies between [0.128 mg/day] and [1.802 mg/day] in women and [0.139] and [3.424 mg/day] in men.
The paper also includes histograms of those distributions:
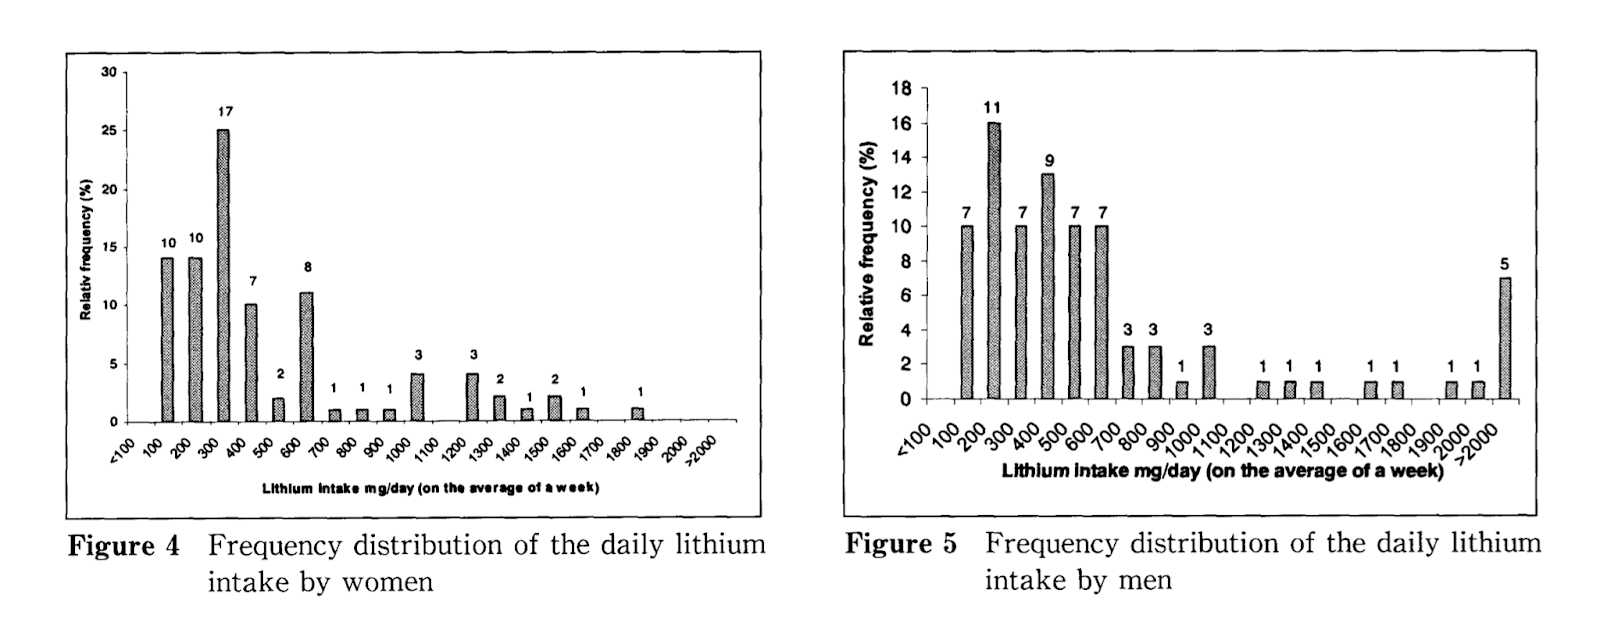
We want to call your attention to the shape of both of these distributions, because the shape is going to be important throughout this review. Both distributions are pretty clearly lognormal, meaning they peak early on but then have a super long tail off to the right. For example, most German men in this study were getting only about 0.2 to 0.4 mg of lithium per day, but twelve of them were getting more than 1 mg a day, and five of them were getting more than 2 mg a day. At least one person got more than 3 mg a day. And this paper is looking at a pretty small group of Germans. If they had taken a larger sample, we would probably see a couple people who were consuming even more. You see a similar pattern for women, just at slightly lower doses.
We expect pretty much every distribution we see around food and food exposure to be lognormal. The amount people consume per day should usually be lognormally distributed, like we see above. The distribution of lithium in any foods and crops will be lognormal. So will the distribution of lithium levels in water sources. For example, lithium levels in that big USGS dataset of groundwater samples we always talk about are distributed like this:
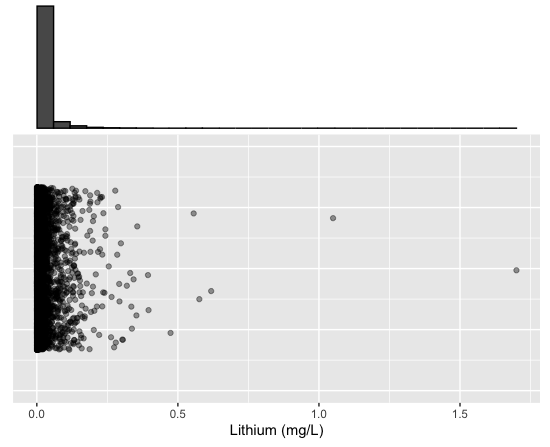
Again we see a clear lognormal distribution. Most groundwater samples they looked at had less than 0.2 mg/L lithium. But five had more than 0.5 mg/L and two had more than 1 mg/L.
This is worth paying close attention to, because when a variable is lognormally distributed, means and medians will not be very representative. For example, in the groundwater distribution you see above, the median is .0055 mg/L and the mean is .0197 mg/L.
These sound like really tiny amounts, and they are! But the mean and the median do not tell anywhere close to the full story. If we keep the long tail of the distribution in mind, we see that about 4% of samples contain more than 0.1 mg/L, about 1% of samples contain more than 0.2 mg/L, and of course the maximum is 1.7 mg/L.
This means that about 4% of samples contain more than 20x the median, about 1% of samples contain more than 40x the median, and the maximum is more than 300x the median.
Put another way, about 4% of samples contain more than 5x the mean, about 1% of samples contain more than 10x the mean, and the maximum is more than 80x the mean.
We should expect similar distributions everywhere else, and we should expect means and medians to consistently be misleading in the same way. So if we find a crop with 1 mg/kg of lithium on average, that suggests that the maximum in that crop might be as high as 80 mg/kg! If this math is even remotely correct, you can see why crops that appear to have a low average level of lithium might still be worth empirically testing.
Another closely related point: that USGS paper only found those outliers because it’s a big survey, 4700 samples. Small samples will be even more misleading. Let’s imagine the USGS had taken a small number of samples instead. Here are some random sets of 6 observations from that dataset:
0.044, 0.007, 0.005, 0.036, 0.001, 0.002
0.002, 0.028, 0.005, 0.001, 0.009, 0.001
0.003, 0.006, 0.002, 0.001, 0.001, 0.006
We can see that small samples ain’t representative. If we looked at a sample of six US water sources and found that all of them contained less than 0.050 mg/L of lithium, we would miss that some US water sources out there contain more than 0.500 mg/L. In this situation, there’s no substitute for a large sample size (or, the antidote is to be a little paranoid about how long the tail is).
So if we looked at a sample of (for example) six lemons, and found that all of them contained less than 10 mg/kg of lithium, we might easily be missing that there are lemons out there that contain more than 100 mg/kg.
In any case, the obvious lognormal distribution fits really well with the kind of bolus-dose explanation we discussed with JP Callaghan, who said:
My thought was that bolus-dosed lithium (in food or elsewhere) might serve the function of repeated overfeeding episodes, each one pushing the lipostat up some small amount, leading to overall slow weight gain. … I totally vibe with the prediction that intake would be lognormally distributed. … lognormally distributed doses of lithium with sufficient variability should create transient excursions of serum lithium into the therapeutic range.
In the discussion with JP Callaghan, we also said:
Because of the lognormal distribution, most samples of food … would have low levels of lithium — you would have to do a pretty exhaustive search to have a good chance of finding any of the spikes. So if something like this is what’s happening, it would make sense that no one has noticed.
What we’re saying is that even if people aren’t getting that much lithium on average, if they sometimes get huge doses, that could be enough to drive their lipostat upward. If we take that model seriously, the average amount might not not be the real driver, and we should focus on whether there are huge lithium bombs out there, and how often you might encounter them. Or it could be even more complicated! Maybe some foods give you repeated moderate doses, and others give you rare megadoses.
Two final notes before we start the review:
First, if two sources disagree — one says strawberries are really high in lithium and the other says that strawberries are really low in lithium, or something — we should keep in mind that disagreement might mean something like “the strawberries were grown in different conditions (i.e. one batch was grown in high-lithium soil and the other batch wasn’t)” or even “apparently identical varieties of strawberries concentrate lithium differently”. There isn’t a simple answer to simple-sounding questions like “how much lithium is in a strawberry” because reality is complicated and words make it easy to hide that complexity without thinking about it.
Second, we want to remind you that whatever dose causes obesity, lithium is also a powerful sedative with well-known psychiatric effects. If you’re getting doses up near the clinical range, it’s gonna zonk you out and probably stress your kidneys.
Ok. What crops concentrate lithium?
Lithium Concentration
Unfortunately we couldn’t find several of the important primary sources, so in a number of places, we’ve had to rely on review papers and secondary sources. We’re not going to complain “we couldn’t find the primary source” every time, but if you’re ever like “why are they citing a review paper instead of the original paper?” this is probably why.
We should warn you that these sources can be a little sloppy. Important tables are labeled unclearly. Units are often given incorrectly, like those histograms above that say mg/day when they should almost certainly say µg/day. When you double-check their citations, the numbers don’t always match up. For example, one of the review papers said that a food contained 55 mg/kg of lithium. But when we double-checked, their source for that claim said just 0.55 mg/kg in that food. So we wish we were working with all the primary sources but we just ain’t. Take all these numbers with a grain of salt.
Particularly important modern reviews include Lithium toxicity in plants: Reasons, mechanisms and remediation possibilities by Shahzad et al. (2016), Regional differences in plant levels and investigations on the phytotoxicity of lithium by Franzaring et al. (2016), and Lithium as an emerging environmental contaminant: Mobility in the soil-plant system by Robinson et al. (2018). Check those out if you finish this blog post and you want to know more.
It’s worth noting just how concerned some of these literature reviews sound. Shahzad et al. (2016) say in their abstract, “The contamination of soil by Li is becoming a serious problem, which might be a threat for crop production in the near future. … lack of considerable information about the tolerance mechanisms of plants further intensifies the situation. Therefore, future research should emphasize in finding prominent and approachable solutions to minimize the entry of Li from its sources (especially from Li batteries) into the soil and food chain.”
Older reviews include The lithium contents of some consumable items by Hullin, Kapel, and Drinkall — a 1969 paper which includes a surprisingly lengthy review of even older sources, citing papers as far back as 1917. Sadly we weren’t able to track down most of these older sources, and the ones we could track down were pretty vague. Papers from the 1930s just do not give all that much detail. Still, very cool to have anything this old.
There’s also Shacklette, Erdman, Harms, and Papp (1978), Trace elements in plant foodstuffs, a chapter from (as far as we can tell) a volume called “Toxicity of Heavy Metals in the Environment”, which is part of a series of reference works and textbooks called “HAZARDOUS AND TOXIC SUBSTANCES”. It was sent to us by a very cool reader who refused to accept credit for tracking it down. If you want to see this one, email us.
A bunch of the best and most recent information comes from a German fella named Manfred Anke, who published a bunch of papers on lithium in food in Germany in the 1990s and 2000s. He did a ton of measurements, so you will keep seeing his name throughout. Unfortunately the papers we found from Anke mostly reference measurements from earlier work he did, which we can’t find. Sadly he is dead so we cannot ask him for more detail.
From Anke, in case anyone can track them down, we’d especially like to see a couple papers from the 1990s. Here they are exactly as he cites them:
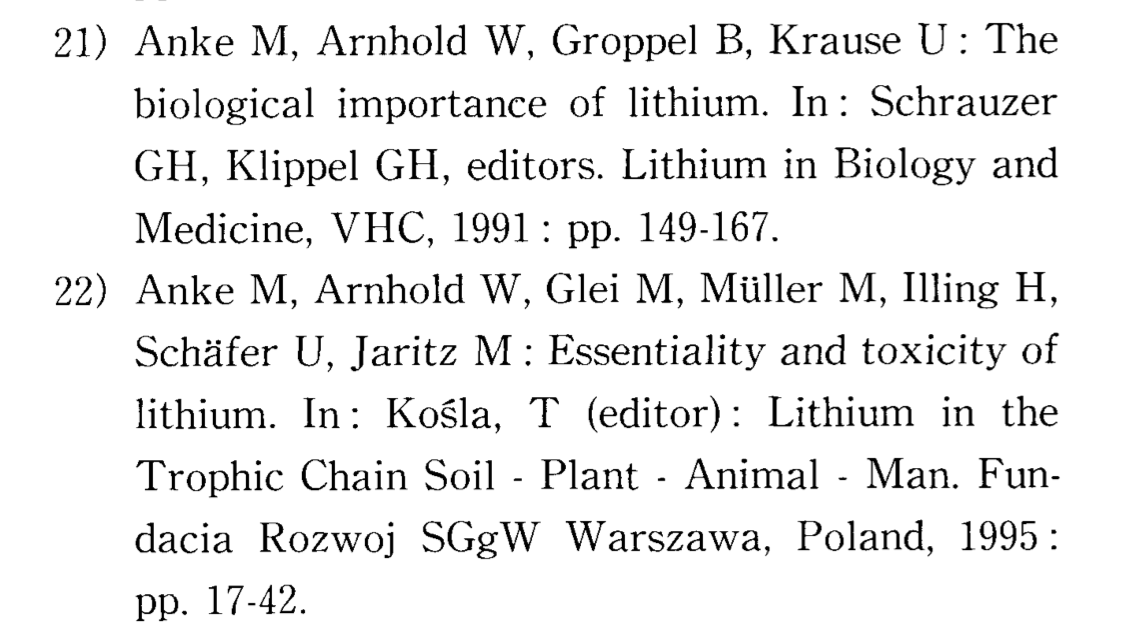
Anke’s numbers are very helpful, but we think they are a slight underestimation of what is in our food today. We’re pretty sure lithium levels in modern water are higher than levels in the early 1990s, and we’re pretty sure lithium levels are higher in US water than in water in Germany. In a 2005 paper, Anke says: “In Germany, the lithium content of drinking water varies between 4 and 60 µg/L (average : 10 µg/L).” Drinking water in the modern US varies between undetectable and 1700 µg/L (1.7 mg/L), and even though that 1700 is an outlier, about 8% of US groundwater samples contain more than 60 µg/L, the maximum Anke gives for Germany. The mean for US groundwater is 19.7 µg/L, compared to the 10 µg/L Anke reports.
So the smart money is that Anke’s measurements are probably all lower than the levels in modern food, certainly lower than the levels in food in the US.
Here’s another thing of interest: in one paper Anke estimates that in 1988 Germany, the average daily lithium intake for women was 0.373 mg, and the average daily lithium intake for men was 0.432 mg (or something like that; it REALLY looks like he messed up labeling these columns, luckily the numbers are all pretty similar). By 1992, he estimates that the average daily lithium intake for women was 0.713 mg, and the average daily lithium intake for men was 1.069 mg. He even explicitly comments, saying, “the lithium intake of both sexes doubled after the reunification of Germany and worldwide trade.”
That last bit about trade suggests he is maybe blaming imported foods with higher lithium levels, but it’s not really clear. He does seem to think that many foreigners get more lithium than Germans do, saying, “worldwide, a lithium intake for adults between [0.660 and 3.420 mg/day] is calculated.”
Anyways, on to actual measurements.
Beverages
Beverages are probably not giving you big doses of lithium, with a few exceptions.
Most drinking water doesn’t contain much lithium, rarely poking above 0.1 mg/L. Some beverages contain more, but not a lot more. The big exception, no surprise, is mineral water.
As usual, Anke and co have a lot to say. The Anke paper from 2003 says, “cola and beer deliver considerable amounts of lithium for humans, and this must be taken into consideration when calculating the lithium balance of humans.” The Anke paper from 2005 says that “amounts of [0.002 to 5.240 mg/L] were found in mineral water. Like tea and coffee, beer, wine and juices can also contribute to the lithium supply.” But the same paper reports a range of just 0.018 – 0.329 mg/L in “beverages”. Not clear where any of these numbers come from, or why they mention beer in particular — the citation appears to be the 1995 Anke paper we can’t find.
In fact, Anke seems to disagree with himself. The 2005 paper mentions tea and coffee contributing to lithium exposure. But the 2003 paper says, “The total amount in tea and coffee, not their water-soluble fraction in the beverage, was registered. Their low lithium content indicates that insignificant amounts of lithium enter the diet via these beverages.”
This 2020 paper, also from Germany, finds a weak relationship for beer and wine and a strong relationship for tea with plasma concentrations for lithium. We think there are a lot of problems with this method (the serum samples are probably taken fasted, and lithium moves through the body pretty quickly) but it’s interesting.
Franzaring et al. (2016), one of those review papers, has a big figure summarizing a bunch of other sources, which has this to say about some beverages:
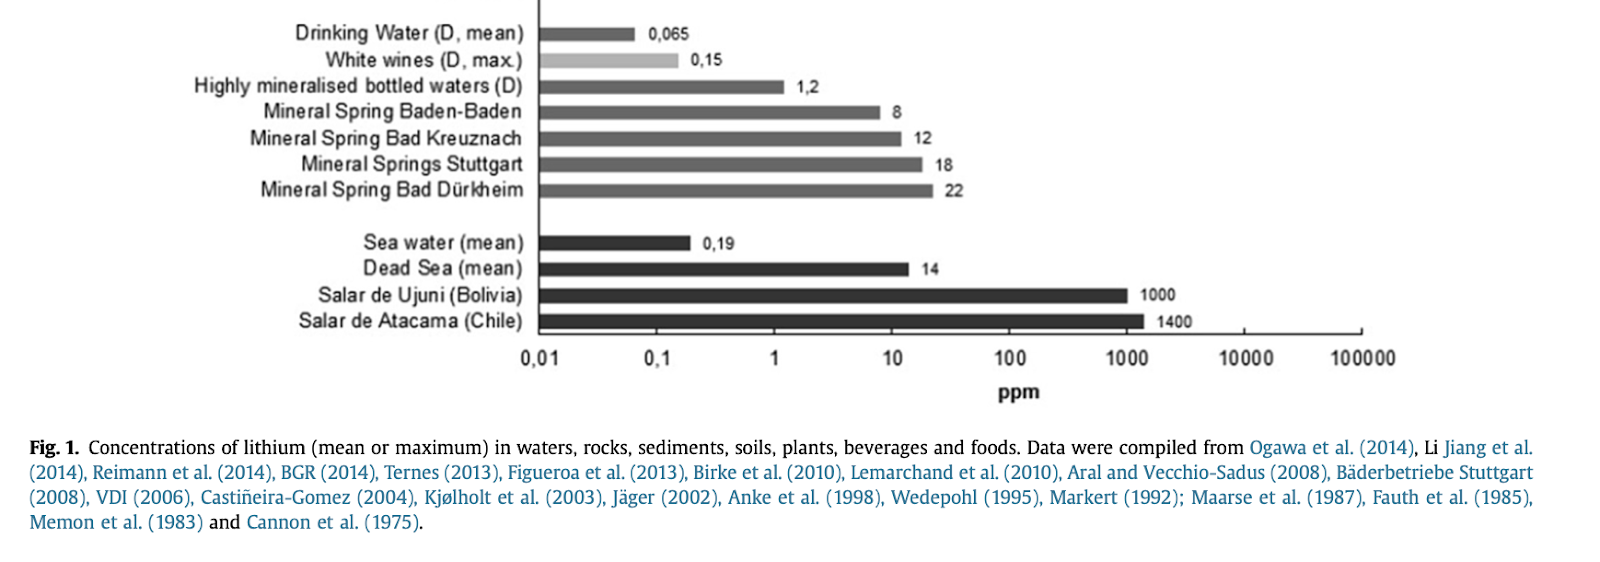
So obviously mineral water can contain a lot — if you drank enough, you could probably get a small clinical dose from mineral water alone. On the other hand, who’s drinking a liter of mineral water? Germans, apparently.
We think their sources for wine are Classification of wines according to type and region based on their composition from 1987 and Classification of German White Wines with Certified Brand of Origin by Multielement Quantitation and Pattern Recognition Techniques from 2004. The 1987 paper reports average levels of lithium in Riesling and Müller-Thurgau wines in the range of about 0.010 mg/L, and a maximum of only 0.022 mg/L. The 2004 paper looks at several German white wines, and reports a maximum of 0.150 mg/L. This is pretty unsystematic but does seem to indicate an increase.
This paper from 2000 similarly finds averages of 0.035 and 0.019 mg/L in red wines from northern Spain. This 1994 paper and this 1997 paper both report similar values. We also found this 1988 paper looking at French red wines which suggests a range from 2.61 to 17.44 mg/L lithium. Possibly this was intended to be in µg/L instead of in mg/L? “All results are in milligrams per liter except Li, which is in micrograms per liter” is a disclaimer we’ve seen in more than one of these wine papers.
So it might be good to check, but overall we don’t think you’ll see much more than 0.150 mg/L in your wine, and most of you are hopefully drinking less than a full liter at a time.
The most recent and most comprehensive source for beverages, however, is a 2020 paper called Lithium Content of 160 Beverages and Its Impact on Lithium Status in Drosophila melanogaster. Forget the Drosophila, let’s talk about all those beverages. This is yet another German paper, and they analyzed “160 different beverages comprising wine and beer, soft and energy drinks and tea and coffee infusions … by inductively coupled plasma mass spectrometry (ICP-MS).” And unlike other sources, they give all the numbers — If you want to know how much lithium they found in Hirschbraeu/Adlerkoenig, “Urtyp, hell” or the cola known as “Schwipp Schwapp”, you can look that up.

They find that, aside from mineral water, most beverages in Germany contain very little lithium. Concentration in wine, beer, soft drinks, and energy drinks was all around 0.010 mg/L, and levels in tea and coffee barely ever broke 0.001 mg/L.
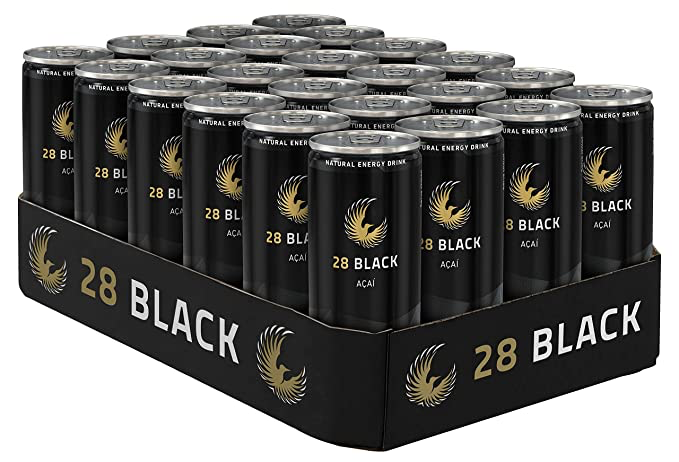
The big outlier is the energy drink “Acai 28 Black, energy”, which contained 0.105 mg/L. This is not a ton in the grand scheme of things — it’s less than some sources of American drinking water — but it’s a lot compared to the other beverages in this list. They mention, “it has been previously reported that Acai pulp contains substantial concentrations of other trace elements, including iron, zinc, copper and manganese. In addition to acai extract, Acai 28 black contains lemon juice concentrate, guarana and herb extracts, which possibly supply Li to this energy drink.”
We want to note that beverages in America may contain more lithium, just because American drinking water contains more lithium than German drinking water does. But it’s doubtful that people are getting much exposure from beverages beyond what they get from the water it’s made with.
Basic Foods
We also have a few leads on what might be considered “basic” or “component” foods.
Anke mentions sugars a bit, though doesn’t go into much detail, saying, “honey and sugar are also extremely poor in lithium…. The addition of sugar apparently leads to a further reduction of the lithium content in bread, cake, and pastries.“ At one point he lists the range of “Sugar, honey” as being 0.199 – 0.527 mg/kg, with a mean of 0.363 mg/kg. That’s pretty low.
We also have a little data from the savory side. This paper from 1969 looked at levels in various table salts, finding (in mg/kg):
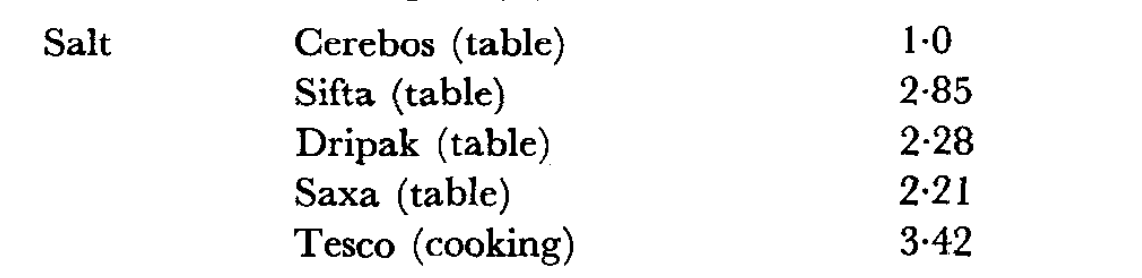
On the one hand, those are relatively high levels of lithium. On the other hand, who’s eating a kilogram of salt? Even if table salt contains 3 mg/kg, you’re just never gonna get even close to getting 1 mg from your salt.
Plant-Based Foods
It’s clear that plants can concentrate lithium, and some plants concentrate lithium more than others. It’s also clear that some plants concentrate lithium to an incredible degree. This last point is something that is emphasized by many of the reviews, with Shahzad et al. (2016) for example saying, “different plant species can absorb considerable concentration [sic] of Li.”
Plant foods have always contained some lithium. The best estimate we have for preindustrial foods is probably this paper that looked at foods in the Chocó rain forest around 1970, and found (in dry material): 3 mg/kg in breadfruit; 1.5 mg/kg in cacao, 0.4 mg/kg in coconut, 0.25 mg/kg in taro, 0.4 mg/kg in yam, 0.6 mg/kg in cassava, 0.5 mg/kg in plantain fruits, 0.1 mg/kg in banana, 0.3 mg/kg in rice, 0.01 mg/kg in avocado, 0.5 mg/kg in dry beans, and 0.05 mg/kg in corn grains. Not nothing, but pretty low doses overall.
There are a few other old sources we can look at. Shacklette, Erdman, Harms, and Papp (1978) report a paper by Borovik-Romanova from 1965, in which she “reported the Li concentration in many plants from the Soviet Union to range from 0.15 to 5 [mg/kg] in dry material; she reported Li in food plants as follows ([mg/kg] in dry material): tomato, 0.4; rye, 0.17; oats, 0.55; wheat, 0.85; and rice, 9.8.” That’s a lot in rice, but we don’t know if that’s reliable, and we haven’t seen any other measurements of the levels in rice. We weren’t able to track the Borovik-Romanova paper down, unfortunately.
From here, we can try to narrow things down based on the better and more modern measurements we have access to.
Cereals
We haven’t seen very much about levels in cereals / grains / grass crops, but what we have seen suggests very low levels of accumulation.
Hullin, Kapel, and Drinkall (1969) mention an earlier review which found that the Gramineae (grasses) were especially “poor in lithium”, giving a range of 0.47-1.07 mg/kg.
Borovik-Romanova reported, in mg/kg, “rye, 0.17; oats, 0.55; wheat, 0.85; and rice, 9.8” in 1965 in the USSR. Most of these concentrations are very low. Again, rice is abnormally high, but this measurement isn’t at all corroborated. And since we haven’t been able to find this primary source, there’s a good chance it should read 0.98 instead.
Anke, Arnhold, Schäfer, & Müller (2005) report levels from 0.538 to 1.391 mg/kg in “cereal products”, and in a 2003 paper, say “the different kinds of cereals grains are extremely lithium-poor as seeds.” Anke reports slightly lower levels in derived products like “bread, cake”.
There’s also this unusual paper on corn being grown hydroponically in solutions containing various amounts of lithium. They find that corn is quite resistant to lithium in its water, actually growing better when exposed to some lithium, and only seeing a decline at concentrations around 64 mg/L. (“the concentration in solution ranging from 1 to 64 [mg/L] had a stimulating effect, whereas a depression in yielding occurred only at the concentrations of 128 and 256 [mg/L].”) But the plant also concentrates lithium — even when only exposed to 1 mg/L in its solution, the plant ends up with an average of about 11 mg/kg in dry material. Unfortunately they don’t seem to have measured how much ends up in the corn kernels, or maybe they didn’t let the corn develop that far. Seems like an oversight. (Compare also this similar paper from 2012.)
Someone should definitely double-check those numbers on rice to be safe, and corn is maybe a wildcard, but for now we’re not very worried about cereal crops.
Leafy Vegetables
A number of sources say that lithium tends to accumulate in leaves, suggesting lithium levels might be especially high in leafy foods. While most of us are in no danger of eating kilograms of cabbage, it’s worth looking out for.
In particular, Robinson et al. (2018) observed significant concentration in the leaves of several species as part of a controlled experiment. They planted beetroot, lettuce, black mustard, perennial ryegrass, and sunflower in controlled environments with different levels of lithium exposures. “When Li was added to soil in the pot experiment,” they report, “there was significant plant uptake … with Li concentrations in the leaves of all plant species exceeding 1000 mg/kg (dry weight) at Ca(NO3)2-extractable concentrations of just 5 mg/kg Li in soil, representing a bioaccumulation coefficient of >20.” For sunflowers in particular, “the highest Li concentrations occurred in the bottom leaves of the plant, with the shoots, roots and flowers having lower concentrations.”
Obviously this is reason for concern, but these are plants grown in a lab, not grown under normal conditions. We want to check this against actual measurements in the food supply.
Hullin, Kapel, and Drinkall (1969) report that an earlier source, Bertrand (1943), “found that the green parts of lettuce contained 7.9 [mg/kg] of lithium.” They wanted to follow up on this surprisingly high concentration, so they tested some lettuce themselves, finding:

This pretty clearly contradicts the earlier 7.9 mg/kg, though the fact that lettuce can contain up to 2 mg/kg is still a little surprising. This could be the result of lettuce being grown in different conditions, the lognormal distribution, etc., but even so it’s reassuring to see that not all lettuce in 1969 contained several mg per kg.
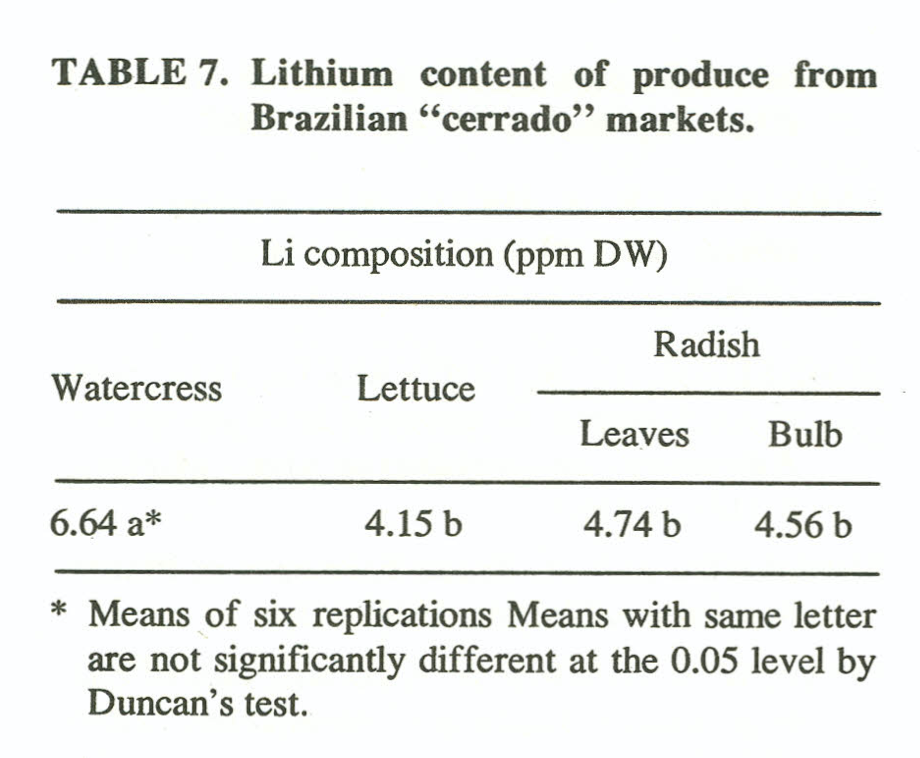
In this study from 1990, the researchers went and purchased radish, lettuce and watercress at the market in Brazil, and found relatively high levels in all of them:
Let’s also look at this modern table that reviews a couple more recent sources, from Shahzad et al.:
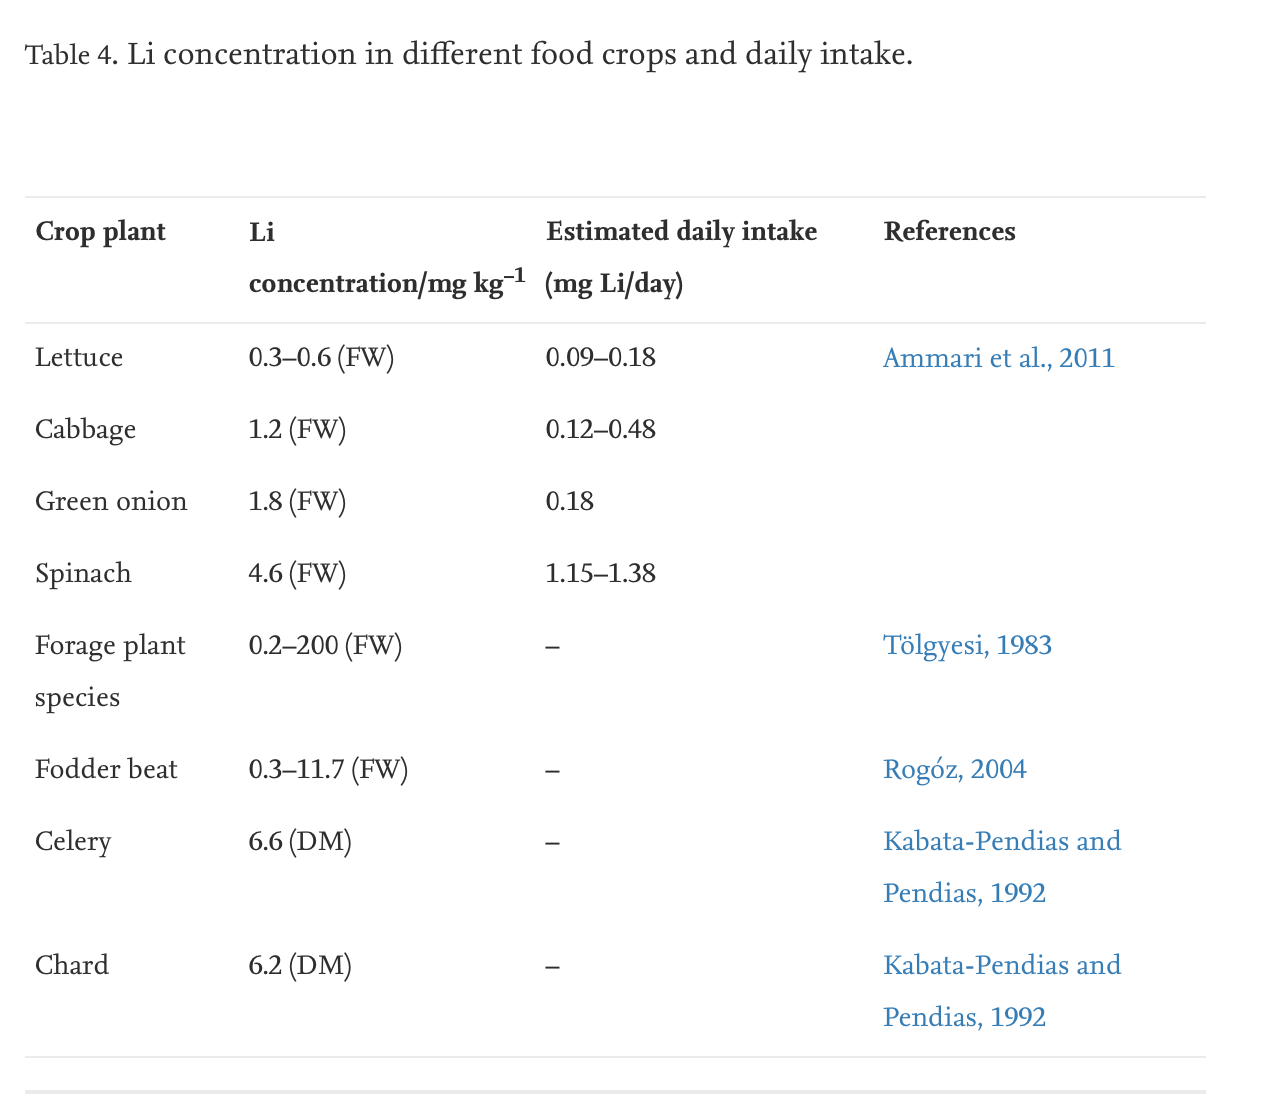
None of these are astronomical, but it’s definitely surprising that spinach contains more than 4 mg/kg and celery and chard both contain more than 6 mg/kg, at least in these measurements.
So not to sound too contrarian but, maybe too many leafy greens are bad for your health.
Fruits & Non-Leafy Veggies
Anke, Arnhold, Schäfer, & Müller (2005) say that “fruits and vegetables supply 1.0 to 7.0 mg Li/kg,” and report levels from 0.383 to 6.707 mg/kg in fruits.
This is a wide range, and a pretty high ceiling. But as usual, Anke is much vaguer than we might hope. He gives some weird hints, but no specific measurements. In the 2003 paper, Anke says, “as a rule, fruits contain less lithium than vegetative parts of plants (vegetables). Lemons and apples contained significantly more lithium, with about 1.4 mg/kg dry matter, than peas and beans.”
More specific numbers have been hard to come by. We’ve found a pretty random assortment, like how Shahzad et al. report that “in a hydroponic experiment, Li concentration in nutrient solution to 12 [mg/L], increased cucumber fruit yield, fruit sugar, and ascorbic acid levels, but Li did not accumulate in the fruit (Rusin, 1979).” It’s interesting that cucumbers survive just fine in water containing up to 12 mg/L, and that suggests that lithium shouldn’t accumulate in cucumbers under any realistic water levels. But cucumbers are not a huge portion of the food supply.
What we do see all the time is sources commenting on how citrus plants are very sensitive to lithium. Anke says, “citrus trees are the most susceptible to injury by an excess of lithium, which is reported to be toxic at a concentration of 140–220 p.p.m. in the leaves.” Robinson et al. (2018) say, “citing numerous sources, Gough et al. (1979) reported a wide variation in plant tolerance to Li; citrus was found to be particularly sensitive, whilst cotton was more tolerant.” Shahzad et al. say, “Bradford (1963) found reduced and stunted growth of citrus in southern California, U.S.A., with the use of highly Li-contaminated water for irrigation. … Threshold concentrations of Li in plants are highly variable, and moderate to severe toxic effects at 4–40 mg Li kg−1 was observed in citrus leaves (Kabata-Pendias and Pendias, 1992).” This Australian Water Quality Guidelines for Fresh and Marine Waters document says, “except for citrus trees, most crops can tolerate up to 5 mg/L in nutrient solution (NAS/NAE 1973). Citrus trees begin to show slight toxicity at concentrations of 0.06–0.1 mg/L in water (Bradford 1963). Lithium concentrations of 0.1–0.25 mg/L in irrigation water produced severe toxicity symptoms in grapefruit … (Hilgeman et al. 1970)”.
All tantalizing, but we can’t get access to any of those primary sources. For all we know this is a myth that’s been passed around the agricultural research departments since the 1960s.

Even if citrus trees really are extra-sensitive to lithium, it’s not clear what that means for their fruits. Maybe it means that citrus fruits are super-low in lithium, since the tree just dies if it’s exposed to even a small amount. Or maybe it means that citrus fruits are super-high in lithium — maybe citrus trees absorb lithium really quickly and that’s why lithium kills them at relatively low levels.
So it’s interesting but at this point, the jury is out on citrus.
Nightshades
Multiple sources mention that the Solanaceae family, better known as nightshades, are serious concentrators of lithium. Hullin, Kapel, and Drinkall mention that even in the 1950s, plant scientists were aware that nightshades are often high in lithium. Anke, Schäfer, & Arnhold (2003) mention, “Solanaceae are known to have the highest tolerance to lithium. Some members of this family accumulate more than 1000 p.p.m. lithium.” Shacklette, Erdman, Harms, and Papp (1978) even mention a “stimulating effect of Li as a fertilizer for certain species, especially those in the Solanaceae family.”
Shahzad et al. (2016) say, “Schrauzer (2002) and Kabata-Pendias and Mukherjee (2007) noted that plants of Asteraceae and Solanaceae families showed tolerance against Li toxicity and exhibited normal plant growth,” and, “some plants of the Solanaceae family, when grown in an acidic climatic zone accumulate more than 1000 mg/kg Li.” We weren’t able to track down most of their sources for these claims, but we did find Schrauzer (2002). He mentions that Cirsium arvense (creeping thistle) and Solanum dulcamara (called things like fellenwort, felonwood, poisonberry, poisonflower, scarlet berry, and snakeberry; probably no one is eating these!) are notorious concentrators of lithium, and he repeats the claim that some Solanaceae accumulate more than 1000 mg/kg lithium, but it’s not clear what his source for this was.
Hullin, Kapel, and Drinkall mention in particular one source from 1952 that found a range of 1.8-7.96 [mg/kg] in members of the Solanaceae. 7.9 mg/kg in some nightshades is enough to be concerned, but they don’t say which species this measurement comes from.
The finger seems to be pointing squarely at the Solanaceae — but which Solanaceae? This family is huge. If you know anything about plants, you probably know that potatoes and tomatoes are both nightshades, but you may not know that nightshades also include eggplants, the Capsicum (including e.g. chili peppers and bell peppers), tomatillos, some gooseberries, the goji berry, and even tobacco.
We’ve already seen how wolfberries / goji berries can accumulate crazy amounts under the right circumstances, which does make this Solanaceae thing seem even more plausible.
Anke, Schäfer, & Arnhold (2003) mention potatoes in particular in one section on vegetable foods, saying: “All vegetables and potatoes contain > 1.0 mg lithium kg−1 dry matter.” There isn’t much detail, but the paper does say, “peeling potatoes decreases their lithium content, as potato peel stores more lithium than the inner part of the potato that is commonly eaten.”
That same paper that tries to link diet to serum lithium levels does claim to find that a diet higher in potatoes leads to more serum lithium, but we still think this paper is not very good. If you look at table 4, you see that there’s not actually a clear association between potatoes and serum levels. Table 5 says that potatoes come out in a regression model, but it’s a bit of an odd model and they don’t give enough detail for us to really evaluate it. And again, these serum concentrations were taken fasted, so they didn’t measure the right thing.
It’s much better to just measure the lithium in potatoes directly. Anke seems to have done this in the 1990s, but he’s not giving any details. We’ll have to go back all the way to 1969, when Hullin, Kapel, and Drinkall included three varieties of potatoes in their study (numbers in mg/kg):

These potatoes, at least, are pretty low in lithium. The authors do specifically say these were peeled potatoes, which may be important in the light of Anke’s comment about the peels. These numbers are pretty old, and modern potatoes probably are exposed to more lithium. But even so, these potatoes do not seem to be mega-concentrators, and Hullin, Kapel, and Drinkall did find some serious concentrators even back in 1969.
This is especially interesting to us because it provides a little support for the idea that the potato diet might cause weight loss by reducing your lithium intake and forcing out the lithium already in your system with a high dose of potassium, or something. At the very least, it looks like you’d get less lithium in your diet if you lived on only potatoes than if you somehow survived on only lettuce (DO NOT TRY THE LETTUCE DIET).
Apparently the nightshade family’s tendency to accumulate lithium does not include the potatoes (unless the peeling made a huge difference?). This suggests that the high levels might have come from some OTHER nightshade. Obviously we have already seen huge concentrations in the goji berry (or at least, a close relative). But what about other nightshades, like tomatoes, eggplant, or bell peppers?
Hullin, Kapel, and Drinkall do frustratingly say, “[The lithium content] of the tomato will be reported elsewhere.” But they don’t discuss it beyond that, at least not in this paper. We’ll have to look to other sources.
Shacklette et al. report: “Borovik-Romanova reported the Li concentration in [dry material] … tomato, 0.4 [mg/kg].” This is not much, though these numbers are from 1965, and from the USSR.
A stark contrast can be found in one of Anke’s papers, where they state, “Fruits and vegetables supply 1.0 to 7.0 mg Li/kg food DM. Tomatoes are especially rich in Li (7.0 mg Li/kg DM).”
This is a lot for a vegetable fruit! It occurs to us that tomatoes are pretty easy to grow hydroponically, and you could just dose distilled water with a known amount of lithium. If any of you are hydroponic gardeners and want to try this experimentally, let us know!
But tomatoes are obviously beaten out by wolfberries/goji berries, and they also can’t compare to this dark horse nightshade: tobacco.

That’s right — Hullin, Kapel, and Drinkall (1969) also measured lithium levels in tobacco. They seem to have done this not because it’s another nightshade, but because previous research from the 1940s and 1950s had found that lithium concentrations in tobacco were “extraordinarily high”. For their own part, Hullin and co. found (mg/kg in ash):

This is a really interesting finding, and in a crop we didn’t expect people to examine, since tobacco isn’t food.
At the same time, measuring ash is kind of cheating. Everything organic will be burned away in the cigarette or pipe, so the level of any salt or mineral will appear higher than it was in the original substance. As a result, we don’t really know the concentration in the raw tobacco. This is also the lithium that’s left over in the remnants of tobacco after it’s been smoked, so these measurements are really the amount that was left unconsumed, which makes it difficult to know how much might have been inhaled. Even so, the authors think that “the inhalation of ash during smoking could provide a further source of this metal”.
This is also interesting in combination with the fact that people with psychiatric disorders often seem to self-medicate with tobacco. Traditionally schizophrenics are the ones drawn to being heavy smokers, but smoking is disproportionately common in bipolar patients as well. Researchers have generally tried to explain this in terms of nicotine, which we think of as being the active ingredient in tobacco, but given these lithium levels, maybe psychiatric patients smoke so much because they’re self-medicating with the lithium? Or maybe lithium exposure through the lungs causes schizophrenia and bipolar disorder? (For comparison, see Scott Alexander discussing a similar idea.)
We didn’t find measurements for any other nightshades, but we hope to learn more in our own survey.
Animal-Based Foods
Pretty much everything we see suggests that animal products contain more lithium on average than plant-based foods. This makes a lot of general sense because of biomagnification. It also makes particular sense because many food animals consume huge quantities of plant stalks and leaves, and as we’ve just seen, stalks and leaves tend to accumulate more lithium than other parts of the plants.
But the bad news is that, like pretty much everything else, levels in animal products are poorly-documented and we have to rely heavily on Manfred Anke again. He’s a good guy, we just wish — well we wish we had access to his older papers.

Meat
Meat seems to contain a consistently high level of lithium. Apparently based on measurements he took in the 1990s, Anke calculates that meat products contain an average of about 3.2 mg/kg, and he gives a range of 2.4 to 3.8 mg/kg.
In Anke, Arnhold, Schäfer, & Müller (2005) he elaborates just a little, saying, “Poultry, beef, pork and mutton contain lithium concentrations increasing in that order.”
In place of more detailed measurements, Anke, Schäfer, & Arnhold (2003) give us this somewhat difficult paragraph:
On average, eggs, meat, sausage, and fish deliver significantly more lithium per kg of dry matter than most cereal foodstuffs. Eggs, liver, and kidneys of cattle had a mean lithium content of 5 mg/kg. Beef and mutton contain more lithium than poultry meat. Green fodder and silage consumed by cattle and sheep are much richer in lithium than the cereals largely fed to poultry. Sausage and fish contain similar amounts of lithium to meat.
Beyond this, we haven’t found much detail to report. And even Anke can’t keep himself from mentioning how meat plays second fiddle to something else:
… Poultry, beef, pork and mutton contain lithium concentrations increasing in that order. Most lithium is delivered to humans by eggs and milk (> 7000 µg/kg DM).
This is backed up by Hullin, Kapel, and Drinkall (1969), who said:
Among foods of animal origin, those which have been found to contain lithium include eggs (Press, 1941) and milk (Wright & Papish, 1929; Drea, 1934).
So let’s leave meat behind for now and look at the real heavy-hitters.
Dairy
The earliest report we could find for milk was this 1929 Science publication mentioned by Hullin, Kapel, and Drinkall. But papers this old are pretty terse. It’s only about three-quarters of a page, and the only information they give about lithium is that it is included in the “elements not previously identified but now found to be present” in milk.
Anke can do one better, and estimates an average for “Milk, dairy products” of 3.6 mg/kg with a range of 1.1 to 7.5 mg/kg. This suggests that the concentration in dairy products is pretty high across the board, but also that there’s considerable variation.
Anke explains this in a couple ways. First of all, he says that there were, “significant differences between the lithium content of milk”, and he suggests that milk sometimes contained 10 mg/kg in dry matter. This seems to contradict the range he gives above, but whatever.
He also points out that other dairy products contain less lithium. For example, he says that butter is “lithium-poor”, containing only about 1.2 mg/kg dry matter, which seems to be the bottom of the range for dairy. “In contrast to milk,” he says, “curd cheese and other cheeses only retain 20–55% of lithium in the original material available for human nutrition. The main fraction of lithium certainly leaves cheese and curd cheese via the whey.”
This is encouraging because we love cheese and we are glad to know it is not responsible for poisoning our brains — at least, not primarily. It’s also interesting because 20-55% is a pretty big range; we’d love to know if some cheeses concentrate more than others, or if this is just an indication of the wide variance he mentioned earlier in milk. Not that we really need it, but if you have access to the strategic cheese reserve, we’d love to test historical samples to see if lithium levels have been increasing.

What he suggests about whey is also pretty intriguing. Whey is the main byproduct of turning milk into cheese, so if cheese is lower in lithium than milk is, then whey must be higher. Does this mean whey protein is super high in lithium?

Eggs
The oldest paper we could find on lithium in eggs is a Nature publication from 1941 called “Spectrochemical Analysis of Eggs”, and it is half a page of exactly that and nothing else. They do mention lithium in the eggs, but unfortunately the level of detail they give is just: “Potassium and lithium were also present [in the eggs] in fair quantity.”
Anke gives his estimate as always, but this time, it’s a little different:

Anke gives an average (we think; he doesn’t label this column anywhere) of 7.3 mg/kg in eggs. This is a lot, more than any other food category he considers. And instead of giving a range, like he does for every other food category, he gives the standard deviation, which is 6.5 mg/kg.
This is some crazy variation. Does that mean some eggs in his sample contained more than 13.8 mg/kg lithium? That’s only one standard deviation above the average, two standard deviations would be 20.3 mg/kg. A large egg is about 50 g, so at two standard deviations above average, you could be getting 1 mg per egg.
That does seem to be what he’s suggesting. But if we assume the distribution of lithium in eggs is normal, we get negative values quickly, and an egg can’t contain a negative amount of lithium.
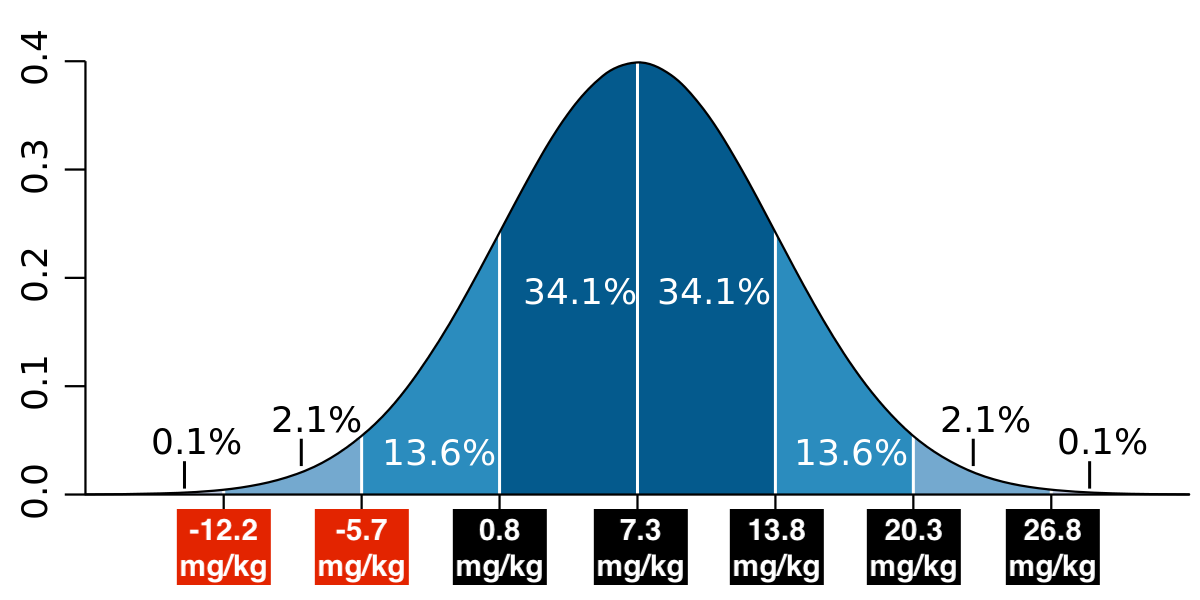
Because lithium concentrations can’t be negative, and because of the distributions we’ve seen in all the previous examples, we assume the distribution of lithium in eggs must be lognormal instead.
A lognormal distribution with parameters [1.7, .76] has a mean and sd of very close to 7.3 and 6.5, so this is a reasonable guess about the underlying distribution of eggs in Germany in 1991.
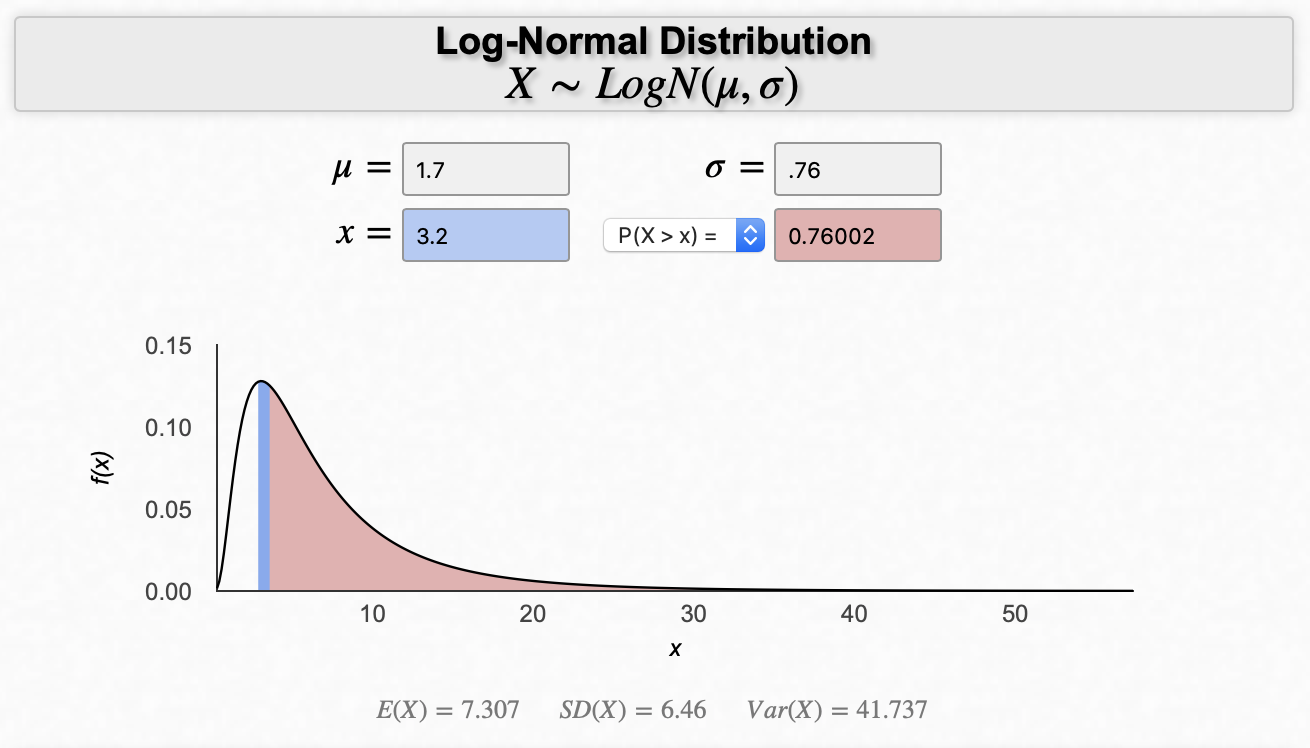
Examination of the lognormal distribution with these parameters suggests that the distribution of lithium in eggs (at least in Germany in 1991) looks something like this: The modal egg in this distribution contains about 3 mg/kg lithium. But about 21% of the eggs in this distribution contain more than 10 mg/kg lithium. About 4% contain more than 20 mg/kg. About 1% contain more than 30 mg/kg. About 0.4% contain more than 40 mg/kg. And two out of every thousand contain 50 mg/kg lithium or more.
That’s a lot of lithium for just one egg. What about the lithium in a three-egg omelette?

To answer this Omelettenproblem, we started by taking samples of three eggs from a lognormal distribution with parameters [1.7, .76]. That gives us the concentration in mg/kg for each egg in the omelette.
Again, a large egg is about 50 grams. In reality a large egg is slightly more, but we’ll use 50 g because some restaurants might use medium eggs, and because it’s a nice round number.
So we multiply each egg’s mg/kg value by .05 (because 50 g out of 1000 g for a kilogram) to get the lithium it contains in mg, and we add the lithium from all three eggs in that sample together for the total amount in the omelette.
We did this 100,000 times, ending up with a sample of 100,000 hypothetical omelettes, and the estimated lithium dose in each. Here’s the distribution of lithium in these three-egg omelettes in mg as a histogram:
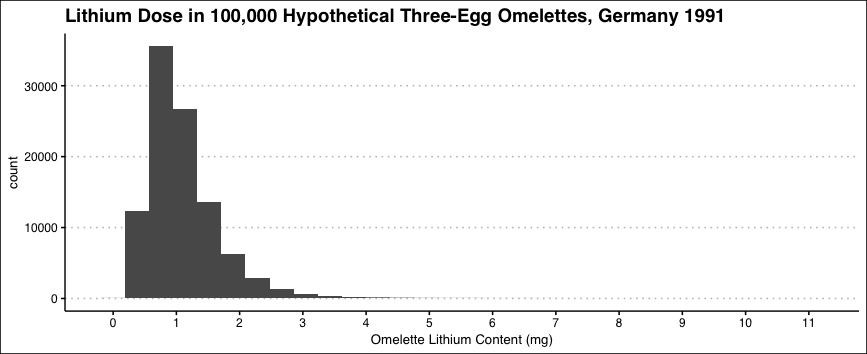
And here it is as a scatterplot in the style of The Economist:
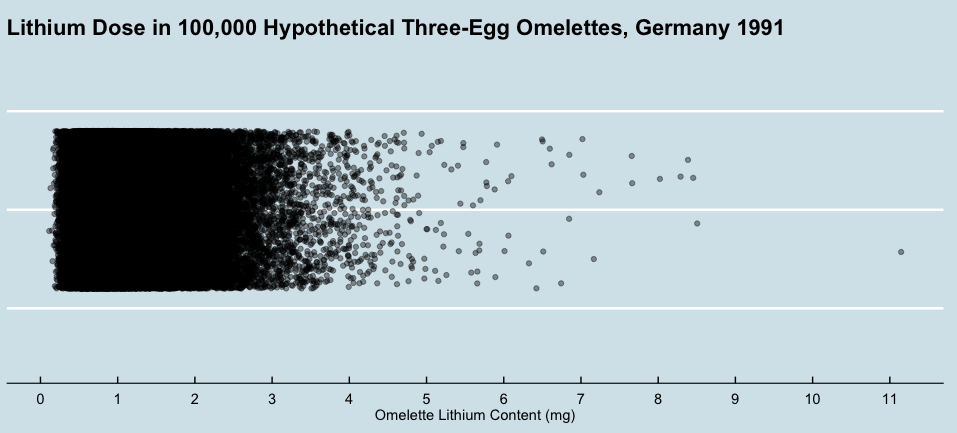
As you can see, most omelettes contained less than 3 mg lithium. In fact, most contained between 0.4 and 1.6 mg.
This doesn’t sound like a lot, but we think it’s pretty crazy. A small clinical dose is something like 30 mg, and it’s nuts to see that you can get easily like 1/10 that dose from a single omelette. Remember that in 1985, the EPA estimated that the daily lithium intake of a 70 kg US adult ranged from 0.650 to 3.1 mg — but by 1991 Germany, you can get that whole dose in a single sitting, from a single dish!
Even Anke estimated that his German participants were getting no more than 3 mg a day from their food. But this model suggests that you can show up at a cafe and say “Kellner, bringen Sie mir bitte ein Omelette” and easily get that 3 mg estimate blown out of the water before lunchtime.
Even this ignores the long tail of the data. The omelettes start to peter out at around 5 mg, but the highest dose we see in this set of 100,000 hypothetical breakfasts was 11.1 mg of lithium in a single omelette.

The population of Germany in 1990 was just under 80 million people. Let’s say that only 1 out of every 100 people orders a three-egg omelette on a given day. This means that every day in early 1990s Germany, about 800,000 people were rolling the dice on an omelette. Let’s further assume that the distribution of omelettes we generated above is correct. If all these things are true, around 8 unlucky people every day in 1990s Germany were getting smacked with 1/3 a clinical dose of lithium out of nowhere. It’s hard to imagine they wouldn’t feel that.
Processed Food
One thing we didn’t see much of in this literature review was measurements of the lithium in processed food.
We’re very interested in seeing if processing increases lithium. But no one seems to have measured the lithium in a hamburger, let alone a twinkie.
There are a few interesting things worth mentioning, however — all from Anke, Schäfer, & Arnhold (2003), of course.
Mostly Anke and co find that processed foods are not extreme outliers. “Ready-to-serve soups with meat and eggs were [rich] in lithium,” they say, “whereas various puddings, macaroni, and vermicelli usually contained < 1 mg lithium/kg dry matter. Bread, cake, and pastries are usually poor sources of lithium. On average, they contained less lithium than wheat flour. The addition of sugar apparently leads to a further reduction of the lithium content in bread, cake, and pastries.”
Even in tasty treats, they don’t find much. We don’t know how processed German chocolate was at the time, but they say, “the lithium content of chocolates, chocolate candies, and sweets amounted to about 0.5 mg/kg dry matter. Cocoa is somewhat richer in lithium. The addition of sugar in chocolates reduces their lithium content.”
The only thing that maybe jumps out as evidence of contamination from processing is what they say about mustard. “Owing to the small amounts used in their application,” they begin, “spices do not contribute much lithium to the diet. It is surprising that mustard is relatively lithium-rich, with 3.4 mg/kg dry matter, whereas mustard seed contains extremely little lithium.” Mustard is generally a mixture of mustard seed, water, vinegar, and not much else. We saw in the section on beverages that wine doesn’t contain much lithium, so vinegar probably doesn’t either. Maybe the lithium exposure comes from processing?
Misc
We notice that for many categories of food, we seem to have simply no information. How much lithium is in tree nuts? Peanuts? Melons? Onions? Various kinds of legumes? How much is in major crops like soy? This is part of why we need to do our own survey, to fill these gaps and run a more systematic search.
It’s interesting, though not surprising, to see such a clear divide between plant and animal foods. In fact, we wonder if this can explain why vegetarian diets seem to lead to a little weight loss and vegan diets seem to lead to a little more, and also why neither of them work great.
Meat seems to contain a lot of lithium, but honestly not that much more than things like tomatoes and goji berries. Vegetarians will consume less lithium when they stop eating meat, but if they compensate for not eating meat by eating more fruit, they might actually be worse off. If they compensate by eating more eggs, or picking up whey protein, they’re definitely worse off!
Vegans have it a little better — just by being vegan, they’ll be cutting out the three most reliable sources of lithium in the general diet. As long as they don’t increase their consumption of goji berries to compensate, their total exposure should go down. Hey, it makes more sense than “not eating dairy products gives you psychic powers because otherwise 90% of your brain is filled with curds and whey.”

But even so, a vegan can get as much lithium as a meat-eater if they consume tons of nightshades, so even a vegan diet is not a sure ticket to lithium removal. Not to mention that we have basically no information on plant-based protein sources (legumes, nuts) so we don’t know how much lithium vegans might get from that part of their diet.
In Conclusion
There’s certainly lithium in our food, sometimes quite a bit of lithium. It seems like most people get at least 1 mg a day from their food, and on many days, there’s a good chance you’ll get more.
That said, most of the studies we’ve looked at are pretty old, and none of them are very systematic. Sources often disagree; sample sizes are small; many common foods haven’t been tested at all. The overall quality is not great. We don’t think any of this data is good enough to draw strong conclusions from. Personally we’re avoiding whey protein and goji berries for right now, but it’s hard to get a sense of what might be a good idea beyond that. So as the next step in this project, we’re gonna do our own survey of the food supply.
The basic plan is pretty simple. We’re going to go out and collect a bunch of foods and beverages from American grocery stores. As best as we can, we will try to get a broad and representative sample of the sorts of foods most people eat on a regular basis, but we’ll also pay extra-close attention to foods that we suspect might contain a lot of lithium. Samples will be artificially digested (if necessary) and their lithium concentration will be measured by ICP-MS. All results will be shared here on the blog.
Luckily, we have already secured funding for the first round of samples, so the survey will proceed apace. If you want to offer additional support, please feel free to contact us — with more funding, we could do a bigger survey and maybe even do it faster. We could also get a greenhouse and run some hydroponic studies maybe.
If you’re interested in getting involved in other ways, here are a few things that would be really helpful:
1. If you would be willing to go out and buy an egg or whatever and mail it in to be tested, so we could get measurements from all over the country / the world, please fill out this form.
2. If you work at the FDA or a major food testing lab or Hood Milk or something, or if you’re a grad student with access to the equipment to test your breakfast for lithium and an inclination to pitch in, contact phil@whylome.org to discuss how you might be able to contribute to this project.

Nice work. Re: eggs, it seems like they note “…much richer in lithium than the cereals largely fed to poultry” do we think that controlling for free-range/not eggs would be productive? Seems like a similar issue might exist for corn-fed/grass-fed beef, though I don’t know which way on the lithium-meter.
LikeLiked by 1 person
No idea but good points, this will be something we’ll keep in mind for our own survey!
LikeLike
If we assume that Reddit is correct and that consuming 5mg or more of lithium induces brain fog, then how many Germans would get brain fog due to their three-egg omelets?
Around 560, by my calculations 🙂
LikeLike
Great article! I’m wondering what the process is for testing something for lithium. Is it expensive and complicated? How much specialized equipment is needed?
LikeLike
It is rather tricky, which is why we plan to outsource it to a lab. Not that expensive in the grand scheme of things but it adds up pretty quickly, something like $40-$50 per sample.
LikeLike
Great Article Guys!
LikeLike
Hey thanks for continuing to push this idea forward, I’ve enjoyed reading the whole series.
I’m still struggling to understand one thing with Food As Lithium Carrier… isn’t most food (at least in the U.S.) shipped in from somewhere else? If the food everyone in Colorado eats is the same as the food people in Mississippi are eating because it’s all shipped from New Jersey (processed) or California (produce/dairy) or whatever, then why the difference in obesity rates? Did I miss somewhere where y’all went into that? Are there any foods that are only local?
I was actually thinking soda, beer, and other drinks might explain things, because I know most bottlers are local to their communities, rather than shipping liquids across the country, but obviously the scant data you found didn’t seem to indicate they were a problem.
LikeLike
Good question! Lots of food is definitely shipped, but that varies widely by the food. Some crops (like oranges and avocados) are pretty localized and have to be shipped everywhere else, but dairy, tomatoes, wheat, potatoes, etc. are all produced all over the US. The food system is really complicated (and not something we currently understand very well) but if you’re living in e.g. California, you’re probably eating a decent amount of food grown in California.
Another way to put it is that someone in Mississippi will be eating food from all over the country, but they’re also eating more food that’s grown in Mississippi than anyone else is.
There may also be some foods that are only/mostly local, but if so we’re not sure what those would be. Milk maybe, some sources suggest it tends to travel no more than a few hundred miles? Bottling was a good guess but yeah at the moment it doesn’t look like it’s most beverages.
LikeLike
The US rules on sending food internationally through the post are incomprehensible to me, due to rather haphazard formatting on this web page (formatting which, in any case, ought not to be relevant, but it seems impossible to understand the rules without considering the formatting): https://www.royalmail.com/sending/international/country-guides/usa I was unable to track down the original source of these rules.
LikeLike
>From Anke, in case anyone can track them down, we’d especially like to see a couple papers from the 1990s.
I just ordered the second one (‘Lithium in the trophic chain: soil-plant-animal-man’) in my local library. I’ll write you when I get it, and if anyone else wants to take a look too, email me at:
pagurus [dot] kulkarnii [at] gmail [dot] com
Thanks for the review, SMTM, and together we will make Anke talk!
LikeLike
Amazing, thank you!
LikeLike
Nightshades tend to be poisonous, or at least the leafy parts, in order to discourage herbivores. On the other hand, the fruit is supposed to be eaten by animals, so is a lot less likely to be so. Ditto for storage tissues, which are underground and aren’t that vulnerable. Therefore the leafy parts of nightshades don’t get eaten and so shouldn’t really be expected to play a large part in the lithium intake. Though that suggests that the Pima should switch to growing potatoes and exporting the stem+leaves…
LikeLike
In regards to the lithium content of whey protein powder, it might be worthwhile talking to the folks at NootropicsDepot. They routinely test for heavy-metal contamination in their ingredients, and they might be able and willing to test a few samples of whey protein powder for lithium.
LikeLike
Maybe test casein protein powder for lithium as well.
If most of the lithium in milk goes with the whey, then the remaining casein may have a lower amount of lithium.
LikeLike
Disclosure: I have switched from whey protein powder to casein protein powder after reading this post.
LikeLike
Psyllium supplementation may reduce absorbtion of lithium:
“… the Linus Pauling Institute also warns that psyllium can reduce absorption of several medications, including lithium, warfarin and carbamazepine, if you take the medications and psyllium at the same time.”
https://www.livestrong.com/article/358623-is-psyllium-husk-used-daily-harmful/
LikeLike
absorption* lol
LikeLike
Lithium and psyllium:
“Psyllium may lower lithium levels in the blood, reducing the effectiveness of this medication. If you are taking both psyllium and lithium, you should take them at least 1 to 2 hours apart, and your doctor should closely monitor your lithium levels.”
https://www.mountsinai.org/health-library/supplement/psyllium
Also, from the same article:
“Obesity: Studies and clinical reports suggest that psyllium may make you feel fuller and reduce hunger cravings.”
LikeLike
Hmm
Psyllium may reduce a chemical**.
Psyllium may reduce hunger.
Might psyllium reduce a chemical hunger?
** (lithium in the blood)
LikeLike
The mention of certain levels of lithium causing fatigue reminds me of a general-audience article I read that mentioned ME/CFS sometimes affecting whole communities. My impression (possibly incorrectly) was that they were talking about geographic communities. This was of interest to me because I have chronic fatigue (although as far as I know my case was not part of a community-level trend.) I can’t find the article again. I remember the mechanism they were proposing for ME/CFS was a bistable metabolic process involving tryptophan where some people could not go back to the more common stable state after experiencing severe stress.
Just wondering whether some subset of ME/CFS cases could be explained by local lithium levels.
LikeLike
Found it.
Quote from Robert Phair: “To me it’s just a matter of logic that predisposing genetic factors for ME/CFS must be common, not rare, in the population. Otherwise you can’t explain the many well-known CFS epidemics like Incline Village and Lyndonville.”
https://www.healthrising.org/blog/2018/04/03/a-metabolic-trap-for-chronic-fatigue-syndrome-me-cfs/
Could local epidemics be explained by contamination rather than (or as well as) genetic factors?
LikeLike
I suggest testing pumpkin seeds (which you aren’t likely to find in a German study). They concentrate a lot of other minerals, much more than other nuts, and so it seems reasonable to wonder if they might also be high in lithium.
LikeLike
Why would lithium intake be lognormal? Is there something multiplicative going on? I would expect a normal distribution here, I would expect everything relevant to be additive…
LikeLike
Your milk data needs some more explaining. The numbers seem to be for “dry matter”. 10mg / kg dry matter sounds like a lot. But it only takes 23g powder to make 1 cup liquid milk serving. Drinking 1-kg-powder’s worth of milk takes heroic efforts. Most people might get only 1mg lithium from 4 cups of milk. So liquid milk, at least, does not seem to be a major lithium source.
Now, if you’re taking whey powder, of course, it could be concerning. And perhaps some American milk have higher lithium levels. More data needed.
LikeLike