
Lithium is an element, atomic number 3. It is a soft, light, highly reactive metal with a variety of uses. Among other things, it’s often found as a trace mineral in drinking water. Small amounts of lithium are naturally present in many water sources, but levels of lithium in American drinking water have been increasing for the past 60 years.
In 1964, the US Department of the Interior published a report called Public water supplies of the 100 largest cities in the United States, which found a median lithium concentration of only 2.0 µg/L in US drinking water. The highest level they recorded was 170 µg/L.
In 2021, the USGS released a report that found a median level in US groundwater of 6.9 µg/L. This is almost four times the median level in the 1960s, but looking at nothing but the average obscures the fact that many people are getting exposed to even more. For comparison, the maximum level they found in groundwater was 1700 µg/L, ten times the maximum recorded in 1964.
The USGS also found that about 45% of public-supply wells and about 37% of domestic-supply wells contain concentrations of lithium “that could present a potential human-health risk per the current EPA guidelines”. Here’s how they describe it in the paper:
Lithium concentrations in untreated groundwater from 1464 public-supply wells and 1676 domestic-supply wells distributed across 33 principal aquifers in the United States were evaluated for spatial variations and possible explanatory factors. Concentrations nationwide ranged from <1 to 396 μg/L (median of 8.1) for public supply wells and <1 to 1700 μg/L (median of 6 μg/L) for domestic supply wells. For context, lithium concentrations were compared to a Health Based Screening Level (HBSL, 10 μg/L) and a drinking-water only threshold (60 μg/L). These thresholds were exceeded in 45% and 9% of samples from public-supply wells and in 37% and 6% from domestic-supply wells, respectively.
Levels in drinking water seem to have increased due to a number of related factors, including the use of drilled wells to tap deeper aquifers, higher levels of fossil fuel prospecting and pollution, and the fact that worldwide lithium extraction and use in industrial applications has increased in general, multiplying the opportunities for accidental exposure and pollution.
Lithium is not currently regulated in drinking water, and water quality reports don’t regularly include it. Most water treatment plants do not track lithium or attempt to reduce it. But the EPA and other government agencies are becoming more concerned about lithium exposure, even at the trace levels found in drinking water:
Just this January, lithium was added to the EPA’s proposed Unregulated Contaminant Monitoring Rule. The Rule is used by the EPA to collect data for contaminants that are suspected to be present in drinking water and that do not have health-based standards set under the Safe Drinking Water Act.
…
Although useful for treating mental health disorders, pharmaceutical use of lithium at all therapeutic dosages can cause adverse health effects—primarily impaired thyroid and kidney function. Presently lithium is not regulated in drinking water in the U.S. The USGS, in collaboration with the EPA, calculated a nonregulatory Health-Based Screening Level (HBSL) for drinking water of 10 micrograms per liter (µg/L) or parts per billion to provide context for evaluating lithium concentrations in groundwater. A second “drinking-water-only” lithium benchmark of 60 µg/L can be used when it is assumed that the only source of lithium exposure is from drinking water (other sources of lithium include eggs, dairy products, and beverages such as soft drinks and beer); this higher benchmark was exceeded in 9% of samples from public-supply wells and in 6% of samples from domestic-supply wells.
Lithium is well-known to have psychoactive effects, which is why lithium salts are often prescribed as a psychiatric medication. In particular, lithium tends to make people less manic and less suicidal. Less charitably, it is sometimes described as a sedative.
But these effects may not always require psychiatric doses. A long-running literature of epidemiological research (meta-analysis, meta-analysis, meta-analysis) suggests that long-term exposure to trace levels of lithium commonly found in drinking water can also have psychiatric effects. Specifically, trace levels in drinking water are often found to be associated with decreased crime, reduced suicide rates, and/or decreased mental hospital admissions.
Finally, here at Slime Mold Time Mold we suspect that lithium exposure may contribute to the obesity epidemic. Lithium often causes weight gain at psychiatric doses, and while there’s no smoking gun yet, there’s some evidence that there might be a connection between long-term trace lithium exposure and obesity. People who are exposed to more lithium, especially at their jobs, tend to be more overweight. Cities with higher rates of obesity tend to have more exposure to lithium. And a group of Native Americans (the Pima) who had unusually high levels of lithium in their water also had unusually high levels of obesity, all the way back in the 1970s. Food levels may also be a possible vector (though it’s complicated).
So people often ask us, how can I get lithium out of my tap water?
For a long time, we weren’t able to answer this question. Until very recently, no one was concerned about lithium levels in drinking water, so there isn’t much research on how to get it out. Heck, back in 2014 the NYT ran an opinion piece arguing that maybe we should start putting lithium in our drinking water. How times have changed.
This is further complicated by the fact that lithium is pretty weird. At an atomic number of only 3, it is the third-lightest and third-smallest element. In some ways it is more like the gasses hydrogen and helium than it is like the metals iron, lead, or mercury, which are much larger and much heavier. This makes it hard to predict whether techniques that can remove other metals would also remove lithium, which is present in solution as an especially tiny ion.
(A favorite “Whoaahhh” fact about Li+ is that it is so small, a bit of electrical energy can make it can creep into the crystal lattices of other compounds and basically just hang out there indefinitely, usually with a bit of swelling of the “host” crystal. It’s kind of like pouring sand into a jar of marbles — lithium is so tiny it can sneak into very small spaces, which is virtually impossible with any other metal ion. The technical term is that it “intercalates” into these materials. Lithium intercalating back and forth between cobalt oxide and graphite, for instance, is the basis of the lithium ion batteries that power virtually every phone and laptop and electric vehicle. There’s an entire field of research focused on making lithium creep into and out of various materials to store energy. People have been trying for a long time to make Na+ do this, since Na+ is so much cheaper and more abundant than Li+, but it’s still way too hard to make any kind of useful battery with an ion as big as Na+.)
To answer the question of how to get lithium out of your drinking water, we set up a project with research nonprofit Whylome to test several commercially-available water filters, the kinds of things you might actually buy for your home, and see how good they are at removing lithium. It’s taken a couple of months of planning, testing, and analysis, but those results are finally ready to share with the world.
This project was funded by generous donations to Whylome from individuals who have asked to remain anonymous. Further support for the research was provided by The Tiny Foundation, which allowed us to expedite several aspects of the research. Special thanks to our funders, Sarah C. Jantzi at the Plasma Chemistry Laboratory at the Center for Applied Isotope Studies UGA for analytical support, and to Whylome for providing general support.
The full report is here, the raw data are here, and the analysis script is here. Those documents give all the technical details. For a more narrative look, read on.
TABLE OF CONTENTS
1. Methods
The basic idea of the study is pretty simple.
You buy a bunch of normal water filtration devices (henceforth “filters”, even though they’re technically not all filters) from a store, like Home Depot, or online, from places like Amazon. Or online from Home Depot.
You spike large quantities of water with specific amounts of lithium, to get water containing known levels of lithium.
Then, you run the lithium-spiked water through the filters and take samples of the water that comes out the other end.
Finally, you submit that water to chemical analysis and find out how much lithium was removed by each of the filters.
This is basically the perfect garage experiment — except that in this case, filters were tested in the laundry room, not in a garage.
1.1 Water Filtration Devices
To get a sense of the different options available on the market, we elected to test three different types of devices: carbon filters (which are what most people think of when they think of at-home filters); reverse osmosis devices; and electric water distillation stills.
We chose devices from brands that most people have heard of, and models that people tend to buy. If you click through the links below, you’ll see that many of these devices are best-sellers.
We settled on the following mix of carbon filters: two pitchers, the Brita UltraMax Filtered Water 18-Cup Pitcher and the PUR Ultimate Filtration Water Filter Pitcher, 7 Cup; three on-tap systems, the Brita 7540545 On Tap Faucet Water Filter, the PUR PLUS Faucet Mount PFM350V, and the Culligan Faucet Mount FM-15A; and two under-sink systems, the Waterdrop 15UA and the Brondell Coral UC300.
We settled on two reverse osmosis devices, the GE GXRQ18NBN Reverse Osmosis Filtration System and the APEC ROES-50 5-stage Reverse Osmosis System.
We also tested two distillation machines, the Megahome 580W Countertop Water Distiller and the Vevor 750W Water Distiller.
Devices were purchased off of Amazon, from the Home Depot, or from their manufacturer, depending on availability. For each device, we also purchased as many extra filters as needed, so that each test could start with clean filters (see the report for more detail).
Carbon Filters — We came into this pretty confident that carbon filters would perform very poorly for lithium removal, despite some nonsense to the contrary floating around the internet (for example, here and here). Carbon has a low affinity for Li+, so we didn’t expect it would pull very much out of the water. Carbon can remove some metals, like lead, by ion exchange — the same principle used in water softeners. But the metals it is good at removing are multivalent (having a charge of +2 or +3 or +4), not +1 like Li+.
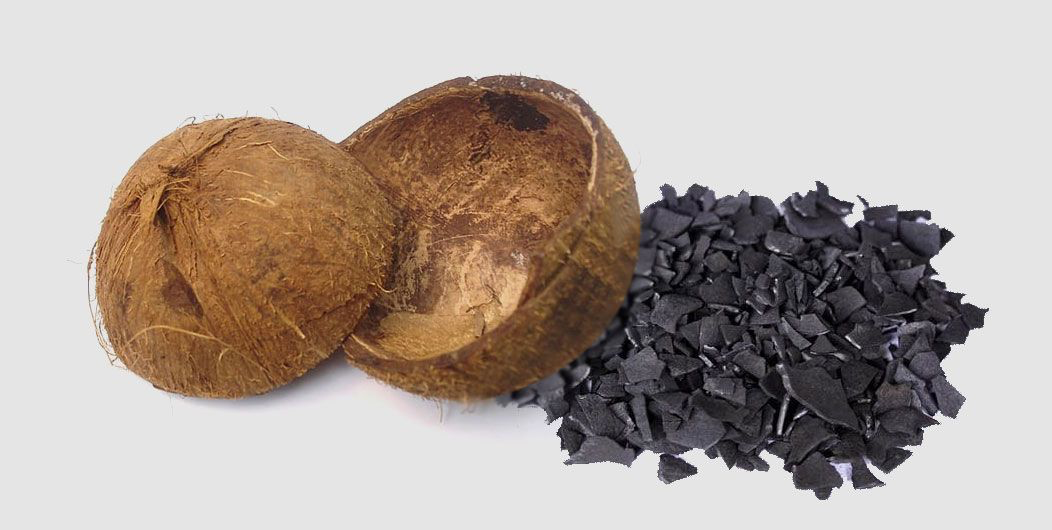
Carbon is also known for having noticeable variation between individual filters, because the carbon in question is made from plant material (often coconut). There will be minor variations in the carbon properties between batches, depending on how fast the coconuts were growing that month and minutiae like that. So we went into this expecting that there might be some differences between different filters, even within the same brand and/or model.
Since we expected that carbon filters would probably all suck based on the mechanism of action, and because we expected that there might be noticeable variation, we decided to test several different brands of carbon filters, in multiple configurations (pitcher, on-tap, and under-sink). This is why we tested so many devices and why we got a relatively wide mix of brands and configurations.
This way, if carbon filters are all equally ineffective, it should be very obvious. But if we’re wrong and they’re great, or some are much better than others, we have a good chance of noticing. Carbon filters are also the cheapest and most commonly used filters, another reason to test more of them.
We expected less variation in the other two kinds of devices, so we decided to test two models of each.
Distillation — We expected that distillation machines would work well, but we didn’t know if that was 80% well, 90% well, or 99.9% well. Lithium salts have zero volatility, so when water evaporates and condenses, the lithium should be left behind. The main risk is that droplets of liquid could get caught in the condenser, which could result in some of the original liquid getting into the clean distillate. So a well-designed distillation machine should perform well, but we didn’t know how reliable or well-designed small at-home countertop models would be.
Reverse Osmosis — We were the most uncertain about reverse osmosis. Reverse osmosis is very good at removing divalent metal ions (like Ca2+ and Mg2+), and pretty effective at removing monovalent metal ions from tap water (like Na+ and K+), but it wasn’t clear if this pattern would extend to lithium. In some ways Na and K are very similar to lithium — all three are present in water as single-charge positive ions, and all three are the same chemical group, the alkali metals. But lithium is much smaller and lighter than other elements. Na has an atomic number of 11, and K has an atomic number of 19, while Li has an atomic number of only 3.
As a result, we weren’t sure if reverse osmosis would be anywhere near as effective at removing lithium as it is at removing these other contaminants. Maybe reverse osmosis would pull lithium out of the water just like any other ion. Maybe it would miss lithium entirely, because the ion is so small. Or maybe something in between. So we went into this expecting that reverse osmosis might be anywhere from 0% to 100% effective.
1.2 Lithium Spiked Water
For realism, we worked with actual American tap water. In this case, we used tap water from the town of Golden, Colorado. Despite the fact that it was indeed part of the Colorado Gold Rush, Golden, CO is not named after the gold rush or even after gold itself; it is named after some guy named Tom Golden.
Samples of the tap water were spiked with known quantities of “ultra dry” lithium chloride salt to create spiked water samples of known lithium concentration.
We ended up testing four concentrations of lithium: 40, 110, 170, and 1500 µg/L Li+. This covers a range from “starts to be concerning” to “around the highest levels reported in US drinking water”. There’s also a bit more history to these numbers, but we’ll talk about that below.
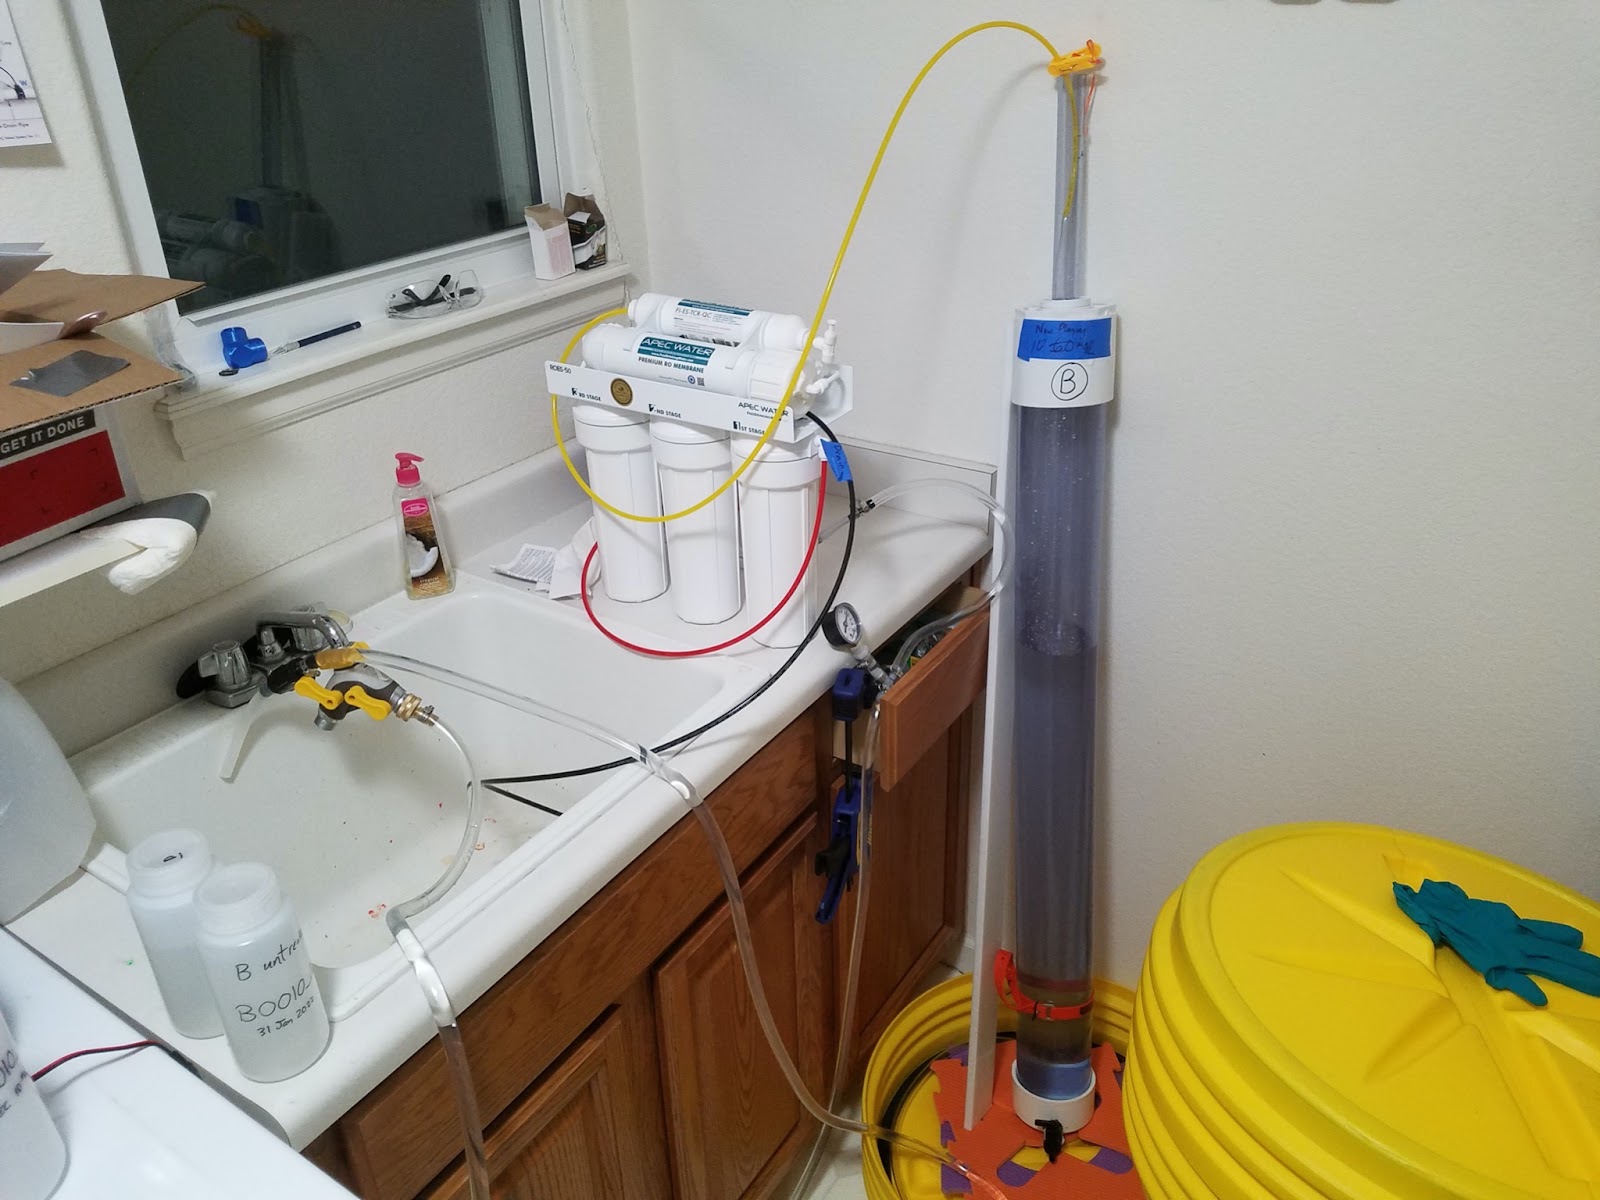
1.3 Testing
Each filter was tested at each concentration, and at two timepoints (realistically these are “volumepoints”, but that’s not really a word). The carbon filters and the RO devices were each tested after 10 liters and after 20 liters. The distillation machines were tested at 2 liters and again at 4 liters, since they take a really long time to run.
The testing setup looked roughly like this:
1.4 Analysis
At the start of the project, we sent the same samples to a couple different testing labs, so we could shop around and compare. All the labs we tried were pretty reliable, but the Plasma Chemistry Laboratory at the Center for Applied Isotope Studies, University of Georgia stood out as the best, so we sent all subsequent samples to them.
Analysis was performed by ICP-OES. The instrument used was a Perkin Elmer 8300 ICP-OES, and the limit of detection was 1 µg/L. All analyses were done in triplicate and were submitted in a random order.
2. Results
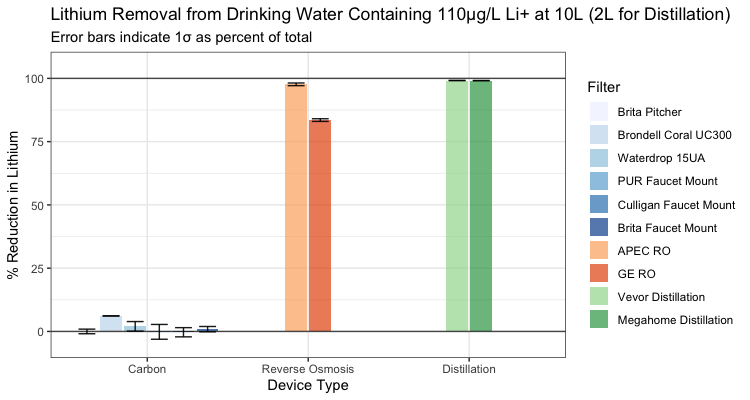
The following figure gives an overview of the results. This figure only includes performance at a concentration of 110 µg/L after the first timepoint (2L for distillation, 10L for the others) but the same general pattern holds across pretty much everything:
2.1 Carbon Filters
Carbon filters are lousy at removing lithium, but probably not 0% effective. Most of the time, water contained slightly less lithium coming out of the filter than it did going in. But the carbon filters didn’t do much, and there wasn’t a huge amount of variation between them.
2.2 Reverse Osmosis
Reverse osmosis was shockingly good at removing lithium. Removal was reliably high for all systems, more than 80% for the GE system and consistently above 95% for the APEC system. The result is unequivocal: reverse osmosis works. Reverse osmosis does not, however, drive these concentrations close to zero. RO is good, but if you start with 100 µg/L in your tap water, you might still end up drinking 10 µg/L even after filtration.
In many cases you do end up with less than 10 µg/L after filtration, but if you start with a high concentration, you are still generally getting more lithium than was in the median American water source in 1964 (2 µg/L). The lower your starting lithium, the lower the lithium concentration you are getting out of your RO filter.
2.3 Distillation
Finally, distillation machines are nearly perfect at removing lithium. Lithium levels after distillation were undetectable (<1 µg/L) in most cases, and removal was still >99.5% for the highest concentration (1500 µg/L). Distillation reliably drives any levels you would expect to see in American tap water below the level of detection.
2.4 Long-Term Reverse Osmosis Test
We also decided to do one long-term test of a single system, to check if it kept performing well over a longer period of time, and to see if anything weird happened. We expected that systems would get slightly worse over time, but there might also be a discontinuity, where a system keeps doing well for a while and then suddenly craps out and does much worse. We wanted to see how much decline happened with more use, and check if there was any discontinuity or sudden point of failure.
Carbon filters don’t work very well even straight out of the box, so obviously we didn’t test one of those. RO doesn’t remove lithium from water quite as well as distillation, but it’s faster, cheaper, and much easier to install. Because RO sits at this sweet spot, we decided to test the GE RO device up to 100 liters.
We tested the GE RO device against a concentration of 170 µg/L, and the device continued to do a good job removing lithium even up to 100 L. Performance went down slightly over time, but not enormously. At 10 L, the device removed about 98% of the lithium in the water, and by 100 L, it removed about 89%. We don’t know how well it would perform beyond 100 L, but this finding suggests it would keep doing pretty well but progressively worse over time.
This would be a good topic for further study — run a few RO devices to 1000 L and see what happens. Alternately, you could install a RO device in the home of someone whose tap water is already high in lithium, test its effectiveness once a month, and get a sense of how these devices would perform in a real-world scenario.
3. Complications
The conclusions from this study are, fortunately, pretty straightforward. But on the way to those conclusions, there were a few complications.
3.1 PUR Pitcher
In addition to the six carbon filters mentioned above, we also tested the “PUR Ultimate Filtration 7-Cup Pitcher”. When we ran it through the same procedure as the other filters, we found there was more lithium in the filtered water than in the original water, at all concentrations. Basically it seemed like the PUR pitcher was adding lithium to the water instead of taking it away.
This was confusing and seemed like it might be wrong, so we tried the same pitcher again with a different set of filters. This time we didn’t get the weird result — lithium levels went down when we ran water through the filter, just like normal.
We’re not totally sure why this happened. One possibility is that some of the water evaporated during testing, but letting the water sit for a few days didn’t make a substantial difference compared to filtering rapidly, so this appears unlikely. Another possibility is that there’s meaningful batch-to-batch variation in the lithium content of the filter cartridges. Activated carbon comes from plants (usually coconuts), so conceivably there could be more lithium in some coconuts than in others. If you got unlucky, the carbon might contain a lot of lithium and you would end up adding lithium to the water instead of taking it away.
In any case, this was strange and inconclusive enough that we ended up removing it from the main analysis, but we’re reporting it here just in case. Good cautionary tale about how even a simple measurement is never simple.
3.2 Concentration Complication
We originally planned to test lithium concentrations of 10, 60, 100, and 1000 µg/L.
The reasoning was that 10 and 60 µg/L were the EPA thresholds of interest, and that testing 100 and 1000 µg/L covered two further orders of magnitude while still being realistic — according to the USGS, 4% of groundwater wells in the US contain more than 100 µg/L lithium, and the maximum recorded contained 1700 µg/L.
But two things happened to screw that up.
First, the tap water in Golden gave us a bit of a surprise. Golden is a city in Colorado, and most tap water in Colorado comes from dazzlingly clean snowmelt. Snowmelt should contain almost no lithium (it’s basically been distilled), so we expected that the tap water in Golden would also contain almost no lithium. This assumption was backed up by water quality reports from nearby Denver, CO, which find no lithium in Denver’s water.
But to our surprise, when we started testing samples, we found that they contained more lithium than we spiked them with. We circled back and tested the unspiked tap water, and found that it contained around 20-25 µg/L, an amount that was reliable across several months. If there are seasonal changes, our January-March sampling window wasn’t big enough to detect them.
The local water treatment plant is fed by Clear Creek, so we collected and tested a sample from the creek about 2 miles upstream from the water treatment plant. The creek there has a concentration of 27 µg/L, very similar to the tap water. It appears that water enters the Golden, CO treatment plant at around 25 µg/L, and the treatment process has very little impact on lithium concentration.
At this point we were questioning our assumptions about water sources, so we collected some local snow and tested that too. The snowmelt had barely detectable lithium, less than or equal to 1 µg/L. This confirms our earlier belief that precipitation is generally very low in lithium (at least in Golden, CO).
If it’s not in the snowmelt, the lithium must be coming from somewhere else. This is speculation, but the Clear Creek watershed does include many abandoned mines, some dating way back to the early gold and silver rushes from the 1800s, and there is at least one Superfund site, so old mine tailings are one possibility (see in particular here). One of the towns upstream (Idaho Springs) has natural hot springs with some geothermal activity, so another possibility is that these springs add lithium to Clear Creek along the way. We didn’t find an obvious link for Idaho Springs, but other hot springs in Colorado definitely brag about the lithium content of their water (Denver Post on Orvis Hot Springs: “The resort’s seven pools are laden with lithium…”), so this seems quite plausible.
This suggests that our original assumptions were mostly correct — snowmelt contains little to no lithium, so most drinking water in Colorado should be quite pure. But in this specific case, looking at water drawn from Clear Creek, we ended up with more than we expected. Water coming from one of Colorado’s snowmelt reservoirs, rather from a well or stream, would probably contain a lot less.
In the end, the lithium levels in Golden’s tap water raised the lithium level of all of our samples by about 25 µg/L. We were already halfway through testing when we discovered this, so we decided to continue with these slightly higher concentrations. If anything, it’s a stricter test of the filters.

Second, the lithium salt we used was substantially more potent than the stated strength (i.e. much stronger than expected), which also increased the concentrations we tested.
We used lithium chloride from Fisher Scientific as the lithium spike for all our samples. According to the certificate of analysis, the salt contained a lot of water. But apparently this was not the case. As far as we can tell, the salt appears to have very little water content, so it contains a lot more lithium per weight than expected (about 30% stronger than expected). This caused us to underestimate the amount of lithium in the salt, and as a result, we added more than we meant to. This is why we ended up testing up to 1500 µg/L.
Again, we were already halfway through testing when we discovered this, and decided to forge ahead. Because this error was propagated across all the samples we had submitted, the analysis was still internally consistent. Even though these weren’t the numbers we had set out to study, it doesn’t really matter. Those numbers were arbitrary to begin with; we chose them because we live in a base-10 world. We were still able to compare between filters at realistic concentrations.
Together, these two factors inflated the concentrations we tested, from 10, 60, 100, and 1000 µg/L to 40, 110, 170, and 1500 µg/L. First, the tap water from Golden added 25 µg/L to all the samples. Then, the unusually dry lithium salt inflated the amount added to each sample by around 30%.
Fortunately, this does not seriously impact our results. Filters were consistent across all concentrations, and in the end we covered a very similar range, 60-1500 µg/L instead of 10-1000 µg/L. We’re only really missing an analysis of how well the filters would work at low levels, around 10 µg/L. But RO devices that drive 40 µg/L to around 1 µg/L can also be expected to drive 10 µg/L way down low.
The only thing we would want to revisit in future studies is to test carbon filters at levels close to 10 µg/L; but our best bet is that they don’t do much at those levels either.
3.3 Doubles
We also caught one other problem. During analysis, we found that we made a mistake when mixing four of the concentrations. Twice as much lithium chloride as intended was added to the solutions for the PUR faucet mount at concentrations of 110 and 170 µg/L, and also for the Culligan faucet mount at 110 and 170 µg/L. As a result, these two filters were actually tested against ~210 µg/L and ~325 µg/L instead of the intended 110 and 170 µg/L. You can easily see this error if you look at the tables in the report.
This is unfortunate and does complicate the data, but again it doesn’t seriously change the conclusions. Carbon filters don’t get much lithium out of tap water at any concentration, whether it’s 110, 170, 210, or 325 µg/L. There’s no reason to expect that the PUR and Cullighan faucet mounts would perform differently at these concentrations than at the intended ones — these results fit the overall result, which is that carbon filters aren’t good at removing lithium.
3.4 Why’d You Have To Go And Make Things So Complicated?
You may not be used to seeing scientific papers talk about mistakes the research team made, or the incorrect assumptions that showed up halfway through the project, or the weird random anomaly that doesn’t have an easy explanation. But the truth is that this is just what research looks like.
Academic researchers are expected to pretend like everything went perfectly and nothing weird happened, but this is not how actual research projects work. In real projects, especially where you’re trying to advance the frontiers of knowledge, you have to take chances, make mistakes, and yes, even get messy.

There are always going to be some accidents in any research project, and instead of sweeping them under the rug and pretending we never make mistakes, we’re going to talk about them. This not only is virtuous, it also puts you (readers) in a better position to form your own opinion about our results. It gives you a better sense of what to expect if you want to replicate or extend our results. And if we didn’t tell you about all the SNAFUs, we’d be giving you the wrong idea about what research is really like.
And of course, it’s possible there are other mistakes we haven’t caught yet! We know that the best way to troubleshoot is to get as many eyes on the project as possible, which is why we put all our data and code online for you to see.
Obviously we want to avoid mistakes when we can, which is why we use techniques like randomizing sample order and including control samples to help prevent and diagnose mistakes. But this sort of thing happens, and it’s in everyone’s best interest to just publicly say “whoops, our bad”.
4. Conclusions
If you have the time and money, distillation is the best way to get lithium out of your water. The catch is that distillation is slow: distillation machines usually run at less than 1 liter per hour, a small fraction of the speed of other devices, and consume a lot of energy to get there. Distilling all of your cooking and drinking water with one of these machines would be very slow or very expensive or both.
For the average consumer, reverse osmosis is a much better choice. It’s cheaper and faster, and it works nearly as well as distillation does. For the average American, a RO system will ensure that you end up with less than 10 µg/L in your water, probably much less.
Both of the RO systems we tested were under-sink units, meaning they go under your sink (duh) and create a stream of purified water that is separate from the actual tap. That way you wash your dishes with the high flow rate you’re accustomed to from a faucet, but fill your glass or make pasta with the separate stream of RO-filtered water.
You could also spring for a professional-grade household system that filters all the water that comes into your house, but there are a few complications. First off, while it should work basically the same as these under-sink units, we didn’t actually test a household system. Second, it’s got a much higher upfront cost and it would be more of a pain to install and maintain. Also keep in mind that typically only 20-50% of the water entering the RO unit actually leaves as clean, filtered water; the rest never makes it through the filter membrane and goes down the drain. Throwing away that much water for things like showering or washing your car would mean a lot of wasted water.
Finally, a whole-house RO system typically needs to be accompanied by a water softener, and we’re not sure if water softeners contain lithium or not. Water softeners operate by ion exchange, exchanging one Ca2+ or Mg2+ ion for two Na+ ions. You “regenerate” the system every so often by dumping a big bag of rock salt (NaCl or occasionally KCl) into the “brine tank”, which displaces the Ca/Mg off of the ion exchanger. If the salt being used for regeneration contains lithium, it would make its way into the drinking water just as readily as Na+. We haven’t tested any water-softening salt yet (though we might at some point), but we did test table salt as part of another project, and that definitely contains some lithium.
Because of this, it’s not clear whether you’d end up drinking more or less lithium if you install a household RO system with a water softener. If you’re using a water softener without a RO system, you’re probably adding some lithium to your water, though we’re not sure how much.
If you purchase water that was treated by RO or distillation (as many bottled waters are), it’s probably very low in lithium. But the catch here is that many companies put minerals back in, because pure water actually tastes kind of flat and metallic. Aquafina, for example, is first purified through RO before putting a pinch of salt back in for taste. If the pinch of salt contains lithium, you’re back to square one.
Thanks again to our anonymous donors, the Tiny Foundation, Sarah Jantzi, and Whylome for supporting this research. Finally, thank you for reading!

I wish you tested gravity ceramic filters like ProOne or Berkey. They’re probably cheaper than RO and reasonable to integrate into your lifestyle.
>
LikeLiked by 1 person
I had the same thought, as I use a Berkey. On Berkey’s FAQ page?
Q: Does the Berkey water filter remove lithium?
A: No. It is our understanding that Lithium is a mineral. The Black Berkey Purification Elements do NOT remove minerals.
LikeLike
Here’s something interesting that I found while searching for the lithium levels in London, England water:
https://duckduckgo.com/?t=ffsb&q=lithium+level+for+water+in+london+england&atb=v224-1&ia=web
Lithium as a suicide reduction strategy. Now isn’t that interesting, for meaning of interesting that’s disturbing.
LikeLike
Could you please test 10 20 popular water bottled companies since most people get their drinking water that way. It seems your above tests will be impossible to imply in high drought states like California where I live.
LikeLike
Very cool! Always happy to see a new lithium-related article from SMTM 🙂
You mentioned that “At 10 L, the [RO] device removed about 98% of the lithium in the water, and by 100 L, it removed about 89%”.
If that trend continues, then RO (reverse osmosis) filters lose 1% of efficiency for every 10L of water that they process.
Let’s say that a family of 3 uses 5 liters of filtered water a day for drinking and cooking. At that rate, after 90 days, the filter will only be 53% effective.
If a family of 4 uses 8 liters of filtered water a day, then it would only take 60 days for the filter to become only 50% effectiveness.
With those rates, I think people would need to swap out their RO filters almost monthly in order to effectively reduce lithium.
I wonder how often the filter manufacturers recommend that the filters be swapped out 🙂 (And I wonder how many people follow that advice, haha)
LikeLike
6 months according to their manuals.
LikeLiked by 1 person
How about a 30 day experiment with distilled water from the store? It’s very cheap, about $1-2 per gallon. Most big grocery chains carry it for preparing baby formula or use in irons and other devices. They even deliver so you don’t have to carry all that weight!
For the record, I just did such an experiment and I lost exactly 0lbs 😦 But I also didn’t lose on the potato experiment, so I think it would still be interesting for more people to do it.
I didn’t get any negative side effects from drinking only distilled water for 30 days besides a calf cramp once or twice.
LikeLiked by 1 person
We might try this at some point, but we want to get a sense of how much lithium is in food first just in case!
LikeLiked by 2 people
One concern about actually using an RO system that the membranes are often made with a polysulfone support layer which is often plasticized with BPA, a potential endocrine disruptor. Other RO systems are made with cellulose acetate which I don’t think is a potential endocrine disruptor, but it’s hard to know which membranes use which support layers. The functional layer is typically going to be a polyamide which I also don’t think is a concern, although I’m very unsure about that.
LikeLike
I would have liked for the ZeroWater pitcher to be tested, too, as that’s what I have. Its water really does test at zero on Total Dissolved Solids meters (the only one I know of that is so effective), though I don’t know whether lithium is one of the dissolved solids they detect.
LikeLiked by 1 person
https://www.zerowater.eu/zerowater-tested/
Lithium is not listed on this chart.
LikeLike
Hi, I have been reading your blog for a while and think it is highly interesting! I am however wondering why aren’t you publishing your studies in academic journals subjecting them to academic peer-review? Meticulously conducted studies one would imagine were eligible for publication and that way they would be received as legitimate sources to cite =)
LikeLike
Hi! It’s because we don’t like journals and we think that peer review is a big drag. Journals were helpful when it was hard to get access to a printing press but now that we have the internet they seem pretty obsolete. Our friend Adam wrote a good explainer about the problems with peer review here: https://www.experimental-history.com/p/the-rise-and-fall-of-peer-review
Everything we write is a legitimate source to cite, please feel free to cite our work! 🙂
LikeLike
Once I realized lithium occurs naturally in water I understood: it’s supposed to be there. Once I read places with higher concentrations have less suicide and violence, I realized: it’s necessary to human health. Once I realized lithium is filtered out of water by RO/purification filters/bottled water filters, I understood: we’re hurting ourselves by “decontaminating” our water.
I spent 3-4 years drinking water from a whole home filtration source. As a renter, I didn’t understand that the system was filtering out important nutrients like magnesium, lithium, etc. My fingers looked like prunes even though I was drinking 80 ounces of water a day. I was suddenly anxious and experiencing cognitive difficulties in my mid 30s! My Vitamin B12 had dropped to a paltry 360 ng/mL. (Lithium plays a role in B12 transport. And B12 affects your mood.)
Once I understood there was a problem, I moved, made changes to my diet, and started supplementing. – And started feeling better.
But I wasn’t back to normal until I added lose dose “nutritional” lithium to my supplement regimen.
I can’t wrap my mind around how we fail to understand that if a trace element is in water naturally, then it’s needed by the body. I can’t understand how anyone can poo poo research showing a link between psychological health and naturally occuring lithium, such as the study referred to above!
YES, you have to be careful, too much lithium IS harmful. But it’s dangerous and irresponsible to act as if lithium isn’t supposed to be in our water, at all.
LikeLike