
1. Introduction
How much lithium is in your food? Turns out this is harder to answer than you might think.
You might be interested in this question because clinical doses of lithium (50-300 mg/day) are a powerful sedative with lots of nasty side effects. Many of these side effects also show up in people taking subclinical doses (1-50 mg/day). Even trace doses (< 1 mg/day) seem to have some effects. And the EPA is concerned about exposure to levels as low as 0.01 mg/L and 0.06 mg/L.
There are lots of different methods you can use to estimate the lithium in a sample of food. This usually involves some kind of chemical liquefication (“digestion” in the parlance) paired with a tool for elemental analysis. You need digestion to analyze food samples, because some analysis techniques can only be performed on liquids, and as you may know, many foods are solids or gels. Mmmmm, gels. *HOMER SIMPSON NOISES*
Most modern studies use ICP-MS for analysis of metals like lithium, combined with digestion by nitric acid (HNO3). ICP-MS is preferred because it can analyze many elements at once and it is considered to be especially sensitive. HNO3 is preferred because it is fast and cheap compared to alternatives.
Studies that use HNO3 digestion with ICP-MS tend to find no more than trace levels of lithium in their food samples — only about 0.1 mg/kg lithium in most foods, and no foods above 0.5 mg/kg. Examples of these studies include Ysart et al. (1999), which surveyed 30 elements in a wide variety of UK foods and found no more than 0.06 mg/kg lithium in any food; Saribal (2019), which measured the levels of 19 elements in cow’s milk samples from supermarkets in Istanbul, and found less than 0.04 mg/L lithium in all samples; and Noël et al (2006) which surveyed the levels of 9 elements in “1319 samples of foods typically consumed by the French population”, finding 0.154 mg/kg or less lithium in all foods (though they reported slightly higher amounts in water).
But as we’ve reviewed in previous posts, the literature as a whole is split. Studies that use other analysis techniques like ICP-OES or AAS, and/or use different acids like H2SO4 or HCl for their digestion, often find more than 1 mg/kg in various foods, with some foods breaking 10 mg/kg. Examples include studies like Ammari et al. (2011), which found 4.6 mg/kg lithium in spinach grown in the Jordan Valley; Anke, Arnhold, Schäfer, and Müller (1995) which found more than 1 mg/kg lithium in many German foods, including 7.3 mg/kg lithium in eggs; and in particular we want to mention again Sievers & Cannon (1973), which found up to 1,120 mg/kg lithium in wolfberries (a type of goji berry) growing in the Gila River Valley.
1.1 State of the Art Isn’t Great
From the existing literature alone, it’s hard to say what concentrations are present in today’s food. Different papers give very different answers, and often seem to contradict each other. It’s hard to get oriented.
We don’t want to give the impression that there’s a consensus to be boldly defied, or that there are two opposing camps. It’s more like this: hardly anyone has even tried to do a decent job of even looking for lithium in food or taking it seriously, and we are here to smack them and tell them to pay attention to something that has been ignored. This is not a well-studied question. It is a subject that has been the topic of few papers and even fewer authors. It is a small literature and very confused.
Hardly anyone can even be bothered to look for lithium. When it does appear in a study, half the time it feels just tacked on to a list of things that the authors actually care about (like in the France study above). Many of these studies are really looking for toxic metals like lead and cadmium, which are obviously important things to check for in our food. But this makes lithium an afterthought. And when authors don’t care, fundamental issues of analysis can easily be overlooked. The assumption seems to be that you can just throw everything into the same machine and get a good measurement for every element without any extra effort. But as we’ll see in a moment, that may not be the case.
As we hinted at above, the analytical methods may be the root of the problem. Studies that use HNO3 digestion with ICP-MS report minor trace levels of lithium in food. Studies that use other forms of digestion or other analytical techniques report much higher levels, often above 1 mg/kg. This makes us think that the different analyses are the reason why these papers get such different estimates. However, we couldn’t find any head-to-head comparisons in the literature, and it isn’t clear if the problem lies with ICP-MS, HNO3 digestion, or both.
1.2 Effects of Lithium
This is more than a purely academic question: lithium is psychoactive, and exposure through our food could have real health effects.
Clinical doses, which usually range between 56 mg and 336 mg elemental lithium per day, act as a mood stabilizer and sedative. These doses also cause all kinds of nonspecific adverse effects, including confusion, constipation, headache, nausea, weakness, and dry mouth.
Some people take subclinical doses of lithium (usually 1-20 mg or so), and when we went on r/Nootropics and asked people what effects and side-effects they experienced taking doses in this range, people reported a whole bundle, the 10 most common being: increased calm, improved mood, improved sleep, increased clarity / focus, brain fog, “confusion, poor memory, or lack of awareness”, increased thirst, frequent urination, decreased libido, and fatigue.
Even the trace amounts of lithium in our drinking water (< 1 mg/L) may have some effects. A epidemiological literature with roots dating back to the 1970s (meta-analysis, meta-analysis, meta-analysis) suggests that long-term exposure to trace levels of lithium in drinking water decreases crime, reduces suicide rates, reduces rates of dementia, and decreases mental hospital admissions, and this is supported by at least one RCT. The EPA is even concerned about exposure to levels as low as 0.01 mg/L and 0.06 mg/L, describing them as “concentrations of lithium that could present a potential human-health risk”, though they don’t say why.
1.3 Measurement
Trusting your methods is the basis of all empirical work. The disagreement in the existing literature is important because we don’t have a good sense of how much lithium is in our food. It’s concerning because it suggests we might not know how to measure lithium in our food even when we try! This looks like a crisis of methods either way.
High enough levels of lithium in our foods would be dangerous, so we should know how to take a piece of food and figure out how much lithium is inside it. But there isn’t much research on this topic, and it looks like different methods may give very different answers — if this is true, then we don’t know how to accurately test foods for lithium. And it’s likely that lithium levels in the environment are increasing due to both lithium production and fossil fuel prospecting — see Appendix B for more.
As an analogy, we should know how to measure mercury levels in fish in case it’s ever a problem — our chemists should be able to check fish samples periodically and get a good estimate of the mercury levels, an estimate we feel we can rely on. Because if we can’t measure it, then we don’t know if it’s a problem. High levels could slip by undetected if our methods aren’t right for the job.
1.4 Head-to-Head
Before we can really figure out how much lithium there is in food, we need to find analytical methods that have our full confidence. And the simplest way to test our methods is a head-to-head comparison.
This seemed easy enough, so we set up a project with research nonprofit Whylome to put a set of foods through different digestions and put the resulting slurries in different machines, and see if they give different answers. By comparing different digestions and analytical methods on a standard set of food samples, we should be able to see if different techniques lead to systematically different results.
Based on the patterns we saw in the literature, we decided to compare two analysis techniques (ICP-MS and ICP-OES) and three methods of digestion (nitric acid, hydrochloric acid, and dry ashing). Details about these techniques are in the technical report, and in the methods section below.
We originally wanted to compare more analysis techniques (AAS, flame photometry, and flame emission methods) but weren’t able to find a lab that offered these techniques – they are somewhat oldschool and not in common use today. More on this below.
It turned out that the type of analysis didn’t make much difference, but the way in which samples were digested for analysis was surprisingly impactful. And the technique that’s most commonly used today seems to underestimate lithium, at least compared to alternatives.
This project was funded by a generous donation to Whylome from an individual who has asked to remain anonymous. General support for Whylome in this period was provided by the Centre For Effective Altruism and the Survival and Flourishing Fund.
Special thanks to all the funders, Sarah C. Jantzi at the Plasma Chemistry Laboratory at the Center for Applied Isotope Studies UGA for analytical support, and to Whylome for providing general support.
The technical report is here, the raw data are here, and the analysis script is here. Those documents give all the technical details. For a more narrative look at the project, read on.
2. Methods
The basic idea is to test a couple different analytic approaches on a short list of diverse foods.
Most modern analyses use either ICP-MS or ICP-OES. Some of these papers find low concentrations of lithium in food; some of them find high concentrations. We wanted to compare these two techniques to see if they might be the cause of the differences in measurements.
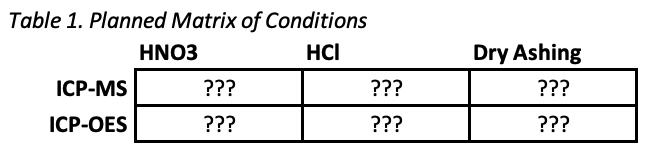
Based on what we had seen in the literature, we decided to compare two analysis techniques (ICP-MS and ICP-OES) and three methods of digestion (nitric acid, hydrochloric acid, and dry ashing), fully crossed, for a total of six conditions.
2.1 Food
As this is our first round of testing, we wanted a diverse set of foods that could give us some sense of the American food environment in general. Therefore we were looking for a mix of foods that were animal-based and plant-based, highly-processed and unprocessed, a mix of fruits, vegetables, dairy, carbs, and meats. We also made sure to include some foods that previous literature had suggested could be extremely high in lithium (like eggs and goji berries), to see if we could confirm those results. Twinkies made the cut because they’re highly processed and highly funny.
In the end, we settled on the following list:
- Milk
- Carrots
- Eggs
- Ketchup
- Spinach
- Corn syrup
- Goji berries
- Twinkies
- Ground beef
- Whey powder
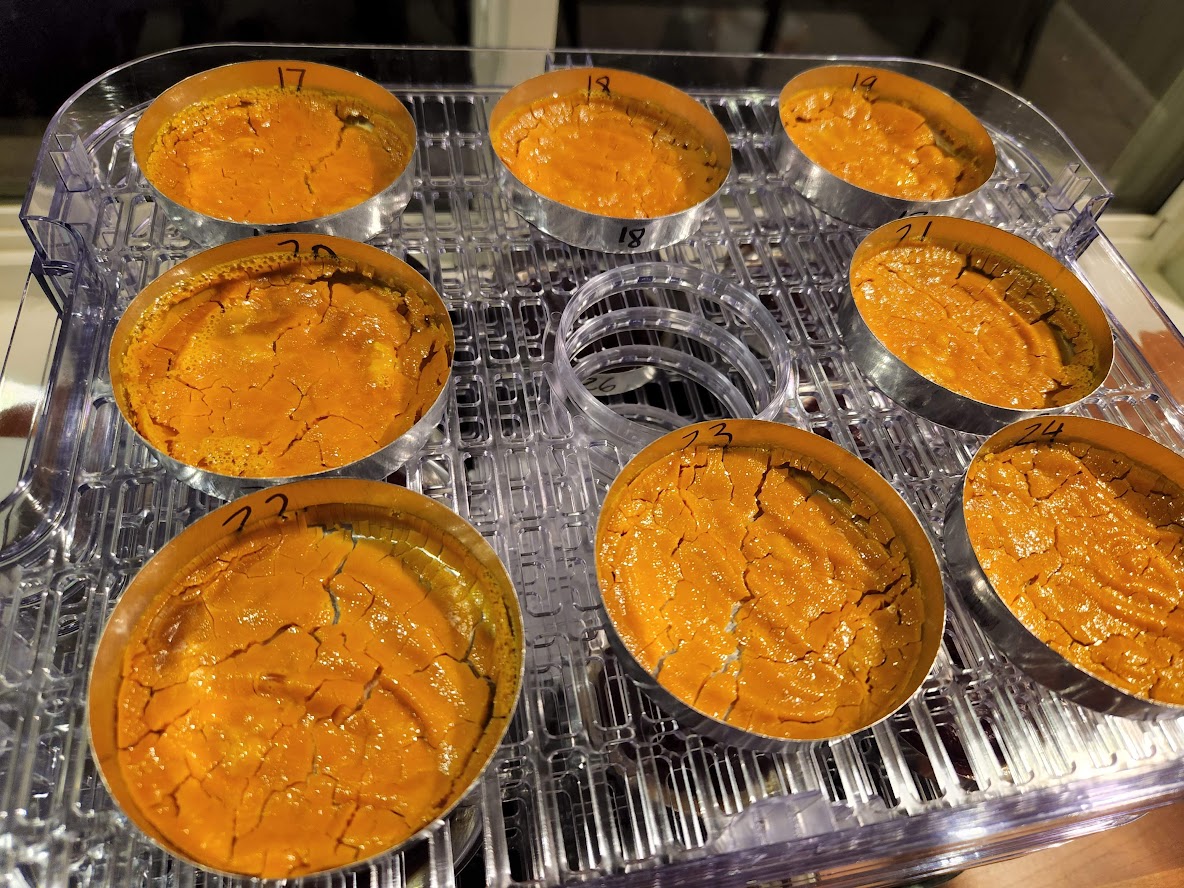
All foods were purchased in August of 2022 at grocery stores around Golden, Colorado. Foods were immediately dried, blended, and divided into tubes for further processing, with weight measurements taken at each step of the process.
For example, this is how we prepared the eggs. A carton of twelve eggs were cracked into a stick blender, and blended until well-mixed. A subset of the resulting egg blend was then dehydrated, enough to produce all of the needed material with some to spare. The dried egg (more like flakes at this point) was crushed and mixed well. All samples were taken from this egg powder. Three samples each were submitted to every method of analysis, so every result is an estimate of the concentration of the target element averaged across the whole carton. Put another way, our sample size was one (1) carton of eggs, not 12 eggs separately. As the egg blend was well-mixed, all samples should in principle have the same concentration of elements, suggesting that any variation between samples is the result of analytic noise rather than variation between different eggs or different cartons.
The member of the team who prepared the samples had this to say:
Making a “Twinkie puree” out of a bowl of twinkies, and then precisely weighing it out into drying trays and placing it in a dehydrator, is probably the strangest thing I have ever done in the name of science. My trusty stick blender really struggled with twinkies, and I had to take a pause because the overworked motor started to make a burning smell. “Twinkiepuree” has unusual visco-elastic properties which make it worth the effort.

Samples were analyzed in triplicate, and each replicate was done entirely separate (its own digestion and its own analysis of the resulting post-digestion solution). Order was randomized, to minimize the risk of “carry-over” from one analysis to the next.
2.2 Digestion
In the literature, most analyses that found low levels of lithium used digestion by nitric acid. To see if this might be the cause of the differences in results, we decided to compare nitric acid digestion to some other digestion approaches. In the end we settled on two other kinds of digestion: 1) digestion with hydrochloric acid, and 2) “dry ashing”, where samples are burned at high temperatures, then the ash is dissolved in nitric acid.
Dry ashing is a good complement to these acid digestion techniques because while oily foods are very chemically resistant to oxidizers, they are also very flammable. Greasy foods full of hydrocarbon chains that may not perfectly come apart in an acid are likely to be fully broken down by incineration. Incineration causes organic compounds to exit the sample as CO2 gas, but elements like sodium, potassium, magnesium, and lithium are non-volatile and remain behind in the ash.
2.3 Analysis
Both ICP-MS or ICP-OES generate a tiny cloud of high-energy plasma, the “inductively-coupled plasma” of the acronym. And both methods inject a cloud of liquid droplets into that plasma. The difference is that ICP-OES examines the light that is emitted by the plasma as the liquid sample hits it, while ICP-MS examines the actual particles of matter (ions) that are emitted by the plasma as the sample hits it, by directing those ions towards a sensor.
3. Results
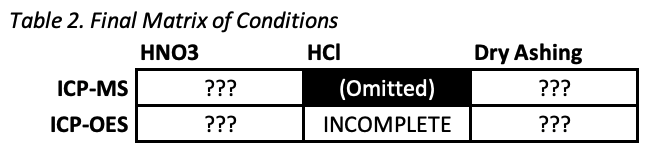
The first surprise was that hydrochloric acid digestion visibly failed to digest 6 of the 10 foods. Digestions were clearly incomplete and significant solid matter was still visible after the procedure. The 6 foods were carrots, ketchup, spinach, corn syrup, goji berries, and twinkies. This is an interesting mix since it includes fibrous, sugary, and oily foods, so there’s no obvious trend as to what worked and what didn’t.
Without complete digestion, the measurements we got from ICP-OES couldn’t be expected to be at all accurate. So while we have these results, they probably aren’t meaningful, and we discontinued hydrochloric acid digestion for all other samples.
The main results are all ten foods in four conditions: ICP-MS after HNO3 digestion, ICP-OES after HNO3 digestion, ICP-MS after dry ashing, and ICP-OES after dry ashing.
Little difference was found between the results given by ICP-MS and ICP-OES, other than the fact that (as expected) ICP-MS is more sensitive to detecting low levels of lithium. However, a large difference was found between the results given by HNO3 digestion and dry ashing.
In samples digested in HNO3, both ICP-MS and ICP-OES analysis mostly reported that concentrations of lithium were below the limit of detection. The highest numbers given by this technique were in spinach, which was found to contain about 0.2-0.3 mg/kg lithium, and goji berries, which ICP-MS found to contain up to 1.2 mg/kg lithium.
In comparison, all dry ashed samples when analyzed by both ICP-MS and ICP-OES were found to contain levels of lithium above the limit of detection. Some of these levels were quite low — for example, carrots were found to contain only about 0.1-0.5 mg/kg lithium. But other levels were found to be relatively high. The four foods with the highest concentrations of lithium, at least per these analysis methods, were ground beef (up to 5.8 mg/kg lithium), corn syrup (up to 8.1 mg/kg lithium), goji berries (up to 14.8 mg/kg lithium), and eggs (up to 15.8 mg/kg lithium).
These results are summarized in greater detail in the technical report, and in this figure:

4. Which technique is more accurate?
We think that dry ashing (which gives the higher estimates for lithium) is probably more accurate, and here are some reasons why.
Reason #1: Many water samples contain some lithium, and some water samples contain a lot of lithium — sometimes more than 1 mg/L, and occasionally a lot more than 1 mg/L. Unlike food samples, water samples require no digestion, so measurements of water samples are probably quite accurate.
Most food is grown using water and contains some water [CITATION NEEDED]. It would be strange if food, which is made out of water (plus some other things) always contained less lithium than the water it is made out of. More likely, there’s something else that can interfere with the analysis when foods aren’t completely digested.
Reason #2: The analysis lab we used has a “buy one element, get one free” deal, so for all of the foods we submitted, we requested sodium analysis (Na+) on top of the lithium (Li+). We figured, why not, it doesn’t cost any extra.
If there were something unusual about the lithium analysis, you’d expect sodium to behave differently. Specifically, you’d expect each analytical method to find similar levels of sodium in every food. So we compiled the sodium data and ran the same analysis as lithium. And sure enough, it does. Here’s a comparison of the results for lithium and sodium:

(Note that the y axes are different scales. There is way less lithium than sodium in these foods, so when analyzing lithium we are much closer to the limits of quantitation.)
If you were validating the equivalence of sample prep procedures based on Na+, you’d say “looks good, great agreement between ashing and HNO3 digestion.” This isn’t at all true for Li+. Why? We have no idea. But it further supports the suspicion that Li+ is more slippery for some reason, an excellent comparison that highlights just how strange the lithium results are.
This also seems to rule out various “operator error” explanations. If someone were dropping vials or putting them in the machine backwards or something, you would see weird patterns for both lithium and sodium results. The fact that the sodium results look totally normal suggests that something weird is happening for lithium in particular.
Reason #3: Imagine taking pictures with a camera. If you point the camera at something dark, the resulting picture comes out dark. If you point it at something bright, the resulting picture comes out bright. This is a good sign that the camera is working as intended, and that you’re operating it correctly. If your pictures always come out dark, something is probably wrong. Maybe you forgot to take off the lens cap.
We see something similar in these data. Dry ashing sometimes gives low measurements, like in milk and carrots, which it always found to contain less than 0.6 mg/kg lithium. Dry ashing sometimes gives high measurements, like in eggs and goji berries. There’s a lot of noise, but we know that it can produce numbers both large and small.
In comparison, HNO3 digestion always gives tiny numbers. Most of the time it finds that lithium levels are below the limit of detection. When it does seem to detect an actual amount of lithium, the levels are always low, never above 1.2 mg/kg. These numbers look less like actual estimates and more like a problem with the instrument. A cheap digital camera can’t take a good picture at night, even when it’s working perfectly well.
Reason #4: Several parts of the literature hint that spectroscopy techniques are a bad way to measure lithium in food. These comments are often vague, but it seems like people already have reason to think that these methods underestimate the amount of lithium.
For example, Drinkall et al. (1969) mention that they chose to use AAS (“the Unicam SP90 Atomic Absorption Spectrophotometer, [with] a propane-air flame”) because of their concern about “spectral interference occasioned by elements other than lithium” in spectroscopy techniques.
Manifred Anke, who did more work on lithium levels in food than maybe anyone else, makes this somewhat cryptic comment in his 2003 paper:
Lithium may be determined in foods and biological samples with the same techniques employed for sodium and potassium. However, the much lower levels of lithium compared with these other alkali metals, mean that techniques such as flame photometry often do not show adequate sensitivity. Flame (standard addition procedure) or electrothermal atomic absorption spectrophotometry are the most widely used techniques after wet or dry ashing of the sample. Corrections may have to be made for background/matrix interferences. Inductively coupled plasma atomic emission spectrometry [another name for ICP-OES] is not very sensitive for this very low-atomic-weight element.
We can also point to this article by environmental testing firm WETLAB which describes several potential problems in lithium analysis. “When Li is in a matrix with a large number of heavier elements,” they say, “it tends to be pushed around and selectively excluded due to its low mass. This provides challenges when using Mass Spectrometry.” They also indicate that “ICP-MS can be an excellent option for some clients, but some of the limitations for lithium analysis are that lithium is very light and can be excluded by heavier atoms, and analysis is typically limited to <0.2% dissolved solids, which means that it is not great for brines.” We’re not looking at brines, but digested food samples will also include many heavier atoms and some dissolved solids, and might face similar problems.
The upshot is that various sources say something like, “when testing foods, you have to do everything right or you’ll underestimate the amount of lithium”. We can’t tell exactly what these sources think is the right way to do this kind of analysis, but everyone talks about interference and underestimation, and no one mentions overestimation. This makes us suspect that the lower HNO3 digestion numbers are an underestimation and the higher dry ashing numbers are more accurate.
ICP techniques can detect all the elements from lithium to uranium, which means that lithium is just on the threshold of what can be detected. It wouldn’t be terribly surprising if lithium were an edge case, since it is on the edge of detection for ICP analysis. Interference might push it over the edge of the threshold. And interference would only lead to mistakenly lower measurements, not mistakenly higher measurements. This suggests the higher measurements are more accurate.
Reason #5: There are a few cases where teams have used HNO3 digestion and still report high concentrations of lithium in food, in particular Voica, Roba, and Iordache (2020).
This suggests that maybe there’s some trick to HNO3 digestion that can make it give higher, more accurate results, numbers that are consistent with dry ashing. Maybe these teams know something we don’t.
𐫱
All of these are reasons to suspect that the higher dry ashing numbers are more accurate. However, the truth is that at this point, nobody knows.
Given this uncertainty, it could be that neither technique is accurate. The true levels of lithium in these foods might be in between, or could be even higher than what was detected by dry ashing.
Using other analysis techniques like AAS or AES or FAES would be a good way to triangulate between these two conflicting methods. Unfortunately we have not been able to find a lab that offers AAS or other alternative methods of chemical analysis. Can anyone help us?
Accuracy aside, one thing that stands out is that none of these techniques are very precise. For three samples of the same well-blended corn syrup, dry ashing with ICP-OES gives estimates of 0.7155 mg/kg, 1.5892 mg/kg, and 8.1207 mg/kg lithium. HNO3 digestion with ICP-OES generally doesn’t report any lithium at all, but for spinach, it gives estimates of 0.3914 mg/kg, 0.2910 mg/kg, and 0.3595 mg/kg. These are for three identical samples of well-blended spinach. In theory they should be the same! But all four techniques appear to have relatively low precision across the board.
5. What does this mean for analytical chemistry?
Two different analytical techniques gave two very different answers when looking at the exact same samples. This seems like an anomaly worth investigating.
These unusual findings may result from the fact that lithium is the third-lightest element and by far the lightest metal. It’s a real weird ion, so this may just be lithium being lithium. But even so, if the nitric acid completely digests a sample and gives a clear, homogeneous solution, it would seem like there is nowhere for Li+ to hide. From first principles, you’d expect this to work.
It’s also possible that this points to a more consistent limitation of common analytical techniques. Certainly it would be a problem if the techniques we used to estimate mercury in fish, or arsenic in rice, consistently underestimated the concentrations of these metals.
It may be smart to run similar studies to compare analytical techniques for estimating other metals in foods, to make sure there aren’t any other hidden surprises like this one. If work along these lines turns up many similar surprises, well, maybe that means we don’t understand analytical chemistry as well as we think.
6. Next Steps
We would like to test a lot more samples, and get a better sense of how much lithium is in all kinds of different foods.
But before we can do that, we have to figure out this mystery around different analytical techniques. It doesn’t make sense to go out and use one method to test a thousand different foods when we don’t know if that method is at all reliable or accurate.
So first off, we will be trying to figure out which technique is most accurate, and if we can, we’ll also try to figure out why these different analytical techniques give such strikingly different results.
There are a few ways we can do this:
- We can add known amounts of lithium to food samples in a spike-in study.
- We can also spike-in elements that might be interfering with lithium detection.
- We can try other kinds of digestion or other analytical techniques (like AAS) as a tiebreaker, and see if they agree more with the HNO3 numbers or the dry ashing numbers.
- Or we can study more samples — it’s possible that a food containing 1000 mg/kg would register above the limit of detection for both techniques.
- If you have any other clever ideas, please let us know!
In the meantime, here are some ways you can help:
If you have access to the necessary equipment, please replicate our work. We’ve included all the checks we could think of, but it’s still possible that there was some mistake in our procedure, something backwards about the results. Independent labs should confirm that they get similar results when comparing HNO3 digestion to dry ashing in ICP-MS and ICP-OES analysis.
An even bigger favor would be to extend our work. If you are able to replicate the basic finding, it would be jolly good to tack on some new foods or try some new analytical techniques. Do you have access to AAS for some reason? Wonderful, please throw an egg into the flame for us.
If you’re not an analytical chemist but you are a person of means who is both curious and skeptical, you could conceivably hire a lab to replicate or replicate and extend our work. If you’re interested in doing this, we would be happy to advise.
And if you want to help fund more of this research, please contact us. You can also donate to Whylome directly.
Thanks again to our anonymous donor, to Sarah Jantzi, and to Whylome for supporting this research.
Finally, thank you for reading!
APPENDIX A: Wait what is the background for this study?
Hello, we are SLIME MOLD TIME MOLD, your friendly neighborhood mad scientists.
We started getting into this question because in our opinion, the evidence suggests that exposure to subclinical doses of lithium is responsible for the obesity epidemic — you can read all about it in Part VII and Interludes C, G, H, and I of our series, A Chemical Hunger.
We also understand that not everyone finds this evidence convincing. That’s ok. Even if you don’t think lithium causes obesity, this project is still important for other reasons: 1) lithium might have other health effects, so 2) we should be able to test food for lithium concentrations so we can know how much we’re consuming and act accordingly. And in general, this looks like it might be a gap in analytical chemistry. We should know how to analyze things; so let’s close that gap.
APPENDIX B: Where is all this lithium coming from?
We’ve already written quite a bit about this, so if you want the full story, you should read those posts: in particular Part VII, Interlude G, Interlude H, and Interlude I of A Chemical Hunger.
But the short version is this. Starting around 1950, people started mining more and more lithium and never looked back, and some of what we mine eventually ends up as contamination. Lithium goes in batteries, which end up in landfills. It also goes in the lithium grease used in cars and other heavy machinery, which ends up in runoff. Deeper aquifers often contain more lithium, so drilling deeper wells may have also increased our exposure.

But the biggest contributor is probably fossil fuels. Coal often contains lithium, which can contaminate groundwater through coal ash ponds. Oil and natural gas extraction often creates oilfield brines or “produced water” that can contain incredible concentrations of lithium. In theory these brines are safely disposed of, but in practice they often contaminate groundwater, are spilled in quantities of hundreds of thousands of gallons, or are spread on roads in their millions of gallons as a winter de-icer.
Oh and sometimes people use oilfield brines to irrigate crops. Yes, really.

“We can add known amounts of lithium to food samples in a spike-in study.”
This is called a positive control. For this type of experiment you should have both a positive and negative control.
LikeLike
Can you say more?
LikeLike
I would do something like the following list of samples:
1) known quantity of lithium salt (strongly ionic bond)
2) known quantity of lithium compound with more covalent bond (e.g. phenyllithium)
3) known quantity of another organic lithium compound for good measure
4) control ultrapure substance 1 (no lithium)
5) control ultrapure substance 2 (no lithium)
6) control mixture of equal parts of many ultrapure substances (no lithium) containing a broad range of elements of various masses
7) above control mixture + known quantity of lithium (of each variety of lithium)
8) twinky control
9) twinky control + known quantity of lithium (of each variety of lithium)
LikeLike
Random idea: You could test a plant that you’d grown in soil spiked with lithium. Having plants with a high lithium content might be different than spiking in lithium.
Obviously, it’d be great to grow a plant that might have good lithium absorption.
LikeLike
There are several studies like this! e.g.: Hawrylak-Nowak, Kalinowska, and Szymańska (2012) grew corn and sunflower plants in glass jars containing 0 (control), 5, 25, or 50 mg/L lithium in a nutrient solution. After 14 days, they harvested the shoots, and found that lithium accumulated in the shoots in a dose-dependent manner. Even in the control condition, where no lithium was added to the solution, sunflower shoots contained 0.9 mg/kg and corn shoots contained 4.11 mg/kg lithium. At 5 mg/L solution, sunflower contained 422.5 mg/kg and corn contained 72.9 mg/kg; at 25 mg/L solution, sunflower contained 432.0 mg/kg and corn contained 438.0 mg/kg; at 50 mg/L solution, sunflower contained 3,292.0 mg/kg and corn contained 695.0 mg/kg.
LikeLike
Oh, cool!
It looks like the Hawrylak-Nowak, Kalinowska, and Szymańska (2012) paper ( https://www.ncbi.nlm.nih.gov/pmc/articles/PMC3501157/ ) used ICP-OES but doesn’t say which digestion method they used.
Have you tried reaching out to them to see what digestion method they used? If not, I’d be happy to shoot them an email 🙂
LikeLike
We haven’t reached out to them yet, if you would be willing to that would be great! 🙂
LikeLike
Just out of curiosity, can you say roughly how much it costs to run a study like this? Are we talking two or three thousand dollars or a lot more?
LikeLike
It will vary quite a lot depending on the project, enough that we don’t want to give a specific estimate, but we can tell you that the lab we were using charged about $10-$25 per sample for digestion and $30-$35 per sample for ICP analysis. But that will vary by the lab you use and it even varied at the lab we hired for various reasons that are hard to describe.
LikeLike
Thanks!
Sounds like the cost might sometimes be in the few thousand dollar range, which is good to know 🙂
LikeLike
Funny story. I once contracted a commercial lab to analyze the amount of iodine present in a bulk nutritional supplement. Their intake form at the time clearly assumed I was an academic institution, but in working with one of their reps over the phone to make sure I submitted the form correctly they weren’t fazed and I was able to follow their process and get results. This was years ago and I periodically get marketing or holiday emails from them still. I peeked at their website and it appears they do offer AAS:
https://www.robertson-microlit.com/services/metals-analysis/
My iodine analysis was pretty cheap all things considered but it was also one sample, one run, pretty basic stuff.
LikeLike