Lithium in American Eggs

1. Introduction

In our previous analysis, we tested the lithium levels of ten American foods. 

All ten foods were found to contain levels of lithium above the limit of detection, but some foods contained a lot more than others — ground beef contained up to 5.8 mg/kg lithium, corn syrup up to 8.1 mg/kg lithium, and goji berries up to 14.8 mg/kg lithium. 

But of the ten foods we looked at, eggs appeared to contain the most, up to 15.8 mg/kg lithium when analyzed with ICP-OES: 

The Results of the Previous Study 

So for our next study, we decided to look at more eggs. 

The first reason to look at more eggs was to confirm the results of our first study, and confirm that these numbers could be replicated.

The second reason to look at more eggs was to start getting a better sense of the diversity of results. Where the first study gave us a small amount of breadth by comparing several foods, the second study would give us a small amount of depth by comparing several eggs. 

The third reason to look at more eggs was that we might be able to find an outlier, a sample of food that contains far more than 15 mg/kg lithium. Eggs containing 15 mg/kg lithium are somewhat of a public health concern; how much more concerning would it be to find eggs that contain 50 mg/kg, or 100 mg/kg. 

(There are reports of such outliers in other foods, in particular from work by Sievers & Cannon in the early 1970s, who reported an “extraordinary” lithium content of 1,120 mg/kg in wolfberries from the Gila River Valley.)

As in the previous study, this project was run with the support of the research nonprofit Whylome, and funded by a generous donation to Whylome from an individual who has asked to remain anonymous. General support for Whylome in this period was provided by the Centre For Effective Altruism and the Survival and Flourishing Fund

Special thanks to all the funders, Sarah C. Jantzi at the Plasma Chemistry Laboratory at the Center for Applied Isotope Studies UGA for analytical support, and to Whylome for providing general support. 

The technical report is here, the raw data are here, and the analysis script is here. Those documents give all the technical details. For a more narrative look, read on. 

2. General Methods

2.1 Eggs

First, we collected a sample of eggs from grocery stores around America.

We started by purchasing several cartons of eggs from grocery stores near Boulder, Colorado. We bought several different brands, and tried to get a fair mix of eggs, both white and brown, conventional and organic. 

However, this was still not enough diversity for our purposes. So in the meantime, we asked friends from around the country to mail us cartons of eggs. 

Fun fact: Eggs don’t actually require refrigeration, Americans are basically the only weirdos who even keep them in the fridge. Especially when it’s mild outside, they keep for many weeks at room temperature. So shipping these eggs was relatively easy — really it’s just about packaging them with lots of padding so they don’t break. Most of the eggs arrived intact and we’re very grateful for the great care in packaging and shipping taken by our egg donors (ha). 

The list of eggs is summarized in greater detail in the technical report.

From most cartons, we took two samples of 4 eggs. This gave us two measurements per carton, which should give us some sense of how much variation there is within an individual carton.

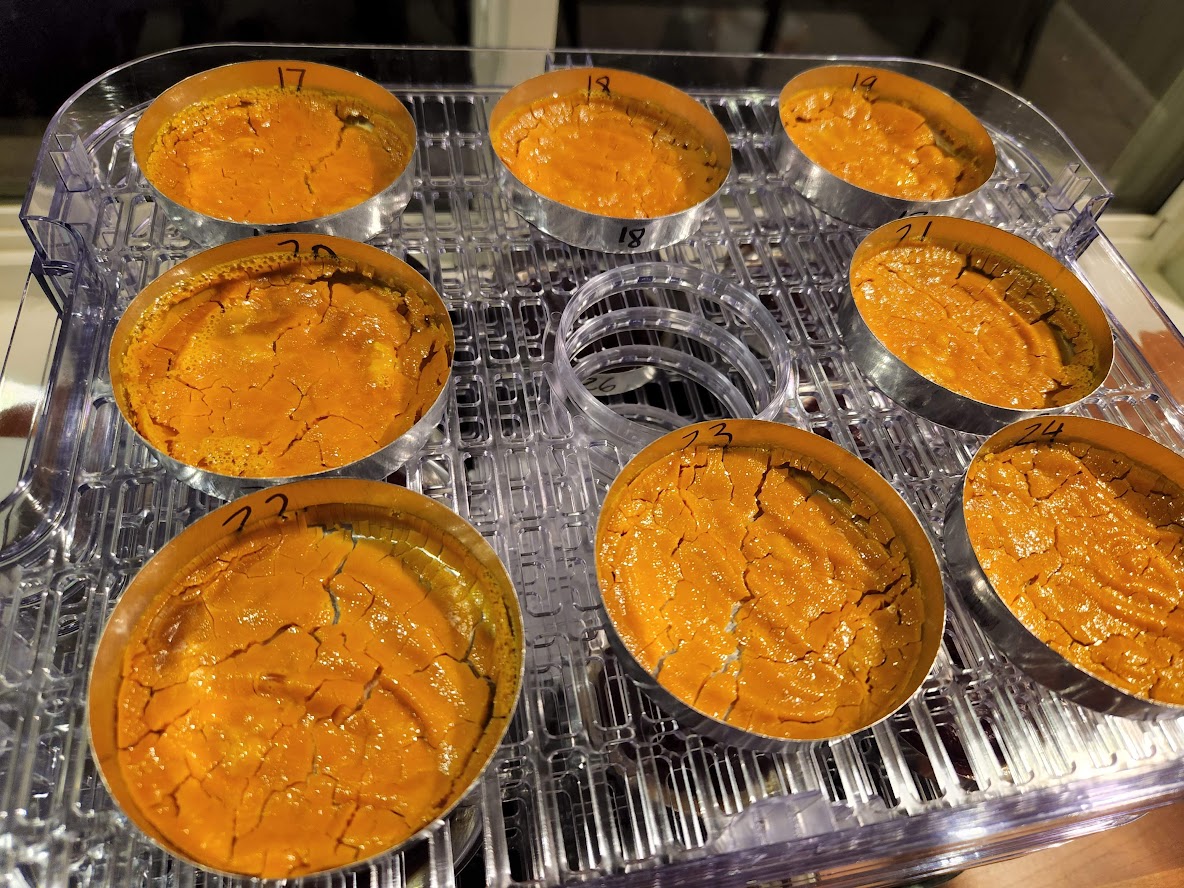
Each sample was homogenized/blended with a stick blender for 1 minute to obtain a smooth, merengue-like texture. The blended mixture was then transferred to drying dishes and dried in a consumer-grade food dehydrating oven.

We also pulled out one brand for more testing, to assess individual egg-to-egg variability. From the carton of Kroger Grade AA, we took two samples of 4 eggs as normal. Then we took three more samples of individual eggs. The single eggs were blended and dried just as the larger 4-egg samples were. 

When all samples were dried, they were crumbled into a powder, weighed, put into polypropylene tubes, and shipped off to the lab for further processing.
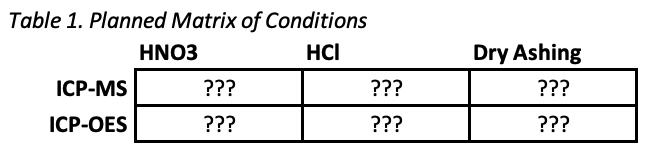
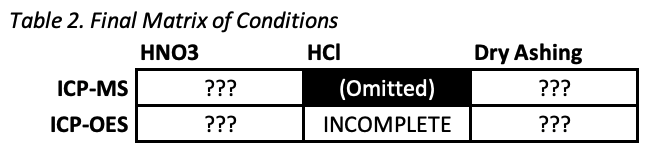
2.2 Digestion

Food samples need to be digested before they can be analyzed by ICP-OES. Based on our results from the previous study, we used a “dry ashing” digestion approach, where samples are burned at high temperatures, and the ash is dissolved in nitric acid. 

Incineration causes organic compounds to exit the sample as CO2 gas, but elements like sodium, potassium, magnesium, and lithium are non-volatile and remain behind in the ash.

2.3 Analysis

ICP-OES generates a tiny cloud of high-energy plasma, the “inductively-coupled plasma” of the acronym, and injects a cloud of liquid droplets into that plasma (hence the need for digestion). ICP-OES then examines the light that is emitted by the plasma as the liquid sample hits it.

In addition to lithium, we also analyzed all samples for sodium. Sodium is chemically similar to lithium, and most foods contain quite a lot, which nearly guarantees a good signal in every sample.

This makes sodium a useful point of comparison. At every step, we can compare the lithium results to the sodium results, to see if general patterns of findings match between the two elements.

3. Results

All samples were analyzed as one project, but for clarity of understanding, we’re going to report this project in two parts, as two studies.

In Study One, we look at the main body of results — eggs analyzed as four-egg batches from a single carton.  

In Study Two, we look only at the Kroger Grade AA eggs — analyzed as two four-egg batches and three one-egg batches, to assess individual egg-to-egg variability.

3.1 Study One

 For starters, here is a histogram of the distribution of lithium measurements in our egg samples: 

We’ve previously speculated that the distribution of lithium in food would be lognormal, as it is in drinking water, and indeed this looks very lognormal. 

For comparison, here’s the distribution of sodium:

Note that the x-axis is extremely different between the two plots! This is not surprising; eggs contain a lot more sodium than lithium.

For a sanity check, the USDA says that “Egg, whole, raw, fresh” contains 142 mg sodium per 100 g egg. Converted, that’s 1,420 mg/kg, which approximately matches these results, though the mean in this sample is much lower at only 987.3 mg/kg. The median is 963.0 mg/kg, and the standard deviation is 288.8 all told.

Slightly surprising are those three samples that (according to the analysis) contain almost no sodium — their values in the data are 7.6 mg/kg, 1.5 mg/kg, and one measurement below the limit of quantification. 

3.1.1 By Batch

More interesting is the breakdown by batch.

As a reminder: each carton of eggs (aside from the Trader Joe’s eggs, due to an oversight) was used to create two batches of four eggs each. Then, each batch was tested in triplicate, so each carton was tested six times. Here, each bar indicates a batch. Each batch has three dots, representing each of the three results from the tests done in triplicate: 

The main finding is that lithium was detectable in nearly all eggs. This suggests that ICP-OES is more than sensitive enough for this type of work, and that in general, eggs contain appreciable levels of lithium. 

Most egg samples contained between 0.5 and 5 mg/kg. The few readings of “zero” in the plot actually mean “less than about 0.04 mg/kg moist weight”.

Hypothetically speaking, the batches were all well-mixed. Eggs were blended with a stick blender for a full minute (to a very creamy consistency, think meringue), then dried and crumbled, and the dried bits mixed up. So it’s quite surprising that after all that, there’s so much variance within the batches.

Some of the batches show close agreement between different samples from the same batch. Both Simple Truth AA batches have only a very small amount of variation. Whole Foods Batch 2 is bang on every time. 

But other batches show a lot of variation. Batch 1 of Organic Valley and Batch 1 of Eggland’s best both contain one sample that is a huge outlier. You might dismiss these as some kind of one-off analysis error. But some of these cases, like both CostCo batches or the first Land-O-Lakes batch, show disagreement between all three samples. 

We wondered if this might mean that these batches were imperfectly blended. This would be quite surprising, given the lengths we went to to ensure that the batches were well-mixed. 

If the batches were perfectly blended, then all three samples should contain identical levels of lithium. The only differences between the results would then be errors in the analysis, not real differences in the samples. But if errors were the only source of noise, you would expect to see similar levels of variation in every batch. 

Two explanations seem likely.

First, lithium is very strange. In our last study, we saw that sometimes you get very different numbers for the exact same piece of food. Maybe the differences between different samples from the same batch comes from the fact that it’s hard to get accurate measurements for lithium levels in food.

Second, perhaps eggs are just goopy. It’s possible that despite our best efforts to completely blend the samples, they are still less than perfectly mixed, so some samples from the same batch contain more or less lithium than others. 

We can test these explanations by comparing the lithium results to the sodium results for the same set of batches and samples. If the variance is the result of a problem with lithium detection, then the sodium results should be much more consistent within batches. But if the variation comes from the eggs being imperfectly blended, then we should see similar variation in the sodium results as in the lithium results. 

3.1.2 Sodium

Here are the sodium results: 

Sure enough, there is a lot of variation between sodium levels, even within single batches. This suggests that the variation we saw in the lithium results is not the result of something weird about lithium. It’s probably something general about the samples or the analysis. 

Some of the variation in sodium lines up with the lithium results. The Whole Foods batches show great precision for both lithium and sodium, suggesting that they are especially well-blended or homogenous or something. But there is also some disagreement. For lithium, Organic Valley Batch 2 was much more precise than Organic Valley Batch 1. For sodium, it is the opposite. 

Sodium does show something unique — three very clear outliers with readings of almost exactly zero sodium (specifically 7.6 mg/kg, 1.5 mg/kg, and one reading below the limit of quantification). 

These look like errors of the analysis rather than real measurements. All three are outliers from the sodium data in general, more than three standard deviations below the mean. All three are from different batches and starkly disagree with the other samples from that batch. And we have strong external reasons to expect that any bit of egg will contain more than zero sodium.

In addition, we notice that these three cases with exceptionally low sodium levels are the exact same three cases that registered as below the limit of quantification for lithium. This suggests that none of these readings are real, that there were three samples where something went wrong, and the analysis for some reason registered hugely low levels of sodium and no lithium. If true, that means that all real measurements detected lithium above the limit of quantification.

The other variables we considered, like location, egg color, and whether or not the eggs were organic, didn’t seem to matter. Maybe differences would become apparent with a larger sample size, but they’re not apparent in these data.

3.2 Study Two

You might expect that hens from the same farm, eating the same feed, would all have roughly similar amounts of lithium in their eggs. For the same reason, it seems likely that any two eggs in the same carton wouldn’t be all that different, and would contain similar amounts of lithium.

All the above seems likely, but we actually have no evidence. It’s an assumption, and exactly the kind of assumption that could really confuse us if we assume wrong. It’s worthwhile to check.

Certainly the results from Study One call the assumption into question. A thoroughly blended mix of four eggs seems like it should have homogenous levels of lithium throughout. But empirically, that isn’t what we saw. We saw a lot of variation. Maybe the variation within those 4-egg batches comes from differences between the four eggs.

To test this, we did another round of analysis, focusing on a single carton of Kroger eggs. As before, of the 12 eggs in the dozen we took two groups of four to create two four-egg batches.

In addition, we took three of the remaining four eggs, and used them to create three one-egg batches, mixing and sampling just that single egg. The one-egg batches each consisted of a single egg from this carton, blended well. The one-egg batches were also tested in triplicate, i.e. three samples from the same egg. 

Here are the results: 

These four-egg batches look much like the four-egg batches tested in Study One. They show a lot of variation between the samples tested in triplicate.

The single-egg batches, on the other hand, did indeed have lower variance than the 4-egg batches. There was much closer agreement between different samples from the same eggs, than samples from different eggs. Certainly we see a difference between the egg used for Batch 3, which all samples indicate contains about 1 mg/kg lithium, and the egg used for Batch 4, which all samples indicate contains about 5 mg/kg lithium

This suggests that there really may be appreciable egg-to-egg variation. This could be the result of other factors, including simple randomness, but the tightness of the single-egg analyses is suggestive. And the fact that the variance seems much lower in single-egg batches implies that the mixed four-egg batches are imperfectly blended.

The sodium results for these batches seem to confirm this, with greater variation in sodium in the four-egg batches than in the one-egg batches: 

Again, this suggests that the patterns we observe in the lithium data are the result of actual results in the world, or the analysis in general, rather than some artifact of the lithium analysis in particular.

4. Discussion

Nearly all egg samples contained detectable levels of lithium, and around 60% of samples contained more than 1 mg/kg lithium (fresh weight). These results appear to confirm that eggs generally contain lithium.

If you accept the argument that the three samples with conspicuously low sodium readings are the result of a failure of analysis, then all egg samples contained detectable levels of lithium. 

In terms of diversity of results, samples varied from as much as 15 mg/kg Li+ to as little as less than 1 mg/kg Li+. Variation did not seem to be related to the geographic purchase origin of the eggs. Nor were there any obvious differences between organic and non-organic, or white and brown eggs. This suggests that these are not major sources of variation. 

However, we did see evidence of a lot of variation in lithium levels between individual eggs, even between individual eggs from the same carton. 

While there was a lot of variation between samples, some samples showed a great deal of consistency, especially samples from single eggs. This suggests that dry ashing followed by ICP-OES has high precision when analyzing food samples for lithium. Though these results do not speak to whether or not this analytical method is accurate for such samples, they do suggest that these are real measurements and not merely the result of noise or analytical errors.  

One of our hopes for this study was to find an egg that contained more than 15 mg/kg lithium, that we could subject to other, less sensitive analytical methods. This would let us get a sense of accuracy by triangulation, comparing the results of different methods when analyzing samples of the same egg.

We did in fact find eggs that contain such high concentrations. Above we reported the lithium concentrations in fresh weight, because those are the numbers that are relevant if you are eating eggs. But in terms of analysis thresholds, the numbers that matter are the dry weight. For dry weight, some of these egg samples contain as much as 60 mg/kg lithium. That’s more than enough to be above the sensitivity of a technique like AAS. 

As we are quite interested in trying to confirm the accuracy of lithium analyses in food, one next step will be to replicate these analyses using other analytical techniques like AAS.

How Much Lithium is in Your Twinkie?

1. Introduction

How much lithium is in your food? Turns out this is harder to answer than you might think.

You might be interested in this question because clinical doses of lithium (50-300 mg/day) are a powerful sedative with lots of nasty side effects. Many of these side effects also show up in people taking subclinical doses (1-50 mg/day). Even trace doses (< 1 mg/day) seem to have some effects. And the EPA is concerned about exposure to levels as low as 0.01 mg/L and 0.06 mg/L

There are lots of different methods you can use to estimate the lithium in a sample of food. This usually involves some kind of chemical liquefication (“digestion” in the parlance) paired with a tool for elemental analysis. You need digestion to analyze food samples, because some analysis techniques can only be performed on liquids, and as you may know, many foods are solids or gels. Mmmmm, gels. *HOMER SIMPSON NOISES*

Most modern studies use ICP-MS for analysis of metals like lithium, combined with digestion by nitric acid (HNO3). ICP-MS is preferred because it can analyze many elements at once and it is considered to be especially sensitive. HNO3 is preferred because it is fast and cheap compared to alternatives. 

Studies that use HNO3 digestion with ICP-MS tend to find no more than trace levels of lithium in their food samples — only about 0.1 mg/kg lithium in most foods, and no foods above 0.5 mg/kg. Examples of these studies include Ysart et al. (1999), which surveyed 30 elements in a wide variety of UK foods and found no more than 0.06 mg/kg lithium in any food; Saribal (2019), which measured the levels of 19 elements in cow’s milk samples from supermarkets in Istanbul, and found less than 0.04 mg/L lithium in all samples; and Noël et al (2006) which surveyed the levels of 9 elements in “1319 samples of foods typically consumed by the French population”, finding 0.154 mg/kg or less lithium in all foods (though they reported slightly higher amounts in water).  

But as we’ve reviewed in previous posts, the literature as a whole is split. Studies that use other analysis techniques like ICP-OES or AAS, and/or use different acids like H2SO4 or HCl for their digestion, often find more than 1 mg/kg in various foods, with some foods breaking 10 mg/kg. Examples include studies like Ammari et al. (2011), which found 4.6 mg/kg lithium in spinach grown in the Jordan Valley; Anke, Arnhold, Schäfer, and Müller (1995) which found more than 1 mg/kg lithium in many German foods, including 7.3 mg/kg lithium in eggs; and in particular we want to mention again Sievers & Cannon (1973), which found up to 1,120 mg/kg lithium in wolfberries (a type of goji berry) growing in the Gila River Valley.

1.1 State of the Art Isn’t Great

From the existing literature alone, it’s hard to say what concentrations are present in today’s food. Different papers give very different answers, and often seem to contradict each other. It’s hard to get oriented.

We don’t want to give the impression that there’s a consensus to be boldly defied, or that there are two opposing camps. It’s more like this: hardly anyone has even tried to do a decent job of even looking for lithium in food or taking it seriously, and we are here to smack them and tell them to pay attention to something that has been ignored. This is not a well-studied question. It is a subject that has been the topic of few papers and even fewer authors. It is a small literature and very confused.

Hardly anyone can even be bothered to look for lithium. When it does appear in a study, half the time it feels just tacked on to a list of things that the authors actually care about (like in the France study above). Many of these studies are really looking for toxic metals like lead and cadmium, which are obviously important things to check for in our food. But this makes lithium an afterthought. And when authors don’t care, fundamental issues of analysis can easily be overlooked. The assumption seems to be that you can just throw everything into the same machine and get a good measurement for every element without any extra effort. But as we’ll see in a moment, that may not be the case. 

As we hinted at above, the analytical methods may be the root of the problem. Studies that use HNO3 digestion with ICP-MS report minor trace levels of lithium in food. Studies that use other forms of digestion or other analytical techniques report much higher levels, often above 1 mg/kg. This makes us think that the different analyses are the reason why these papers get such different estimates. However, we couldn’t find any head-to-head comparisons in the literature, and it isn’t clear if the problem lies with ICP-MS, HNO3 digestion, or both.  

1.2 Effects of Lithium

This is more than a purely academic question: lithium is psychoactive, and exposure through our food could have real health effects. 

Clinical doses, which usually range between 56 mg and 336 mg elemental lithium per day, act as a mood stabilizer and sedative. These doses also cause all kinds of nonspecific adverse effects, including confusion, constipation, headache, nausea, weakness, and dry mouth. 

Some people take subclinical doses of lithium (usually 1-20 mg or so), and when we went on r/Nootropics and asked people what effects and side-effects they experienced taking doses in this range, people reported a whole bundle, the 10 most common being: increased calm, improved mood, improved sleep, increased clarity / focus, brain fog, “confusion, poor memory, or lack of awareness”, increased thirst, frequent urination, decreased libido, and fatigue. 

Even the trace amounts of lithium in our drinking water (< 1 mg/L) may have some effects. A epidemiological literature with roots dating back to the 1970s (meta-analysis, meta-analysis, meta-analysis) suggests that long-term exposure to trace levels of lithium in drinking water decreases crime, reduces suicide rates, reduces rates of dementia, and decreases mental hospital admissions, and this is supported by at least one RCT. The EPA is even concerned about exposure to levels as low as 0.01 mg/L and 0.06 mg/L, describing them as “concentrations of lithium that could present a potential human-health risk”, though they don’t say why.

1.3 Measurement

Trusting your methods is the basis of all empirical work. The disagreement in the existing literature is important because we don’t have a good sense of how much lithium is in our food. It’s concerning because it suggests we might not know how to measure lithium in our food even when we try! This looks like a crisis of methods either way. 

High enough levels of lithium in our foods would be dangerous, so we should know how to take a piece of food and figure out how much lithium is inside it. But there isn’t much research on this topic, and it looks like different methods may give very different answers — if this is true, then we don’t know how to accurately test foods for lithium. And it’s likely that lithium levels in the environment are increasing due to both lithium production and fossil fuel prospecting — see Appendix B for more. 

As an analogy, we should know how to measure mercury levels in fish in case it’s ever a problem — our chemists should be able to check fish samples periodically and get a good estimate of the mercury levels, an estimate we feel we can rely on. Because if we can’t measure it, then we don’t know if it’s a problem. High levels could slip by undetected if our methods aren’t right for the job.

1.4 Head-to-Head

Before we can really figure out how much lithium there is in food, we need to find analytical methods that have our full confidence. And the simplest way to test our methods is a head-to-head comparison. 

This seemed easy enough, so we set up a project with research nonprofit Whylome to put a set of foods through different digestions and put the resulting slurries in different machines, and see if they give different answers. By comparing different digestions and analytical methods on a standard set of food samples, we should be able to see if different techniques lead to systematically different results.

Based on the patterns we saw in the literature, we decided to compare two analysis techniques (ICP-MS and ICP-OES) and three methods of digestion (nitric acid, hydrochloric acid, and dry ashing). Details about these techniques are in the technical report, and in the methods section below.

We originally wanted to compare more analysis techniques (AAS, flame photometry, and flame emission methods) but weren’t able to find a lab that offered these techniques – they are somewhat oldschool and not in common use today. More on this below.

It turned out that the type of analysis didn’t make much difference, but the way in which samples were digested for analysis was surprisingly impactful. And the technique that’s most commonly used today seems to underestimate lithium, at least compared to alternatives.

This project was funded by a generous donation to Whylome from an individual who has asked to remain anonymous. General support for Whylome in this period was provided by the Centre For Effective Altruism and the Survival and Flourishing Fund

Special thanks to all the funders, Sarah C. Jantzi at the Plasma Chemistry Laboratory at the Center for Applied Isotope Studies UGA for analytical support, and to Whylome for providing general support. 

The technical report is here, the raw data are here, and the analysis script is here. Those documents give all the technical details. For a more narrative look at the project, read on. 

2. Methods

The basic idea is to test a couple different analytic approaches on a short list of diverse foods. 

Most modern analyses use either ICP-MS or ICP-OES. Some of these papers find low concentrations of lithium in food; some of them find high concentrations. We wanted to compare these two techniques to see if they might be the cause of the differences in measurements.

Based on what we had seen in the literature, we decided to compare two analysis techniques (ICP-MS and ICP-OES) and three methods of digestion (nitric acid, hydrochloric acid, and dry ashing), fully crossed, for a total of six conditions. 

2.1 Food

As this is our first round of testing, we wanted a diverse set of foods that could give us some sense of the American food environment in general. Therefore we were looking for a mix of foods that were animal-based and plant-based, highly-processed and unprocessed, a mix of fruits, vegetables, dairy, carbs, and meats. We also made sure to include some foods that previous literature had suggested could be extremely high in lithium (like eggs and goji berries), to see if we could confirm those results. Twinkies made the cut because they’re highly processed and highly funny.

In the end, we settled on the following list:

  • Milk 
  • Carrots 
  • Eggs 
  • Ketchup 
  • Spinach 
  • Corn syrup 
  • Goji berries 
  • Twinkies 
  • Ground beef 
  • Whey powder  

All foods were purchased in August of 2022 at grocery stores around Golden, Colorado. Foods were immediately dried, blended, and divided into tubes for further processing, with weight measurements taken at each step of the process. 

For example, this is how we prepared the eggs. A carton of twelve eggs were cracked into a stick blender, and blended until well-mixed. A subset of the resulting egg blend was then dehydrated, enough to produce all of the needed material with some to spare. The dried egg (more like flakes at this point) was crushed and mixed well. All samples were taken from this egg powder. Three samples each were submitted to every method of analysis, so every result is an estimate of the concentration of the target element averaged across the whole carton. Put another way, our sample size was one (1) carton of eggs, not 12 eggs separately. As the egg blend was well-mixed, all samples should in principle have the same concentration of elements, suggesting that any variation between samples is the result of analytic noise rather than variation between different eggs or different cartons.

the aforementioned eggs post-dehydration (but before crushing/powderizing)

The member of the team who prepared the samples had this to say:

Making a “Twinkie puree” out of a bowl of twinkies, and then precisely weighing it out into drying trays and placing it in a dehydrator, is probably the strangest thing I have ever done in the name of science. My trusty stick blender really struggled with twinkies, and I had to take a pause because the overworked motor started to make a burning smell. “Twinkiepuree” has unusual visco-elastic properties which make it worth the effort.

Samples were analyzed in triplicate, and each replicate was done entirely separate (its own digestion and its own analysis of the resulting post-digestion solution). Order was randomized, to minimize the risk of “carry-over” from one analysis to the next.

2.2 Digestion

In the literature, most analyses that found low levels of lithium used digestion by nitric acid. To see if this might be the cause of the differences in results, we decided to compare nitric acid digestion to some other digestion approaches. In the end we settled on two other kinds of digestion: 1) digestion with hydrochloric acid, and 2) “dry ashing”, where samples are burned at high temperatures, then the ash is dissolved in nitric acid.

Dry ashing is a good complement to these acid digestion techniques because while oily foods are very chemically resistant to oxidizers, they are also very flammable. Greasy foods full of hydrocarbon chains that may not perfectly come apart in an acid are likely to be fully broken down by incineration. Incineration causes organic compounds to exit the sample as CO2 gas, but elements like sodium, potassium, magnesium, and lithium are non-volatile and remain behind in the ash.

2.3 Analysis

Both ICP-MS or ICP-OES generate a tiny cloud of high-energy plasma, the “inductively-coupled plasma” of the acronym. And both methods inject a cloud of liquid droplets into that plasma. The difference is that ICP-OES examines the light that is emitted by the plasma as the liquid sample hits it, while ICP-MS examines the actual particles of matter (ions) that are emitted by the plasma as the sample hits it, by directing those ions towards a sensor.

3. Results

The first surprise was that hydrochloric acid digestion visibly failed to digest 6 of the 10 foods. Digestions were clearly incomplete and significant solid matter was still visible after the procedure. The 6 foods were carrots, ketchup, spinach, corn syrup, goji berries, and twinkies. This is an interesting mix since it includes fibrous, sugary, and oily foods, so there’s no obvious trend as to what worked and what didn’t.

Without complete digestion, the measurements we got from ICP-OES couldn’t be expected to be at all accurate. So while we have these results, they probably aren’t meaningful, and we discontinued hydrochloric acid digestion for all other samples.

The main results are all ten foods in four conditions: ICP-MS after HNO3 digestion, ICP-OES after HNO3 digestion, ICP-MS after dry ashing, and ICP-OES after dry ashing.

Little difference was found between the results given by ICP-MS and ICP-OES, other than the fact that (as expected) ICP-MS is more sensitive to detecting low levels of lithium. However, a large difference was found between the results given by HNO3 digestion and dry ashing.

In samples digested in HNO3, both ICP-MS and ICP-OES analysis mostly reported that concentrations of lithium were below the limit of detection. The highest numbers given by this technique were in spinach, which was found to contain about 0.2-0.3 mg/kg lithium, and goji berries, which ICP-MS found to contain up to 1.2 mg/kg lithium.

In comparison, all dry ashed samples when analyzed by both ICP-MS and ICP-OES were found to contain levels of lithium above the limit of detection. Some of these levels were quite low — for example, carrots were found to contain only about 0.1-0.5 mg/kg lithium. But other levels were found to be relatively high. The four foods with the highest concentrations of lithium, at least per these analysis methods, were ground beef (up to 5.8 mg/kg lithium), corn syrup (up to 8.1 mg/kg lithium), goji berries (up to 14.8 mg/kg lithium), and eggs (up to 15.8 mg/kg lithium). 

These results are summarized in greater detail in the technical report, and in this figure: 

4. Which technique is more accurate? 

We think that dry ashing (which gives the higher estimates for lithium) is probably more accurate, and here are some reasons why. 

Reason #1: Many water samples contain some lithium, and some water samples contain a lot of lithium — sometimes more than 1 mg/L, and occasionally a lot more than 1 mg/L. Unlike food samples, water samples require no digestion, so measurements of water samples are probably quite accurate. 

Most food is grown using water and contains some water [CITATION NEEDED]. It would be strange if food, which is made out of water (plus some other things) always contained less lithium than the water it is made out of. More likely, there’s something else that can interfere with the analysis when foods aren’t completely digested. 

Reason #2: The analysis lab we used has a “buy one element, get one free” deal, so for all of the foods we submitted, we requested sodium analysis (Na+) on top of the lithium (Li+). We figured, why not, it doesn’t cost any extra.

If there were something unusual about the lithium analysis, you’d expect sodium to behave differently. Specifically, you’d expect each analytical method to find similar levels of sodium in every food. So we compiled the sodium data and ran the same analysis as lithium. And sure enough, it does. Here’s a comparison of the results for lithium and sodium:

(Note that the y axes are different scales. There is way less lithium than sodium in these foods, so when analyzing lithium we are much closer to the limits of quantitation.)

If you were validating the equivalence of sample prep procedures based on Na+, you’d say “looks good, great agreement between ashing and HNO3 digestion.” This isn’t at all true for Li+. Why? We have no idea. But it further supports the suspicion that Li+ is more slippery for some reason, an excellent comparison that highlights just how strange the lithium results are. 

This also seems to rule out various “operator error” explanations. If someone were dropping vials or putting them in the machine backwards or something, you would see weird patterns for both lithium and sodium results. The fact that the sodium results look totally normal suggests that something weird is happening for lithium in particular.

Reason #3: Imagine taking pictures with a camera. If you point the camera at something dark, the resulting picture comes out dark. If you point it at something bright, the resulting picture comes out bright. This is a good sign that the camera is working as intended, and that you’re operating it correctly. If your pictures always come out dark, something is probably wrong. Maybe you forgot to take off the lens cap.

We see something similar in these data. Dry ashing sometimes gives low measurements, like in milk and carrots, which it always found to contain less than 0.6 mg/kg lithium. Dry ashing sometimes gives high measurements, like in eggs and goji berries. There’s a lot of noise, but we know that it can produce numbers both large and small. 

In comparison, HNO3 digestion always gives tiny numbers. Most of the time it finds that lithium levels are below the limit of detection. When it does seem to detect an actual amount of lithium, the levels are always low, never above 1.2 mg/kg. These numbers look less like actual estimates and more like a problem with the instrument. A cheap digital camera can’t take a good picture at night, even when it’s working perfectly well.

Reason #4: Several parts of the literature hint that spectroscopy techniques are a bad way to measure lithium in food. These comments are often vague, but it seems like people already have reason to think that these methods underestimate the amount of lithium.

For example, Drinkall et al. (1969) mention that they chose to use AAS (“the Unicam SP90 Atomic Absorption Spectrophotometer, [with] a propane-air flame”) because of their concern about “spectral interference occasioned by elements other than lithium” in spectroscopy techniques.

Manifred Anke, who did more work on lithium levels in food than maybe anyone else, makes this somewhat cryptic comment in his 2003 paper:

Lithium may be determined in foods and biological samples with the same techniques employed for sodium and potassium. However, the much lower levels of lithium compared with these other alkali metals, mean that techniques such as flame photometry often do not show adequate sensitivity. Flame (standard addition procedure) or electrothermal atomic absorption spectrophotometry are the most widely used techniques after wet or dry ashing of the sample. Corrections may have to be made for background/matrix interferences. Inductively coupled plasma atomic emission spectrometry [another name for ICP-OES] is not very sensitive for this very low-atomic-weight element.

We can also point to this article by environmental testing firm WETLAB which describes several potential problems in lithium analysis. “When Li is in a matrix with a large number of heavier elements,” they say, “it tends to be pushed around and selectively excluded due to its low mass. This provides challenges when using Mass Spectrometry.” They also indicate that “ICP-MS can be an excellent option for some clients, but some of the limitations for lithium analysis are that lithium is very light and can be excluded by heavier atoms, and analysis is typically limited to <0.2% dissolved solids, which means that it is not great for brines.” We’re not looking at brines, but digested food samples will also include many heavier atoms and some dissolved solids, and might face similar problems. 

The upshot is that various sources say something like, “when testing foods, you have to do everything right or you’ll underestimate the amount of lithium”. We can’t tell exactly what these sources think is the right way to do this kind of analysis, but everyone talks about interference and underestimation, and no one mentions overestimation. This makes us suspect that the lower HNO3 digestion numbers are an underestimation and the higher dry ashing numbers are more accurate.

ICP techniques can detect all the elements from lithium to uranium, which means that lithium is just on the threshold of what can be detected. It wouldn’t be terribly surprising if lithium were an edge case, since it is on the edge of detection for ICP analysis. Interference might push it over the edge of the threshold. And interference would only lead to mistakenly lower measurements, not mistakenly higher measurements. This suggests the higher measurements are more accurate.

Reason #5: There are a few cases where teams have used HNO3 digestion and still report high concentrations of lithium in food, in particular Voica, Roba, and Iordache (2020)

This suggests that maybe there’s some trick to HNO3 digestion that can make it give higher, more accurate results, numbers that are consistent with dry ashing. Maybe these teams know something we don’t.

𐫱

All of these are reasons to suspect that the higher dry ashing numbers are more accurate. However, the truth is that at this point, nobody knows.

Given this uncertainty, it could be that neither technique is accurate. The true levels of lithium in these foods might be in between, or could be even higher than what was detected by dry ashing. 

Using other analysis techniques like AAS or AES or FAES would be a good way to triangulate between these two conflicting methods. Unfortunately we have not been able to find a lab that offers AAS or other alternative methods of chemical analysis. Can anyone help us?

Accuracy aside, one thing that stands out is that none of these techniques are very precise. For three samples of the same well-blended corn syrup, dry ashing with ICP-OES gives estimates of 0.7155 mg/kg, 1.5892 mg/kg, and 8.1207 mg/kg lithium. HNO3 digestion with ICP-OES generally doesn’t report any lithium at all, but for spinach, it gives estimates of 0.3914 mg/kg, 0.2910 mg/kg, and 0.3595 mg/kg. These are for three identical samples of well-blended spinach. In theory they should be the same! But all four techniques appear to have relatively low precision across the board. 

5. What does this mean for analytical chemistry? 

Two different analytical techniques gave two very different answers when looking at the exact same samples. This seems like an anomaly worth investigating.

These unusual findings may result from the fact that lithium is the third-lightest element and by far the lightest metal. It’s a real weird ion, so this may just be lithium being lithium. But even so, if the nitric acid completely digests a sample and gives a clear, homogeneous solution, it would seem like there is nowhere for Li+ to hide. From first principles, you’d expect this to work.

It’s also possible that this points to a more consistent limitation of common analytical techniques. Certainly it would be a problem if the techniques we used to estimate mercury in fish, or arsenic in rice, consistently underestimated the concentrations of these metals. 

It may be smart to run similar studies to compare analytical techniques for estimating other metals in foods, to make sure there aren’t any other hidden surprises like this one. If work along these lines turns up many similar surprises, well, maybe that means we don’t understand analytical chemistry as well as we think. 

6. Next Steps

We would like to test a lot more samples, and get a better sense of how much lithium is in all kinds of different foods. 

But before we can do that, we have to figure out this mystery around different analytical techniques. It doesn’t make sense to go out and use one method to test a thousand different foods when we don’t know if that method is at all reliable or accurate.

So first off, we will be trying to figure out which technique is most accurate, and if we can, we’ll also try to figure out why these different analytical techniques give such strikingly different results. 

There are a few ways we can do this:

  • We can add known amounts of lithium to food samples in a spike-in study. 
  • We can also spike-in elements that might be interfering with lithium detection. 
  • We can try other kinds of digestion or other analytical techniques (like AAS) as a tiebreaker, and see if they agree more with the HNO3 numbers or the dry ashing numbers. 
  • Or we can study more samples — it’s possible that a food containing 1000 mg/kg would register above the limit of detection for both techniques. 
  • If you have any other clever ideas, please let us know! 

In the meantime, here are some ways you can help:

If you have access to the necessary equipment, please replicate our work. We’ve included all the checks we could think of, but it’s still possible that there was some mistake in our procedure, something backwards about the results. Independent labs should confirm that they get similar results when comparing HNO3 digestion to dry ashing in ICP-MS and ICP-OES analysis. 

An even bigger favor would be to extend our work. If you are able to replicate the basic finding, it would be jolly good to tack on some new foods or try some new analytical techniques. Do you have access to AAS for some reason? Wonderful, please throw an egg into the flame for us. 

If you’re not an analytical chemist but you are a person of means who is both curious and skeptical, you could conceivably hire a lab to replicate or replicate and extend our work. If you’re interested in doing this, we would be happy to advise.

And if you want to help fund more of this research, please contact us. You can also donate to Whylome directly.

Thanks again to our anonymous donor, to Sarah Jantzi, and to Whylome for supporting this research. 

Finally, thank you for reading!


APPENDIX A: Wait what is the background for this study?

Hello, we are SLIME MOLD TIME MOLD, your friendly neighborhood mad scientists. 

We started getting into this question because in our opinion, the evidence suggests that exposure to subclinical doses of lithium is responsible for the obesity epidemic — you can read all about it in Part VII and Interludes C, G, H, and I of our series, A Chemical Hunger. 

We also understand that not everyone finds this evidence convincing. That’s ok. Even if you don’t think lithium causes obesity, this project is still important for other reasons: 1) lithium might have other health effects, so 2) we should be able to test food for lithium concentrations so we can know how much we’re consuming and act accordingly. And in general, this looks like it might be a gap in analytical chemistry. We should know how to analyze things; so let’s close that gap.

APPENDIX B: Where is all this lithium coming from?

We’ve already written quite a bit about this, so if you want the full story, you should read those posts: in particular Part VII, Interlude G, Interlude H, and Interlude I of A Chemical Hunger

But the short version is this. Starting around 1950, people started mining more and more lithium and never looked back, and some of what we mine eventually ends up as contamination. Lithium goes in batteries, which end up in landfills. It also goes in the lithium grease used in cars and other heavy machinery, which ends up in runoff. Deeper aquifers often contain more lithium, so drilling deeper wells may have also increased our exposure. 

Graph showing world lithium production from 1900 to 2007, by deposit type and year. The layers of the graph are placed one above the other, forming a cumulative total. Reproduced from USGS.

But the biggest contributor is probably fossil fuels. Coal often contains lithium, which can contaminate groundwater through coal ash ponds. Oil and natural gas extraction often creates oilfield brines or “produced water” that can contain incredible concentrations of lithium. In theory these brines are safely disposed of, but in practice they often contaminate groundwater, are spilled in quantities of hundreds of thousands of gallons, or are spread on roads in their millions of gallons as a winter de-icer

Oh and sometimes people use oilfield brines to irrigate crops. Yes, really.

Behind the Scenes: Lithium Removal with Household Water Purification Devices

Lithium is an element, atomic number 3. It is a soft, light, highly reactive metal with a variety of uses. Among other things, it’s often found as a trace mineral in drinking water. Small amounts of lithium are naturally present in many water sources, but levels of lithium in American drinking water have been increasing for the past 60 years.

In 1964, the US Department of the Interior published a report called Public water supplies of the 100 largest cities in the United States, which found a median lithium concentration of only 2.0 µg/L in US drinking water. The highest level they recorded was 170 µg/L. 

In 2021, the USGS released a report that found a median level in US groundwater of 6.9 µg/L. This is almost four times the median level in the 1960s, but looking at nothing but the average obscures the fact that many people are getting exposed to even more. For comparison, the maximum level they found in groundwater was 1700 µg/L, ten times the maximum recorded in 1964. 

The USGS also found that about 45% of public-supply wells and about 37% of domestic-supply wells contain concentrations of lithium “that could present a potential human-health risk per the current EPA guidelines”. Here’s how they describe it in the paper:

Lithium concentrations in untreated groundwater from 1464 public-supply wells and 1676 domestic-supply wells distributed across 33 principal aquifers in the United States were evaluated for spatial variations and possible explanatory factors. Concentrations nationwide ranged from <1 to 396 μg/L (median of 8.1) for public supply wells and <1 to 1700 μg/L (median of 6 μg/L) for domestic supply wells. For context, lithium concentrations were compared to a Health Based Screening Level (HBSL, 10 μg/L) and a drinking-water only threshold (60 μg/L). These thresholds were exceeded in 45% and 9% of samples from public-supply wells and in 37% and 6% from domestic-supply wells, respectively.

Levels in drinking water seem to have increased due to a number of related factors, including the use of drilled wells to tap deeper aquifers, higher levels of fossil fuel prospecting and pollution, and the fact that worldwide lithium extraction and use in industrial applications has increased in general, multiplying the opportunities for accidental exposure and pollution. 

Lithium is not currently regulated in drinking water, and water quality reports don’t regularly include it. Most water treatment plants do not track lithium or attempt to reduce it. But the EPA and other government agencies are becoming more concerned about lithium exposure, even at the trace levels found in drinking water: 

Just this January, lithium was added to the EPA’s proposed Unregulated Contaminant Monitoring Rule. The Rule is used by the EPA to collect data for contaminants that are suspected to be present in drinking water and that do not have health-based standards set under the Safe Drinking Water Act.

Although useful for treating mental health disorders, pharmaceutical use of lithium at all therapeutic dosages can cause adverse health effects—primarily impaired thyroid and kidney function. Presently lithium is not regulated in drinking water in the U.S. The USGS, in collaboration with the EPA, calculated a nonregulatory Health-Based Screening Level (HBSL) for drinking water of 10 micrograms per liter (µg/L) or parts per billion to provide context for evaluating lithium concentrations in groundwater. A second “drinking-water-only” lithium benchmark of 60 µg/L can be used when it is assumed that the only source of lithium exposure is from drinking water (other sources of lithium include eggs, dairy products, and beverages such as soft drinks and beer); this higher benchmark was exceeded in 9% of samples from public-supply wells and in 6% of samples from domestic-supply wells.

Lithium is well-known to have psychoactive effects, which is why lithium salts are often prescribed as a psychiatric medication. In particular, lithium tends to make people less manic and less suicidal. Less charitably, it is sometimes described as a sedative. 

But these effects may not always require psychiatric doses. A long-running literature of epidemiological research (meta-analysis, meta-analysis, meta-analysis) suggests that long-term exposure to trace levels of lithium commonly found in drinking water can also have psychiatric effects. Specifically, trace levels in drinking water are often found to be associated with decreased crime, reduced suicide rates, and/or decreased mental hospital admissions. 

Finally, here at Slime Mold Time Mold we suspect that lithium exposure may contribute to the obesity epidemic. Lithium often causes weight gain at psychiatric doses, and while there’s no smoking gun yet, there’s some evidence that there might be a connection between long-term trace lithium exposure and obesity. People who are exposed to more lithium, especially at their jobs, tend to be more overweight. Cities with higher rates of obesity tend to have more exposure to lithium. And a group of Native Americans (the Pima) who had unusually high levels of lithium in their water also had unusually high levels of obesity, all the way back in the 1970s. Food levels may also be a possible vector (though it’s complicated).

So people often ask us, how can I get lithium out of my tap water? 

For a long time, we weren’t able to answer this question. Until very recently, no one was concerned about lithium levels in drinking water, so there isn’t much research on how to get it out. Heck, back in 2014 the NYT ran an opinion piece arguing that maybe we should start putting lithium in our drinking water. How times have changed.

This is further complicated by the fact that lithium is pretty weird. At an atomic number of only 3, it is the third-lightest and third-smallest element. In some ways it is more like the gasses hydrogen and helium than it is like the metals iron, lead, or mercury, which are much larger and much heavier. This makes it hard to predict whether techniques that can remove other metals would also remove lithium, which is present in solution as an especially tiny ion. 

(A favorite “Whoaahhh” fact about Li+ is that it is so small, a bit of electrical energy can make it can creep into the crystal lattices of other compounds and basically just hang out there indefinitely, usually with a bit of swelling of the “host” crystal. It’s kind of like pouring sand into a jar of marbles — lithium is so tiny it can sneak into very small spaces, which is virtually impossible with any other metal ion. The technical term is that it “intercalates” into these materials. Lithium intercalating back and forth between cobalt oxide and graphite, for instance, is the basis of the lithium ion batteries that power virtually every phone and laptop and electric vehicle. There’s an entire field of research focused on making lithium creep into and out of various materials to store energy. People have been trying for a long time to make Na+ do this, since Na+ is so much cheaper and more abundant than Li+, but it’s still way too hard to make any kind of useful battery with an ion as big as Na+.)

To answer the question of how to get lithium out of your drinking water, we set up a project with research nonprofit Whylome to test several commercially-available water filters, the kinds of things you might actually buy for your home, and see how good they are at removing lithium. It’s taken a couple of months of planning, testing, and analysis, but those results are finally ready to share with the world.

This project was funded by generous donations to Whylome from individuals who have asked to remain anonymous. Further support for the research was provided by The Tiny Foundation, which allowed us to expedite several aspects of the research. Special thanks to our funders, Sarah C. Jantzi at the Plasma Chemistry Laboratory at the Center for Applied Isotope Studies UGA for analytical support, and to Whylome for providing general support. 

The full report is here, the raw data are here, and the analysis script is here. Those documents give all the technical details. For a more narrative look, read on. 

TABLE OF CONTENTS

  1. Methods
  2. Results
  3. Complications
  4. Conclusions

1. Methods

The basic idea of the study is pretty simple.

You buy a bunch of normal water filtration devices (henceforth “filters”, even though they’re technically not all filters) from a store, like Home Depot, or online, from places like Amazon. Or online from Home Depot.

You spike large quantities of water with specific amounts of lithium, to get water containing known levels of lithium.

Then, you run the lithium-spiked water through the filters and take samples of the water that comes out the other end. 

Finally, you submit that water to chemical analysis and find out how much lithium was removed by each of the filters. 

This is basically the perfect garage experiment — except that in this case, filters were tested in the laundry room, not in a garage.

1.1 Water Filtration Devices

To get a sense of the different options available on the market, we elected to test three different types of devices: carbon filters (which are what most people think of when they think of at-home filters); reverse osmosis devices; and electric water distillation stills. 

We chose devices from brands that most people have heard of, and models that people tend to buy. If you click through the links below, you’ll see that many of these devices are best-sellers.

We settled on the following mix of carbon filters: two pitchers, the Brita UltraMax Filtered Water 18-Cup Pitcher and the PUR Ultimate Filtration Water Filter Pitcher, 7 Cup; three on-tap systems, the Brita 7540545 On Tap Faucet Water Filter, the PUR PLUS Faucet Mount PFM350V, and the Culligan Faucet Mount FM-15A; and two under-sink systems, the Waterdrop 15UA and the Brondell Coral UC300.

We settled on two reverse osmosis devices, the GE GXRQ18NBN Reverse Osmosis Filtration System and the APEC ROES-50 5-stage Reverse Osmosis System.

We also tested two distillation machines, the Megahome 580W Countertop Water Distiller and the Vevor 750W Water Distiller

Devices were purchased off of Amazon, from the Home Depot, or from their manufacturer, depending on availability. For each device, we also purchased as many extra filters as needed, so that each test could start with clean filters (see the report for more detail).

Carbon Filters — We came into this pretty confident that carbon filters would perform very poorly for lithium removal, despite some nonsense to the contrary floating around the internet (for example, here and here). Carbon has a low affinity for Li+, so we didn’t expect it would pull very much out of the water. Carbon can remove some metals, like lead, by ion exchange — the same principle used in water softeners. But the metals it is good at removing are multivalent (having a charge of +2 or +3 or +4), not +1 like Li+.

Carbon is also known for having noticeable variation between individual filters, because the carbon in question is made from plant material (often coconut). There will be minor variations in the carbon properties between batches, depending on how fast the coconuts were growing that month and minutiae like that. So we went into this expecting that there might be some differences between different filters, even within the same brand and/or model. 

Since we expected that carbon filters would probably all suck based on the mechanism of action, and because we expected that there might be noticeable variation, we decided to test several different brands of carbon filters, in multiple configurations (pitcher, on-tap, and under-sink). This is why we tested so many devices and why we got a relatively wide mix of brands and configurations.

This way, if carbon filters are all equally ineffective, it should be very obvious. But if we’re wrong and they’re great, or some are much better than others, we have a good chance of noticing. Carbon filters are also the cheapest and most commonly used filters, another reason to test more of them.

We expected less variation in the other two kinds of devices, so we decided to test two models of each. 

Distillation — We expected that distillation machines would work well, but we didn’t know if that was 80% well, 90% well, or 99.9% well. Lithium salts have zero volatility, so when water evaporates and condenses, the lithium should be left behind. The main risk is that droplets of liquid could get caught in the condenser, which could result in some of the original liquid getting into the clean distillate. So a well-designed distillation machine should perform well, but we didn’t know how reliable or well-designed small at-home countertop models would be.

Reverse Osmosis — We were the most uncertain about reverse osmosis. Reverse osmosis is very good at removing divalent metal ions (like Ca2+ and Mg2+), and pretty effective at removing monovalent metal ions from tap water (like Na+ and K+), but it wasn’t clear if this pattern would extend to lithium. In some ways Na and K are very similar to lithium — all three are present in water as single-charge positive ions, and all three are the same chemical group, the alkali metals. But lithium is much smaller and lighter than other elements. Na has an atomic number of 11, and K has an atomic number of 19, while Li has an atomic number of only 3. 

As a result, we weren’t sure if reverse osmosis would be anywhere near as effective at removing lithium as it is at removing these other contaminants. Maybe reverse osmosis would pull lithium out of the water just like any other ion. Maybe it would miss lithium entirely, because the ion is so small. Or maybe something in between. So we went into this expecting that reverse osmosis might be anywhere from 0% to 100% effective. 

1.2 Lithium Spiked Water

For realism, we worked with actual American tap water. In this case, we used tap water from the town of Golden, Colorado. Despite the fact that it was indeed part of the Colorado Gold Rush, Golden, CO is not named after the gold rush or even after gold itself; it is named after some guy named Tom Golden.

Samples of the tap water were spiked with known quantities of “ultra dry” lithium chloride salt to create spiked water samples of known lithium concentration.

We ended up testing four concentrations of lithium: 40, 110, 170, and 1500 µg/L Li+. This covers a range from “starts to be concerning” to “around the highest levels reported in US drinking water”. There’s also a bit more history to these numbers, but we’ll talk about that below. 

1.3 Testing 

Each filter was tested at each concentration, and at two timepoints (realistically these are “volumepoints”, but that’s not really a word). The carbon filters and the RO devices were each tested after 10 liters and after 20 liters. The distillation machines were tested at 2 liters and again at 4 liters, since they take a really long time to run. 

The testing setup looked roughly like this: 

1.4 Analysis

At the start of the project, we sent the same samples to a couple different testing labs, so we could shop around and compare. All the labs we tried were pretty reliable, but the Plasma Chemistry Laboratory at the Center for Applied Isotope Studies, University of Georgia stood out as the best, so we sent all subsequent samples to them. 

Analysis was performed by ICP-OES. The instrument used was a Perkin Elmer 8300 ICP-OES, and the limit of detection was 1 µg/L. All analyses were done in triplicate and were submitted in a random order.


2. Results

The following figure gives an overview of the results. This figure only includes performance at a concentration of 110 µg/L after the first timepoint (2L for distillation, 10L for the others) but the same general pattern holds across pretty much everything: 

2.1 Carbon Filters

Carbon filters are lousy at removing lithium, but probably not 0% effective. Most of the time, water contained slightly less lithium coming out of the filter than it did going in. But the carbon filters didn’t do much, and there wasn’t a huge amount of variation between them.

2.2 Reverse Osmosis

Reverse osmosis was shockingly good at removing lithium. Removal was reliably high for all systems, more than 80% for the GE system and consistently above 95% for the APEC system. The result is unequivocal: reverse osmosis works. Reverse osmosis does not, however, drive these concentrations close to zero. RO is good, but if you start with 100 µg/L in your tap water, you might still end up drinking 10 µg/L even after filtration. 

In many cases you do end up with less than 10 µg/L after filtration, but if you start with a high concentration, you are still generally getting more lithium than was in the median American water source in 1964 (2 µg/L). The lower your starting lithium, the lower the lithium concentration you are getting out of your RO filter.

2.3 Distillation

Finally, distillation machines are nearly perfect at removing lithium. Lithium levels after distillation were undetectable (<1 µg/L) in most cases, and removal was still >99.5% for the highest concentration (1500 µg/L). Distillation reliably drives any levels you would expect to see in American tap water below the level of detection. 

2.4 Long-Term Reverse Osmosis Test

We also decided to do one long-term test of a single system, to check if it kept performing well over a longer period of time, and to see if anything weird happened. We expected that systems would get slightly worse over time, but there might also be a discontinuity, where a system keeps doing well for a while and then suddenly craps out and does much worse. We wanted to see how much decline happened with more use, and check if there was any discontinuity or sudden point of failure. 

Carbon filters don’t work very well even straight out of the box, so obviously we didn’t test one of those. RO doesn’t remove lithium from water quite as well as distillation, but it’s faster, cheaper, and much easier to install. Because RO sits at this sweet spot, we decided to test the GE RO device up to 100 liters. 

We tested the GE RO device against a concentration of 170 µg/L, and the device continued to do a good job removing lithium even up to 100 L. Performance went down slightly over time, but not enormously. At 10 L, the device removed about 98% of the lithium in the water, and by 100 L, it removed about 89%. We don’t know how well it would perform beyond 100 L, but this finding suggests it would keep doing pretty well but progressively worse over time. 

This would be a good topic for further study — run a few RO devices to 1000 L and see what happens. Alternately, you could install a RO device in the home of someone whose tap water is already high in lithium, test its effectiveness once a month, and get a sense of how these devices would perform in a real-world scenario. 

3. Complications

The conclusions from this study are, fortunately, pretty straightforward. But on the way to those conclusions, there were a few complications.

3.1 PUR Pitcher

In addition to the six carbon filters mentioned above, we also tested the “PUR Ultimate Filtration 7-Cup Pitcher”. When we ran it through the same procedure as the other filters, we found there was more lithium in the filtered water than in the original water, at all concentrations. Basically it seemed like the PUR pitcher was adding lithium to the water instead of taking it away. 

This was confusing and seemed like it might be wrong, so we tried the same pitcher again with a different set of filters. This time we didn’t get the weird result — lithium levels went down when we ran water through the filter, just like normal. 

We’re not totally sure why this happened. One possibility is that some of the water evaporated during testing, but letting the water sit for a few days didn’t make a substantial difference compared to filtering rapidly, so this appears unlikely. Another possibility is that there’s meaningful batch-to-batch variation in the lithium content of the filter cartridges. Activated carbon comes from plants (usually coconuts), so conceivably there could be more lithium in some coconuts than in others. If you got unlucky, the carbon might contain a lot of lithium and you would end up adding lithium to the water instead of taking it away. 

In any case, this was strange and inconclusive enough that we ended up removing it from the main analysis, but we’re reporting it here just in case. Good cautionary tale about how even a simple measurement is never simple. 

3.2 Concentration Complication

We originally planned to test lithium concentrations of 10, 60, 100, and 1000 µg/L.

The reasoning was that 10 and 60 µg/L were the EPA thresholds of interest, and that testing 100 and 1000 µg/L covered two further orders of magnitude while still being realistic — according to the USGS, 4% of groundwater wells in the US contain more than 100 µg/L lithium, and the maximum recorded contained 1700 µg/L.

But two things happened to screw that up. 

First, the tap water in Golden gave us a bit of a surprise. Golden is a city in Colorado, and most tap water in Colorado comes from dazzlingly clean snowmelt. Snowmelt should contain almost no lithium (it’s basically been distilled), so we expected that the tap water in Golden would also contain almost no lithium. This assumption was backed up by water quality reports from nearby Denver, CO, which find no lithium in Denver’s water. 

But to our surprise, when we started testing samples, we found that they contained more lithium than we spiked them with. We circled back and tested the unspiked tap water, and found that it contained around 20-25 µg/L, an amount that was reliable across several months. If there are seasonal changes, our January-March sampling window wasn’t big enough to detect them.

The local water treatment plant is fed by Clear Creek, so we collected and tested a sample from the creek about 2 miles upstream from the water treatment plant. The creek there has a concentration of 27 µg/L, very similar to the tap water. It appears that water enters the Golden, CO treatment plant at around 25 µg/L, and the treatment process has very little impact on lithium concentration.

At this point we were questioning our assumptions about water sources, so we collected some local snow and tested that too. The snowmelt had barely detectable lithium, less than or equal to 1 µg/L. This confirms our earlier belief that precipitation is generally very low in lithium (at least in Golden, CO).

If it’s not in the snowmelt, the lithium must be coming from somewhere else. This is speculation, but the Clear Creek watershed does include many abandoned mines, some dating way back to the early gold and silver rushes from the 1800s, and there is at least one Superfund site, so old mine tailings are one possibility (see in particular here). One of the towns upstream (Idaho Springs) has natural hot springs with some geothermal activity, so another possibility is that these springs add lithium to Clear Creek along the way. We didn’t find an obvious link for Idaho Springs, but other hot springs in Colorado definitely brag about the lithium content of their water (Denver Post on Orvis Hot Springs: “The resort’s seven pools are laden with lithium…”), so this seems quite plausible.

This suggests that our original assumptions were mostly correct — snowmelt contains little to no lithium, so most drinking water in Colorado should be quite pure. But in this specific case, looking at water drawn from Clear Creek, we ended up with more than we expected. Water coming from one of Colorado’s snowmelt reservoirs, rather from a well or stream, would probably contain a lot less.

In the end, the lithium levels in Golden’s tap water raised the lithium level of all of our samples by about 25 µg/L. We were already halfway through testing when we discovered this, so we decided to continue with these slightly higher concentrations. If anything, it’s a stricter test of the filters.

Clear Creek, circa 1868

Second, the lithium salt we used was substantially more potent than the stated strength (i.e. much stronger than expected), which also increased the concentrations we tested. 

We used lithium chloride from Fisher Scientific as the lithium spike for all our samples. According to the certificate of analysis, the salt contained a lot of water. But apparently this was not the case. As far as we can tell, the salt appears to have very little water content, so it contains a lot more lithium per weight than expected (about 30% stronger than expected). This caused us to underestimate the amount of lithium in the salt, and as a result, we added more than we meant to. This is why we ended up testing up to 1500 µg/L.

Again, we were already halfway through testing when we discovered this, and decided to forge ahead. Because this error was propagated across all the samples we had submitted, the analysis was still internally consistent. Even though these weren’t the numbers we had set out to study, it doesn’t really matter. Those numbers were arbitrary to begin with; we chose them because we live in a base-10 world. We were still able to compare between filters at realistic concentrations.  

Together, these two factors inflated the concentrations we tested, from 10, 60, 100, and 1000 µg/L to 40, 110, 170, and 1500 µg/L. First, the tap water from Golden added 25 µg/L to all the samples. Then, the unusually dry lithium salt inflated the amount added to each sample by around 30%.

Fortunately, this does not seriously impact our results. Filters were consistent across all concentrations, and in the end we covered a very similar range, 60-1500 µg/L instead of 10-1000 µg/L. We’re only really missing an analysis of how well the filters would work at low levels, around 10 µg/L. But RO devices that drive 40 µg/L to around 1 µg/L can also be expected to drive 10 µg/L way down low.

The only thing we would want to revisit in future studies is to test carbon filters at levels close to 10 µg/L; but our best bet is that they don’t do much at those levels either.

3.3 Doubles

We also caught one other problem. During analysis, we found that we made a mistake when mixing four of the concentrations. Twice as much lithium chloride as intended was added to the solutions for the PUR faucet mount at concentrations of 110 and 170 µg/L, and also for the Culligan faucet mount at 110 and 170 µg/L. As a result, these two filters were actually tested against ~210 µg/L and ~325 µg/L instead of the intended 110 and 170 µg/L. You can easily see this error if you look at the tables in the report. 

This is unfortunate and does complicate the data, but again it doesn’t seriously change the conclusions. Carbon filters don’t get much lithium out of tap water at any concentration, whether it’s 110, 170, 210, or 325 µg/L. There’s no reason to expect that the PUR and Cullighan faucet mounts would perform differently at these concentrations than at the intended ones — these results fit the overall result, which is that carbon filters aren’t good at removing lithium. 

3.4 Why’d You Have To Go And Make Things So Complicated? 

You may not be used to seeing scientific papers talk about mistakes the research team made, or the incorrect assumptions that showed up halfway through the project, or the weird random anomaly that doesn’t have an easy explanation. But the truth is that this is just what research looks like.

Academic researchers are expected to pretend like everything went perfectly and nothing weird happened, but this is not how actual research projects work. In real projects, especially where you’re trying to advance the frontiers of knowledge, you have to take chances, make mistakes, and yes, even get messy.

There are always going to be some accidents in any research project, and instead of sweeping them under the rug and pretending we never make mistakes, we’re going to talk about them. This not only is virtuous, it also puts you (readers) in a better position to form your own opinion about our results. It gives you a better sense of what to expect if you want to replicate or extend our results. And if we didn’t tell you about all the SNAFUs, we’d be giving you the wrong idea about what research is really like. 

And of course, it’s possible there are other mistakes we haven’t caught yet! We know that the best way to troubleshoot is to get as many eyes on the project as possible, which is why we put all our data and code online for you to see.

Obviously we want to avoid mistakes when we can, which is why we use techniques like randomizing sample order and including control samples to help prevent and diagnose mistakes. But this sort of thing happens, and it’s in everyone’s best interest to just publicly say “whoops, our bad”.

4. Conclusions

If you have the time and money, distillation is the best way to get lithium out of your water. The catch is that distillation is slow: distillation machines usually run at less than 1 liter per hour, a small fraction of the speed of other devices, and consume a lot of energy to get there. Distilling all of your cooking and drinking water with one of these machines would be very slow or very expensive or both.

For the average consumer, reverse osmosis is a much better choice. It’s cheaper and faster, and it works nearly as well as distillation does. For the average American, a RO system will ensure that you end up with less than 10 µg/L in your water, probably much less. 

Both of the RO systems we tested were under-sink units, meaning they go under your sink (duh) and create a stream of purified water that is separate from the actual tap. That way you wash your dishes with the high flow rate you’re accustomed to from a faucet, but fill your glass or make pasta with the separate stream of RO-filtered water.

You could also spring for a professional-grade household system that filters all the water that comes into your house, but there are a few complications. First off, while it should work basically the same as these under-sink units, we didn’t actually test a household system. Second, it’s got a much higher upfront cost and it would be more of a pain to install and maintain. Also keep in mind that typically only 20-50% of the water entering the RO unit actually leaves as clean, filtered water; the rest never makes it through the filter membrane and goes down the drain. Throwing away that much water for things like showering or washing your car would mean a lot of wasted water.

Finally, a whole-house RO system typically needs to be accompanied by a water softener, and we’re not sure if water softeners contain lithium or not. Water softeners operate by ion exchange, exchanging one Ca2+ or Mg2+ ion for two Na+ ions. You “regenerate” the system every so often by dumping a big bag of rock salt (NaCl or occasionally KCl) into the “brine tank”, which displaces the Ca/Mg off of the ion exchanger. If the salt being used for regeneration contains lithium, it would make its way into the drinking water just as readily as Na+. We haven’t tested any water-softening salt yet (though we might at some point), but we did test table salt as part of another project, and that definitely contains some lithium. 

Because of this, it’s not clear whether you’d end up drinking more or less lithium if you install a household RO system with a water softener. If you’re using a water softener without a RO system, you’re probably adding some lithium to your water, though we’re not sure how much. 

If you purchase water that was treated by RO or distillation (as many bottled waters are), it’s probably very low in lithium. But the catch here is that many companies put minerals back in, because pure water actually tastes kind of flat and metallic. Aquafina, for example, is first purified through RO before putting a pinch of salt back in for taste. If the pinch of salt contains lithium, you’re back to square one.


Thanks again to our anonymous donors, the Tiny Foundation, Sarah Jantzi, and Whylome for supporting this research. Finally, thank you for reading!