
Previous Philosophical Transactions:
Al Hatfield is a wannabe rationalist (his words) from the UK who sent us some data about water sources in Scotland. We had an interesting exchange with him about these data and, with Al’s permission, wanted to share it with all of you! Here it is:
Hi,
I know you’re not that keen on correlations and I actually stopped working on this a few months ago when you mentioned that in the last A Chemical Hunger post, but after reading your post today I wanted to share it anyway, just in case it does help you at all.
It’s a while since I read all of A Chemical Hunger but I think this data about Scottish water may support a few things you said:
– The amount of Lithium in Scottish water is in the top 4 correlations I found with obesity (out of about 40 substances measured in the water)
– I recall you predicted the top correlation would be about 0.5, the data I have implies it’s 0.55, so about right.
– I recall you said more than one substance in the water may contribute to obesity, my data suggested 4 substances/factors had correlations of more than 0.46 with obesity levels and 6 were more than 0.41.
Method
– Scottish Water test and record how much of up to 43 substances is in each reservoir/water source in Scotland https://www.scottishwater.co.uk/your-home/your-water/water-quality/water-quality
– their data is in pdf format but I converted it to Excel
– Scottish Water don’t publish Lithium levels online but I did a Freedom of Information request and they emailed it to me and I added it to the spreadsheet.
– I used the website to get the water quality data for a reservoir for every city/big town in Scotland and lined it up in the spreadsheet.
– I used Scottish Health Survey – Local Area Level data to find out what percentage of people are obese in each area of Scotland and then matched it as well as I could to a reservoir/water source.
– I then used the Data Analytics add-on in Excel to work out the correlations between the substances in the water and obesity.
Correlations with obesity (also in attachment)
Conductivity 0.55
Chloride 0.52
Boron 0.47
Lithium 0.47
Total Trihalomethanes 0.42
Sodium 0.42
Sulphate 0.38
Fluoride 0.37
Colony Counts After 3 Days At 22øc 0.34
Antimony 0.33
Gross Beta Activity 0.33
Total organic carbon 0.31
Gross Alpha Activity 0.30
Cyanide 0.26
Iron 0.26
Residual Disinfectant – Free 0.23
Arsenic 0.23
Pesticides – Total Substances 0.23
Coliform Bacteria (Total coliforms) 0.23
Copper 0.19
PAH – Sum Of 4 Substances 0.19
Nitrite 0.17
Colony Counts After 48 Hours At 37øc 0.16
Nickel 0.13
Nitrite/Nitrat e formula 0.13
Nitrate 0.12
Cadmium 0.11
Turbidity 0.08
Bromate 0.08
Colour 0.06
Lead -0.10
Manganese -0.12
Hydrogen ion (pH) -0.12
Aluminium -0.15
Chromium -0.15
Ammonium (total) -0.22
2_4-Db -0.25
Residual Disinfectant – Total -0.36
2_4-D -0.42
Dicamba -0.42
MCPB -0.42
MCPP(Mecoprop) -0.42
Scottish Water definition of Conductivity
Conductivity is proportional to the dissolved solids content of the water and is often used as an indication of the presence of dissolved minerals, such as calcium, magnesium and sodium.
Anyway, not sure if that’s any help to you at all but I enjoy your blog and thought I would send it in. Let me know if you have any questions.
Thanks
Al
Hi Al,
Wow, thanks for this! We’ll take a look and do a little more analysis if that’s all right, and get back to you shortly.
Do you know the units for the different measurements here, especially for the lithium? We’d be interested in seeing the original PDFs as well if that’s not too much hassle.
Thanks!
SMTM
Hi,
You’re welcome! That’s great if you can analyse it as I am very much an amateur.
The units for the Lithium measurements are µgLi/l. I’ve attached the Lithium levels Scottish Water sent me. I think they cover every water source they test in Scotland (though my analysis only covered about 15 water sources).
Sorry I don’t have access to the original pdfs as they’re on my other computer and I’m away at the moment. But I have downloaded a couple of pdfs online. Unfortunately the online versions have been updated since I did my analysis in late November, but hopefully you can get the idea from them and see what measurements Scottish Water use.
Let me know if you’d like anything else.
Thanks,
Al
Hey Al,
So we’ve taken a closer look at the data and while everything is encouraging, we don’t feel that we’re able to draw any strong conclusions.
We also get a correlation of 0.47 between obesity and lithium levels in the water. The problem is, this relationship isn’t significant, p = 0.078. Basically this means that the data are consistent with a correlation anywhere between -0.06 and 0.79, and since that includes zero (no relationship), we say that it’s not significant.
This still looks relatively good for the hypothesis — most of the confidence interval is positive, and these data are in theory consistent with a correlation as high as 0.79. But on the whole it’s weak evidence, and doesn’t meet the accepted standards.
The main reason this isn’t significant is that there are only 15 towns in the dataset. As far as sample sizes go, this is very small. That’s just not much information to work with, which is why the correlation isn’t significant. For similar reasons, we haven’t done any more complicated analyses, because we won’t be able to find much with such a small sample to work with.
Another problem is that correlation is designed to work with bivariate normal distributions — two variables, both of them approximately normally distributed, like so:
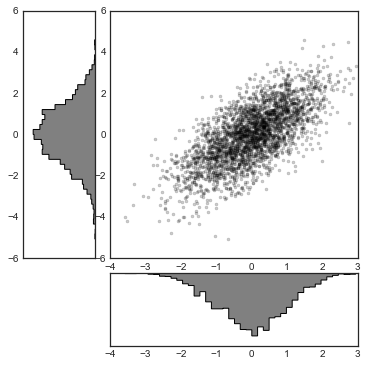
Usually this doesn’t matter a ton. Even if you’re looking at a correlation where the two variables aren’t really normally distributed, it’s usually ok. And sometimes you can use transformations to make the data more normal before doing your analysis. But in this case, the distribution doesn’t look like a bivariate normal at all:
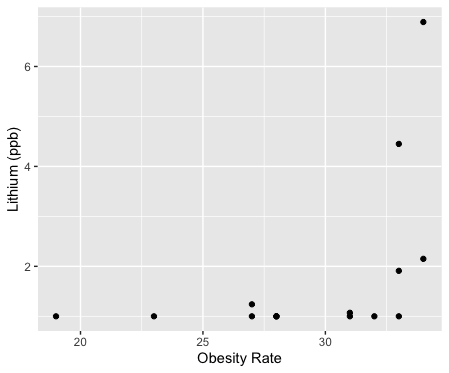
Only four towns in the dataset have seriously elevated lithium levels, and those are the four fattest towns in the dataset. So this is definitely consistent with the hypothesis.
But the distribution is very strange and very extreme. In our opinion, you can’t really interpret a correlation you get from data that looks like this, because while you can calculate a correlation coefficient, correlation was never intended to describe data that are distributed like this.
On the other hand, we asked a friend about this and he said that he thinks a correlation is fine as long as the residuals are normal (we won’t get into that here), and they pretty much are normal, so maybe a correlation is fine in this case?
A possible way around this problem is nonparametric correlation tests, which don’t assume a bivariate normal distribution in the first place. Theoretically these should be kosher to use in this scenario because none of their assumptions are violated, though we admit we don’t use nonparametric methods very often.
Anyways, both of the nonparametric correlation tests we tried were statistically significant — Kendall rank correlation was significant (tau = 0.53, p = .015), and so was the Spearman rank correlation (rho = 0.64, p = .011). Per these tests, obesity and lithium levels are positively correlated in this dataset. The friend we talked to said that in his opinion, nonparametric tests are the more conservative option, so the fact that these are significant does seem suggestive.
We’re still hesitant to draw any strong conclusions here. Even if the correlations are significant, we’re working with only 15 observations. The lithium levels only go up to 7 ppb in these data, which is still pretty low, at least compared to lithium levels in many other areas. So overall, our conclusion is that this is certainly in line with the lithium hypothesis, but not terribly strong evidence either way.
A larger dataset of more than 15 towns would give us a bit more flexibility in terms of analysis. But we’re not sure it would be worth your time to put it together. It would be interesting if the correlation were still significant with 30 or 40 towns, and we could account for some of the other variables like Boron and Chloride. But, as we’ve mentioned before, in this case there are several reasons that a correlation might appear to be much smaller than it actually is. And in general, we think it can sometimes be misleading to use correlation outside the limited set of problems it was designed for (for example, in homeostatic systems).
That said, if you do decide to expand the dataset to more towns, we’d be happy to do more analysis. And above all else, thank you for sharing this with us!
SMTM
[Addendum: In case anyone is interested in the distribution in the full lithium dataset, here’s a quick plot of lithium levels by Scottish Unitary Authority:
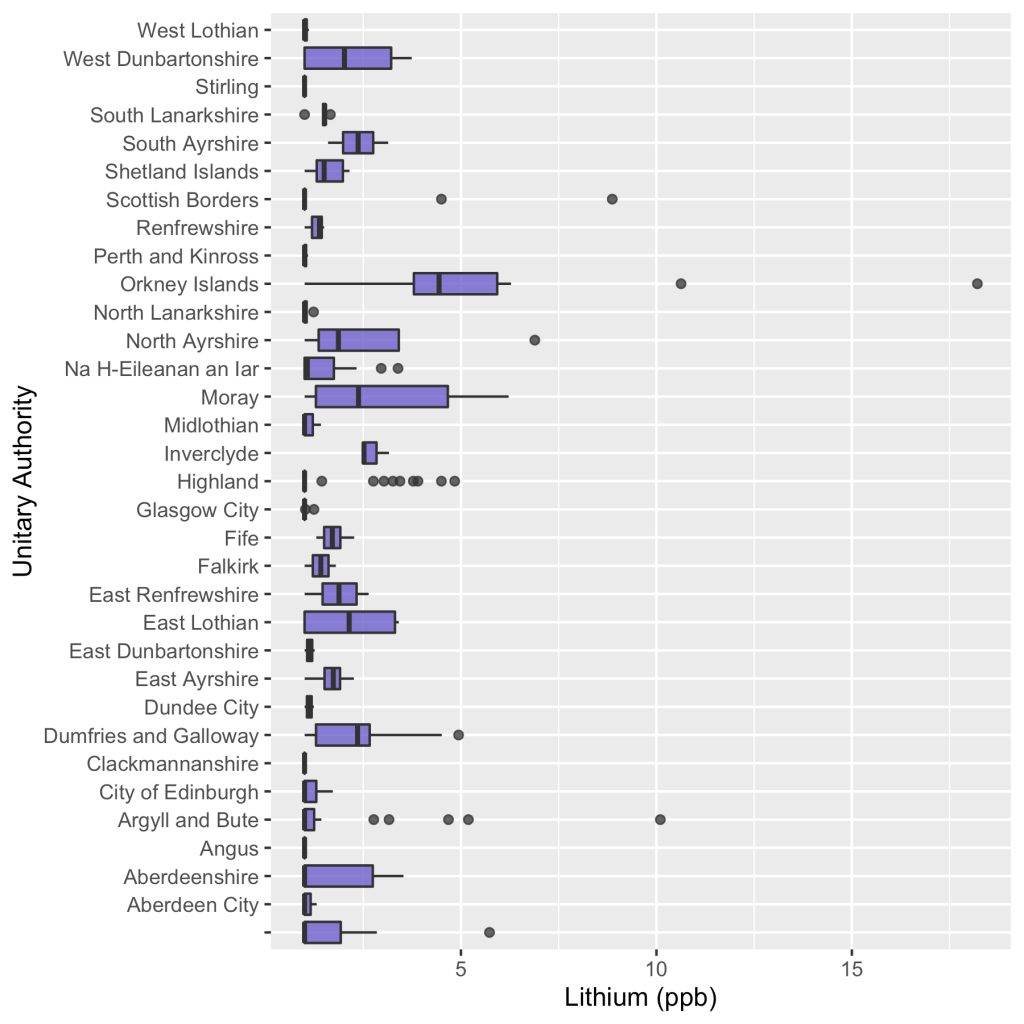
]
Thanks so much for looking at it. Sounds like I need to brush up on my statistics! Depending how bored I get I may extend it to 40 towns some time, but for now I’ll stick with experimenting with a water filter.
All the best,
Al

Different anions can cause a nutrient to act differently in the body. The amount of lithium carbonate required for psychiatric treatment starts around 600 mg usually, with the lowest dose available being 225 milligrams if one cuts at 450 tablet in half; it is scored so that one can do so.
However, people using lithium orotate and lithium aspartate use it at much lower dose, and although it isn’t worth paying for research on it, so everything is anecdotal, because lithium carbonate is so inexpensive, anecdotally people are using doses no higher than 40 mg for lithium orotate, and personally I do not go above 5 mg of lithium aspartate although I have some kidney malfunction that may affect my dose and reduce it.
What research I have seen suggests that the absorption is not so much the issue as the amount that stays for how long in the brain, as well as how much gets to the brain in the first place.
An example of anions being different can be found in George Eby’s research on types of zinc that do or don’t help the immune system, which can be found via pubmed.
Eby G. The mouth-nose biologically closed electric circuit in zinc lozenge therapy of common colds as explanation of rapid therapeutic action. Expert Rev Respir Med. 2012 Jun;6(3):251-2. doi: 10.1586/ers.12.17. PMID: 22788938.
https://www.tandfonline.com/doi/full/10.1586/ers.12.17
https://www.researchgate.net/publication/229080197_The_mouth-nose_biologically_closed_electric_circuit_in_zinc_lozenge_therapy_of_common_colds_as_explanation_of_rapid_therapeutic_action
https://pubmed.ncbi.nlm.nih.gov/22788938/
Only types of zinc that created positive ions were effective in this matter.
Different anions make a big difference, and my understanding is that lithium carbonate is not nearly as effective as other forms of lithium, and looking at 12 articles, on lithium in water, only one specified the types of lithium, and lithium carbonate was not mentioned.
I joke that magnesium isn’t magnesium. The threonate and acetyl taurate forms both cross the blood-brain barrier, and my recent experience suggests that threonate actually goes to the blood-brain barrier to create the correct permeability. Magnesium malate seems to prioritize itself more directly to enzymes, and the plain tourate form has been described in common articles as helping with cardiovascular conditions and diabetes. As far as Epsom salts go, magnesium sulfate, they seem merely to prioritize the person taking them to the bathroom, more effectively than any other form.
Until they start saying lithium carbonate, lithium aspartate, lithium threonate, lithium biglycinate, lithium orotate, and whatever other form they are describing, I can give no respect whatsoever to most research. It is like using data describing the actions of Donald Trump the ex-president of the United States and including the actions of Donald Kingsbury the science fiction author, just because their name is Donald.
LikeLike
Despite my comment about form, this is still an excellent start and very useful to me, specifically which towns have more lithium. Since the body adapts genetically over time to its environment, through mutations in the genes and through bookmarks in the jeans known as epigenes, if someone has ancestors that lived in the towns that were higher in lithium and then had children that moved to towns that were lower in lithium, they would have a detriment if they had adapted to it.
Adding lithium casually to water as has been suggested, especially the carbonate form, would be ignoring the fact that people with bad kidneys would be exposed to more of it.
The body uses zinc to remove both copper and lithium from the body, prioritizing it to removing lithium ahead of copper, leaving more copper in the brain but protecting the brain from it in some mechanism which science has not found in my hypothesis I will not elucidate yet publicly.
If too much copper is left in the body, the body can, if I understand the research, remove it in a process involving fat, which fat may end up staying on the body. therefore for people who have not adapted to the lithium in the water, moving to the towns where there was more lithium, their body could end up with an excess of copper and become more obese by using fat to remove it.
Since an alternative mechanism for handling excess copper is binding it to the catecholamine family of neurotransmitters, ending in adrenaline, this could explain the myth of the happy fat man. Rather than having excess adrenaline he eats more fat to get rid of his copper, and is happier than he was (up until death from obesity complications.)
So the research that shows less suicide, although not specifically male suicide which may be linked to zinc in the water instead, and less mental illness, less Alzheimer’s of course, and even less crime in areas where there is lithium in the water would apply to people whose bodies had adapted to it.
And the obesity which you have found, that would be people whose bodies had not adapted to it and moved into areas where there was lithium in the water and suddenly had extra copper that their bodies had to deal with.
Our bodies are different, and things like lithium that have a very narrow therapeutic range as a nutrient need to be respected as individualistic, so that it is a benefit for some people psychologically, and a detriment to others which seems to be more physical so far in the form of obesity, and since lithium clears through the kidneys, and the amount builds up in people with bad pit kidneys, potentially kidney problems and other problems as well.
People need to know whether they will have a benefit or a detriment. We need to be using the nutrients in the form of our ancestral waters, a problem for those of us who are mongrels, for optimum health.
LikeLiked by 1 person