
People have minds. Everyone’s mind is different, because they have different mental traits. Some people are more or less confrontational; some people are more or less energetic; some people are more or less neurotic.
Most mental traits are normally distributed. For example, extraversion looks something like this. Some people are very extraverted, some people are very introverted, but most people are somewhere in the middle.
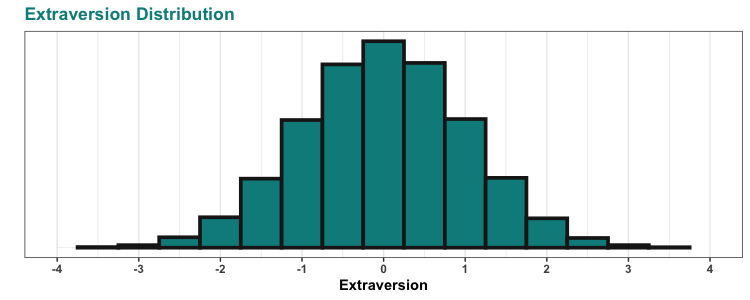
In this plot, the data are “normalized”, so the x-axis is by standard deviations. This is why it runs from negative to positive four — almost everyone falls within four standard deviations of the mean, which is represented as zero.
Most people have “typical” levels of extraversion. They like hanging out with friends but don’t go out and chase down strangers. They don’t want to live at the nightclub but they don’t want to go camp out in the library either.
But a small number of people have atypically high or low levels of extraversion. In statistics, we often set the threshold for extreme values at plus or minus 2 standard deviations. We can do the same thing here to indicate people who are very introverted or very extroverted:
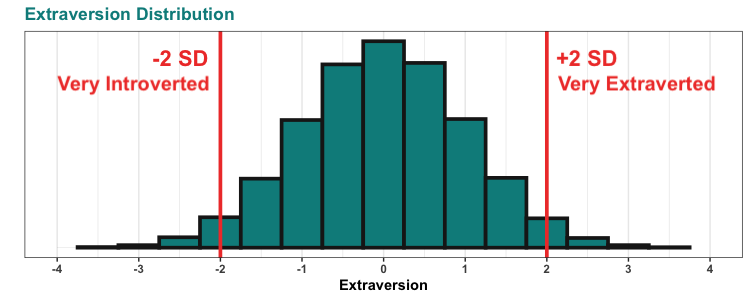
The cutoff is arbitrary — people who are 1.9 standard deviations above average are also very extraverted — but it lets us get a rough sense of how many people exist on both ends of the extremes. Because these traits are normally distributed, there isn’t going to be a point where people suddenly go from being typical to being very weird. People are just going to be progressively weirder and weirder as they get more extreme on each mental trait, and at some point we say, ok now they seem neurodivergent or whatever.
Because these traits are normally distributed, we can use what we know about the normal distribution to make pretty accurate guesses about how many people are beyond these arbitrary thresholds. We know that about 2.3% (more precisely, 2.275013%) of a normal distribution is above or below two standard deviations, so that means about 2.3% of people are super introverted, and about 2.3% of people are super extraverted.
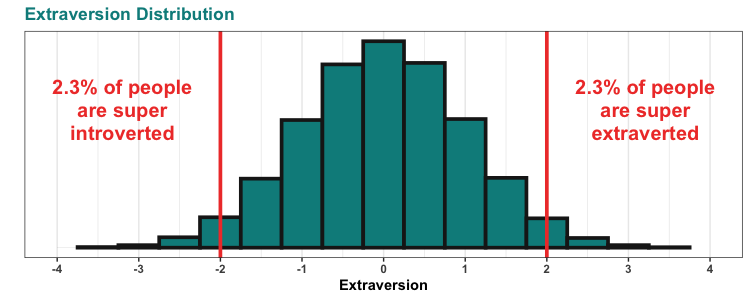
(This is also where the idea of 95% confidence intervals comes from, which is the same thing as p = .05 — it’s just talking about things that are more or less than two SD away from some value.)
Counting super introverted and super extraverted people as examples of being neurodivergent, this makes it look like 95.4% of the population is neurotypical, and only 4.6% is neurodivergent. But looking at one trait alone is misleading.
People’s minds have more than just one trait, so a person’s mind can be unusual in more than one way. You might be very typical in terms of extraversion, smack dab in the middle of the distribution — you have 4.6 close friends, you go to a party every 22.3 days, and when you’re there, you always have 3.4 alcoholic drinks. But that doesn’t mean your mind is typical in other ways.
If you examine two mental traits, about 9% of the population will be at least two standard deviations from the mean on at least one of them. Here’s a simulation of 10,000 people with two totally unrelated, normally-distributed mental traits. People who are within two standard deviations of average for both traits are in teal, and anyone who is more than two standard deviations from the mean on either trait is in red:
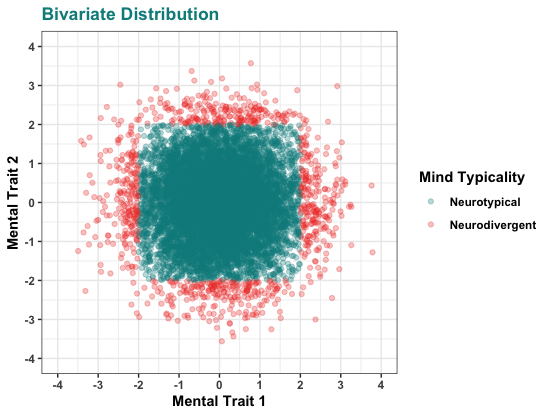
With just one mental trait, only 4.6% of people have atypical minds. But with two traits, about 9% are atypical on either one trait or the other. Even so, most people won’t stand out for being total weirdos. Only 0.2% are atypical on both traits.
It’s easy enough to extend this to more traits. In a group with three orthogonal (uncorrelated) mental traits, 14% would be extreme on at least one trait, and about 0.6% would be extreme on two or more. In a group with four orthogonal mental traits, 17% would be extreme on at least one trait, and about 1% would be extreme on two or more.
The Big Five personality traits (openness to experience, conscientiousness, extraversion, agreeableness, and neuroticism) are a set of mental traits covering the bulk of a person’s personality (at least in theory). They are, if not entirely uncorrelated, at least largely unrelated. Extending the previous analyses to a set of five mental traits suggests that about 21% of people are “abnormal” on at least one of their personality traits
According to our calculations, the crossing-over point is 14 mental traits. At 14 traits, just over 50% of the population is unusual (± 2 SD) on at least one mental trait, and 13% are unusual on two or more. This seems pretty conservative — probably there are more than 14 ways people’s minds can be different from one another.
We won’t bore you with every single simulation — let’s cut to the chase. If we make a model with 100 different mental traits, we find that 99% of people are unusual (± 2 SD) in at least one way, and most people are unusual in multiple ways — the median number of weird traits to have is 4. In this simulation, only 1% of people are totally “neurotypical”, having no mental traits more than two standard deviations from the population mean.
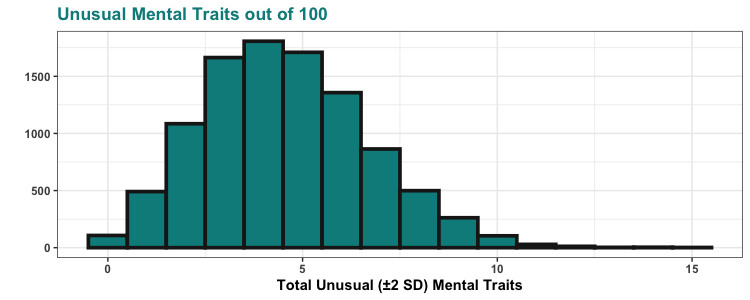
This is our beef with the term “neurotypical”. It’s true that some people’s minds are more typical than others’. But almost no one has a mind that is typical on all axes. In this model, only about 1% of the population is neurotypical (less than 2 SD from the mean) on all 100 traits. From this perspective, being “normal” is itself unusual. A full 23% of people have at least one trait that is EXTRA extreme, more than three standard deviations above or below the mean.
Physicians, bless them, already know about this one. Wulff, Pedersen, & Rosenberg, in their 1990 book Philosophy of Medicine: An Introduction, point out that the same thing happens any time you apply lots of tests to the same person:
What most clinicians do when they receive a laboratory report is, of course, to look up the normal range for the tests in question. … Traditionally, a normal range is calculated in such a way that it includes 95% of the results found in a group of normal or healthy persons, and, consequently, there is a 5% risk that a healthy person will present with an abnormal laboratory result. Then, imagine that you do ten tests on a normal person. In that case the risk that at least one of these tests is abnormal is (1 – 0.9510) which amounts to 0.40 or 40%. If you do twenty-five tests (and that is not unusual in clinical practice), this chance is 72%! As Edmond A. Murphy puts it so aptly, ‘Therefore, a normal person is anyone who has not been sufficiently investigated.’
Correlated Traits
So far we’ve been assuming that all mental traits are totally uncorrelated, but we know that’s not true. Many mental traits are somewhat related (for example, anxiety and depression), so if you’re typical in one way, you are more likely to be typical in some other way as well.
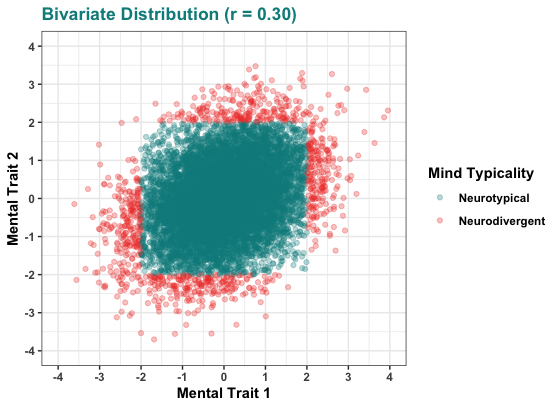
Even so, the pattern we saw before holds even when mental traits are correlated. If two mental traits are correlated at r = 0.30, the number of people that are unusual on at least one of them is still about 9%:
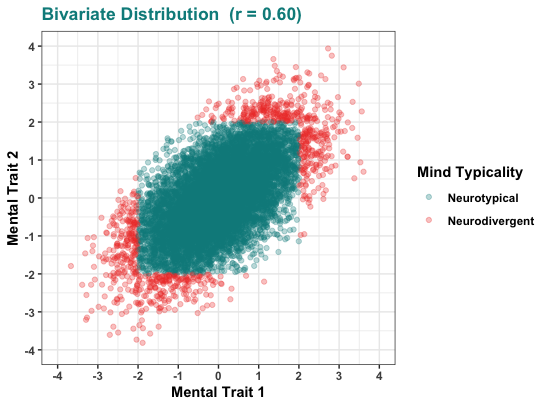
Even when two mental traits are correlated at r = 0.6, pretty high for a correlation in psychology, around 8% of people are unusual on at least one of the traits:
Calculations for a larger number of mental traits, all correlated with one another, is an exercise left to the reader.

visual imagination is an interesting thing that people diverge in. some people have no visual imagery at all, and others self describe as having extremely vivid visual daydreams. at least to the people i’ve known, it seems somewhat tied to memory / recall as well.
LikeLiked by 1 person
True story!
By the way, it’d be sweet if your site had an optional dark theme, for those of us reading these articles at night 🙂
LikeLiked by 1 person
If you’re using a Chromium-based browser, you can turn on the Auto Dark Mode for Web Contents flag and all sites will be in dark mode. It doesn’t work well with every site, but with most of them (including this one) it does.
LikeLike
I’m can recommend the “Dark Reader” extension (available for all major browsers) – is makes the entire web appear in dark mode. I didn’t even realize this blog was not dark mode originally.
LikeLike
I would suggest that mental traits correlate in clusters. You might call those clusters “personality types.”
I’d further suggest that “personality types” will tend to gravitate towards socioeconomic roles that are suited to their cognitive strengths and/or avoid their cognitive weaknesses.
Finally, I’d conclude by suggesting that personality types that gravitate towards socioeconomic roles that grant status or authority will have an outsized impact in defining what is generally perceived as “neurotypical” vs. “neurodivergent.”
Bonus speculation: Personality types that gravitate to status and authority don’t give a rat’s ass about your scatterplots.
LikeLike
> Finally, I’d conclude by suggesting that personality types that gravitate towards socioeconomic roles that grant status or authority will have an outsized impact in defining what is generally perceived as “neurotypical” vs. “neurodivergent.”
how does this reconcile with the tendency to portray billionaires as eccentric? is it strictly “eccentric by choice”?
LikeLike
I generally agree with the argument, but one nitpick: Just because a trait is normally distributed, doesn’t mean that the associated “weirdness” is normally distributed as well. Randolph Nesse refers to this as fitness cliffs with regard to natural selection pressure.
So the weirdness might be skewed enough to imply a category (though to my knowledge, newer taxonomies of psychopathology relating to the Big 5 do not find many, if any, categories either – they do seem to find a general factor of psychopathology though, indicating some correlation between the dimensions).
LikeLike
There’s a geometric intuition related to this that I find useful: “In high dimensions almost all the mass of an object is very close to the boundary (for most objects)”.
LikeLike
That’s an interesting way of thinking of it 🙂
LikeLike
I think it’d make the article stronger to explain that the field of statistics already has plenty of ways to account for the multiple comparisons problem, such as the Bonferroni correction (among others).
LikeLike