We agree with ExFatLoss that the mysteries of obesity fit seed oils pretty well. This is part of why when we investigated seed oils in Interlude E (as ExFatLoss mentions) we took them seriously as a hypothesis.
There is room for multiple theories at once. Disagreement and uncertainty at this stage is normal/healthy and it just shows that this is an area where we still don’t understand everything. We can entertain seed oils as a possible explanation, whereas things like “diet and exercise” are non-explanations. And it’s quite possible that many things contribute at once. If any single cause could potentially explain half of the obesity increase since 1970, or even just 25%, that’s still a big deal.
We also really like this passage, which we think bears reproducing:
By the way, I find the way scientists talk about the “cafeteria diet” to be mystical to the point of being comical. Really, you couldn’t recreate lab chow that made the rats as obese as the human cafeteria diet? Weird, the cafeteria managed to do it.
They somehow imbue “human junk food” with a mystical, obesogenic property that cannot be explained by the sum of its parts, almost like the immortal soul. Please. You could start by differentiating fatty acids.
But despite the good fit with the first 8 mysteries, we’re still not convinced that the seed oil hypothesis is a fit for the evidence overall. In this post we try to explain why.
7 Out of 8 Ain’t Bad, But This is Out of 10
If we wrote A Chemical Hunger today, Part I would include 10 mysteries, not 8. And one problem with the seed oil hypothesis is that while it provides a pretty good fit to 7 of the 8 original mysteries, it doesn’t match the two new ones.
ExFatLoss pays special attention to the map of obesity in the US (below) which shows a relationship between obesity and elevation. He suggests that could be explained if lower levels of oxygen found at higher altitudes compensate for the damage seed oils do to your metabolism (presuming seed oils do damage to your metabolism, of course), but he admits that this is “not exactly a slam dunk”.
We take some issue with this interpretation. The mountain ranges definitely stand out as less obese, but the distribution of obesity is not actually a great match with altitude. Low-lying areas of Florida, Massachusetts, and California, for example, also have very low rates of obesity.
This is why we prefer an interpretation based on the length of the watershed, which we think is a proxy for the levels of some contaminant in the water. Longer watersheds have more of a chance to pick up the contaminant, and to pick up more of it, assuming there is any contamination in their higher reaches.
In this model, these regions of Florida, Massachusetts, and California are not obese because while they are low-elevation, they are also at the end of very short watersheds, which probably don’t contain much contamination. In some cases (like Boston and San Francisco), the water is piped from pristine wilderness reservoirs deep in the mountains.
But that map is one thing. A theory of obesity should also be able to explain this map:
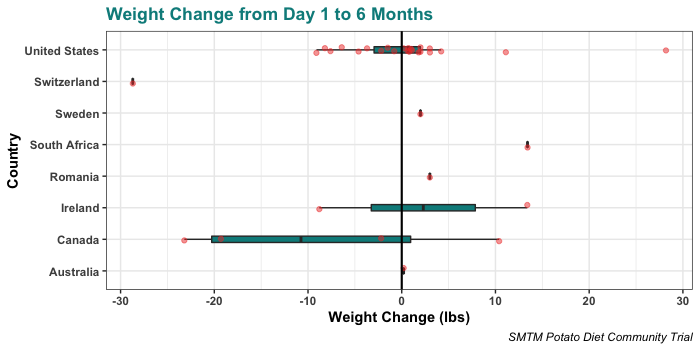
Mystery 9 is that there is a lot of international variation — some countries are much more obese than others. The most obese nations on Earth are all tiny Pacific Islands. The Middle East is by far the most obese region in the world. The next runners-up are the USA, Canada, and Australia. And these are just the highlights — ideally a theory would be able to explain the whole pattern that appears on the map.
Seed oils would seem to have a hard time accounting for this pattern, though of course we’re open to explanations. But if Kuwait loves seed oils in a way that Pakistan doesn’t, well, we haven’t heard about it.
In comparison, this mystery is one reason to prefer the lithium hypothesis. You see, fossil fuels are often accompanied by horrible brines, brackish and sometimes radioactive water that is brought to the surface as the oil and gas are extracted. Many of these brines, especially in arid regions, are extremely high in lithium. Despite industry promises, huge volumes of brine are regularly spilled or otherwise improperly disposed of (or sometimes just intentionally used to irrigate crops), and this is a huge source of lithium contamination. We cover this all in more detail in Interlude G, if you want to read more.
So under the lithium hypothesis, the US, Middle East, Canada, and Australia are all unusually obese because they are all major oil producers, producing from oilfields in arid climates, which have brines high in lithium, leading to major contamination. Major oil producers like Russia and Norway are not very obese because their oilfields are not in arid climates, so their brines probably are not high in lithium, leading to much less contamination (and/or their oilfields are remote enough, or offshore enough, that the contamination doesn’t reach their populations). If this is the case, the map of obesity should roughly line up with the map of oil production, which it does:
The remainder of the international pattern can be explained by other fossil-fuel mining (coal, for example, is also often high in lithium), other forms of intensive mining that might also stir up lithium, countries importing most of their food from one of these high-lithium countries (remember that the US is a major food exporter), and possibly some other sources like desalination.
Mystery 10 is the variation of obesity rates between professions. Some professions are much more obese than others. Truck drivers, mechanics, firefighters, and transportation workers, for example, tend to be especially obese. Meanwhile teachers, lawyers, engineers, and “health diagnosing occupations”, as four more examples, are much less obese than average.
The two main sources for these patterns are this survey of more than 37,000 workers from the Washington State Department of Labor and Industries and this 2004-2011 NIH survey of US workers, if you want to take a closer look at the details. People often write this off as being about race or class, but the NIH analysis finds the same general patterns within each race, and many professions at similar class levels have very different rates of obesity.
Again, it seems difficult for the seed oil hypothesis to explain this pattern. Stereotypes about truck drivers aside, do we really think that mechanics consume that much more canola oil than lawyers?
And again, we see this as another reason to prefer the lithium hypothesis. There are some exceptions, but overall the ranking of professions by obesity rates looks like a pretty good proxy for “amount of exposure to vehicles and heavy machinery”, and lithium grease is the most common lubricating grease used in vehicles and heavy machinery.
We should be clear that this doesn’t leave the seed oil hypothesis totally dead in the water. A theory doesn’t have to fit all 10 mysteries to be correct. For example, the obesity epidemic could have multiple causes — maybe seed oils caused much of the baseline increase and something else is responsible for the variation internationally and between professions. It’s still possible that this is massively multicausal.
And as we’ve previously written about, reality is very weird and full of bizarre exceptions. Maybe truck drivers and other people who work around vehicles are more obese because ExFatLoss is right and oxygen levels make a difference, and people who are breathing exhaust all day get less oxygen. There’s always a way to add epicycles to save a theory, and sometimes those epicycles are actually correct.
But that said, the fact that seed oils don’t fit these two mysteries is still a strike against the hypothesis.
It Doesn’t Fit Case Studies
Our second gripe is that the seed oil hypothesis doesn’t fit a number of individual and population-level case studies.
N=1: Krinn & M
The seed oil hypothesis doesn’t fit the self-experiment case study of Krinn, who has lost weight taking large doses of potassium. Krinn hasn’t changed her seed oil intake.
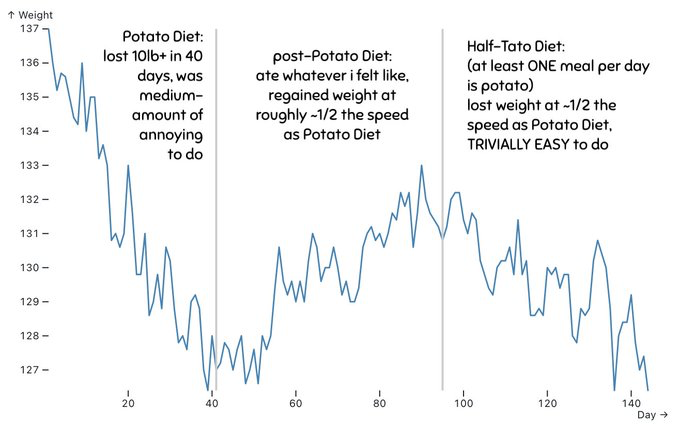
The seed oil hypothesis doesn’t fit the successful half-tato dieters, the best example of which comes from our reader M. He ate more potatoes, but he was still consuming seed oils like normal, and he talks about this pretty explicitly in his report:
I tossed my diced potatoes in olive oil before air frying, and more generally used olive oil, duck fat and avocado oil to cook other potato preparations. I probably used 1-2 “glugs” of oil per 1-1.5lb potatoes across these preparations (“lightly greased”, call it). And of course in my non-potato meals, I consumed whatever oil – and other ingredients – restaurants would be using to cook their food. Given my diet was substantially made up of non-potato meals that I actively tried to keep “as before”, I think it is a safe bet that there wasn’t any particular type of food (diary, oil, red meat, etc.) I stopped consuming, or even materially reduced my consumption in, as a result of potatoes by default (beyond the generic ~1/3 reduction from swapping out a third of my meals to be mostly potato).
Pima
The seed oil hypothesis really doesn’t fit the case of the Pima (who we wrote about here and here). This group had a remarkably high rate of obesity in the 1960s, and we have no reason to believe they were exposed to any more seed oils than other Americans. However, we do know that their water contained 50-100x more lithium than the median dose in American municipal water sources at the time. At least one of their food plants was found to concentrate lithium in its berries, so they probably got an even higher dose from their food.
Frankly this case study is hard to account for by anything but the lithium hypothesis, which is part of why we so strongly prefer that hypothesis. Sievers & Cannon, writing in 1973, even say, “It is tempting to postulate that the lithium intake of Pimas may relate … to relative physical inactivity and high rates of obesity and diabetes mellitus.”
Fattest and Leanest Places in America
The seed oil hypothesis also doesn’t account for the pattern of fattest and leanest places in America. We can’t see any reason why Charleston, WV would be eating more seed oils than Bridgeport, CT. But we can see a reason why Charleston, WV would be exposed to unusual levels of lithium — because it’s a famous site for the prospecting of salt brines, including brines that as far as we can tell are unusually high in lithium.
We are still kind of freaked out by how well the pattern of fattest and leanest places fits the lithium hypothesis. The #1 most obese community in America is downstream from three coal power plants that are well-documented to be leaking lithium into the groundwater. The #2 most obese community sits on an aquifer that is unusually high in lithium. The #5 most obese community is in an area with many oilfield brine spills. The #6 most obese community (Charleston, WV) is, as we mentioned, a famous brine extraction site. The #7 most obese community is the site of a lithium plant that recently exploded. So is the #10 most obese community — it’s home to another lithium plant that, yes, also exploded.
Read our full report in Interlude I for all the gory details, but when you look at the most and least obese communities in America, you find a pattern that looks like fossil fuel activity and industrial lithium accidents. You don’t see a pattern that looks like canola oil taste testing.
It Would be Easy to Test
No one believes that carrot juice can cure cancer. If it did, anyone could give some cancer patients a bit of carrot juice, effortlessly cure them, use those case studies to raise money for a clinical trial, then pass go and collect their $200 billion and Nobel prize in Physiology or Medicine. We can dismiss out of hand anyone who says that carrot juice does have such wonderful qualities — if it did, they would be out there demonstrating those qualities, not arguing with us.
Our point is, the easier it would be to collect evidence that a theory is correct, the less seriously we should take the theory in the absence of that evidence. As far as we can tell, if the seed oil hypothesis were correct, it would be easy to get evidence for it. So until seed oil theorists can present that evidence, we’re not inclined to take the seed oil hypothesis very seriously.
We’re not saying this as a dig — we’re saying this to encourage seed oil believers to go out there and collect that sweet, strong evidence, if they think they can get it.
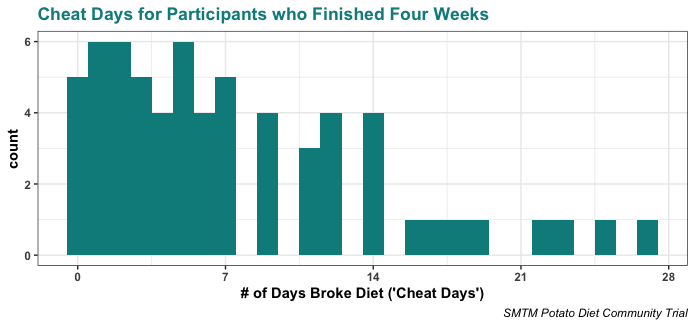
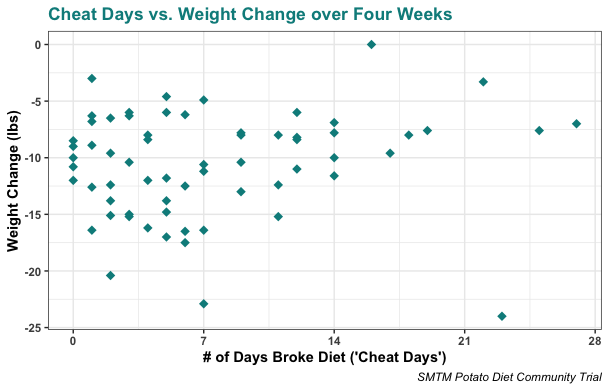
The easiest test that comes to mind would be a variation of the potato diet. We know that people lose weight on the potato diet, and the seed oil theorists presumably think that this is because the potato diet is also a seed-oil-elimination diet. People on the potato diet do take some cheat days, but they’re surely consuming a lot less seed oil than usual, maybe close to zero.
It would be easy to run a variation of the potato diet where half the participants are randomly assigned to eat their potatoes with butter, and the other half are randomly assigned to eat their potatoes with sunflower oil. (Or substitute these for whatever fats the seed oil theorists think are best and worst.) If the seed oil theory is correct, then the participants eating potatoes + butter should lose weight much faster than the participants eating potatoes + sunflower oil. If the seed oil theory is wrong, there should be basically no difference.
Ideally you would go on to test more than just two fats — butter and sunflower oil differ in more ways than just how much linoleic acid they contain! But starting with two would be fine, and it would give us an idea of whether or not there’s anything worth looking into here.
If the potato diet offends you for some reason, you could do the same thing with any other elimination diet, or any other weight-loss protocol that we know to be effective. For example, ExFatLoss could add various fats to his ex150 protocol, the same amount of a new fat every week, and see if some fats stall his weight loss and other fats don’t.
Again, WE don’t think that this would shake out in favor of the seed oil hypothesis, which is why we don’t want to run the study ourselves. But if you feel differently, you should try to prove us wrong.
We want to emphasize that even if one of these studies did find a difference between seed oils and other fats, that wouldn’t be evidence for a specific mechanism — it wouldn’t necessarily point to linoleic acid. For example, it could be pesticides; some of these crops like grapeseed and soybeans and sunflowers might be sprayed with the same pesticide, and that might be the cause of the difference. Hell, it could still be lithium. There’s some evidence that sunflowers concentrate lithium (though “the lowest concentrations [occur] in the seeds”), so it’s possible that there’s more lithium in sunflower oil than in butter. If we need to, we can test for these things.
So this kind of study should be able to point to seed oils pretty easily — and if you’re a seed oil believer, you should try to make one of these studies happen. But if it does point to seed oils, that still doesn’t provide strong evidence for why seed oils might cause obesity. That would remain to be seen, though we would certainly be closer to an answer.
To recap: lots of things make the seed oil hypothesis an attractive explanation, and we’re still open to the idea. But right now it doesn’t seem very consistent with the evidence, and changing our mind would require addressing some of these apparent contradictions.
[This is one of the finalists in the SMTM Mysteries Contest, by a reader writing under the pseudonym Cennfaeladh. We’ll be posting about one of these a week until we have gotten through all the finalists. At the end, we’ll ask you to vote for a favorite, so remember which ones you liked.]
[UPDATE: Now that the contest is over, we reveal that the author of this post is niplav, who blogs at niplav.site]
I investigate whether the attention span of individual humans has been falling over the last two decades (prompted by curiosity about whether the introduction of the internet may be harmful to cognitive performance). I find little direct work on the topic, despite its wide appeal. Reviewing related research indicates that individual attention spans might indeed have been declining65%.
In what might be just the age-old regular ephebiphobia, claims have been raised that individual attention spans have been declining—not just among adolescents, but among the general population. If so, this would be quite worrying: Much of the economy in industrialized societies is comprised of knowledge work, and knowledge work depends on attention to the task at hand: switching between tasks too often might prevent progress on complicated and difficult problems.
I became interested in the topic after seeing several claims that e.g. Generation Z allegedly has lower attention spans, observing myself and how I struggled to get any work done when connected to the internet, and hearing reports from others online and in person having the same problem.
The exact question being asked is:
“Have the attention spans of individuals on neutral tasks (that is, tasks that are not specifically intended to be stimulating) declined from 2000 to the present?”
(One might also formulate it as “Is there an equivalent of the “Reversed Flynn Effect” for attention span?”) I am not particularly wedded to the specific timeframe, though the worries mentioned above assert that this has become most stark during the last decade or so, attributing the change to widespread social media/smartphone/internet usage. Data from before 2000 or just the aughts would be less interesting. The near-global COVID-19 lockdows could provide an especially enlightening natural experiment: Did social media usage increase (my guess: yes90%), and if so, did attention spans decrease at the same time (or with a lag) (my guess: also yes75%), but I don’t think anyone has the data on that and wants to share it.
Ideally want to have experiments from ~2000 up to 2019: close enough to the present to see whether there is a downward trend (a bit more than a decade after the introduction of the iPhone in 2007), but before the COVID-19 pandemic which might be a huge confounder, or just have accelerated existing trends (which we can probably check in another 2 years).
I am mostly interested in the attention span of individual humans and not groups: Lorenz-Spreen et al. 2019 investigate the development of a construct they call “collective attention” (and indeed find a decline), but that seems less economically relevant than individual attention span. I am also far less interested in self-perception of attention span, give me data from a proper power- or speed-test, cowards!
So the question I am asking is not any of the following:
“Does more social media/internet usage cause decreased attention spans?”
“Does more social media/internet usage correlate with decreased attention spans?”
“Does more social media/internet usage correlate with people reporting having shorter attention spans?”
“Did collective attention spans decrease?”
“Are people on average spending less time on webpages than they used to?”
How Is Attention Span Defined?
Attention is generally divided into three distinct categories: sustained attention, which is the consistent focus on a specific task or piece of information over time (Wikipedia states that the span for sustained attention has a leprechaun figure of 10 minutes floating around, elaborated on in Wilson & Korn 2007); selective attention, which is the ability to resist distractions while focusing on important information while performing on a task (the thing trained during mindfulness meditation); and alternating or divided attention, also known as the ability to multitask.
When asking the question “have attention spans been declining”, we’d ideally want the same test measuring all those three aspects of attention (and not just asking people about their perception via surveys), performed annually on large random samples of humans over decades, ideally with additional information such as age, sex, intelligence (or alternatively educational attainment), occupation etc. I’m personally most interested in the development of sustained attention, and less so in the development of selective attention. But I have not been able to find such research, and in fact there is apparently no agreed upon test for measuring attention span in the first place:
She studies attention in drivers and witnesses to crime and says the idea of an “average attention span” is pretty meaningless. “It’s very much task-dependent. How much attention we apply to a task will vary depending on what the task demand is.”
Perhaps I should soften my tone, as this perspective appears elsewhere:
[…] Gould suggests the metaphor of a dense bush whose branches are periodically pruned by nature. This allows for parallel evolutionary sequences, some of which are adaptive and others not — at any moment in time only the tips of aseledaptive branches are in evidence, the pruned ones cannot be seen. Thus rather than being direct descendants of primitive hominids, for example, huankind would have evolved along a separate but parallel line from other primates.
Might the ontogeny of selective attention recapitulate this theme? That is, rather than selective attention comprising a single construct with a fixed ontogenic plan, might it be better conceptualized as a multidimensional construct with separat, parallel developmental trajectories for different components. To carry the analogy still further, might the specific developmental progression for a particular component of selective attention be determined by the adaptive fit of that component with the individual’s ‘environmental press’? Although such a conjecture rekindles the tened of ontogeny recapitulates phylogney long since abandoned in physiological development (e.g., Dixon and Lerner, 1985), we suggest that it may nonetheless provide an overarching framework within which to cast life-span research and theory on the development of selective attention.
One of my hopes was that there is a canonical and well-established (and therefore, ah, tested) test for attention span (or just attention) à la the IQ test for g: If so, I would be able to laboriously go through the literature on attention, extract the individual measurements (and maybe even acquire some datasets) and perform a meta-analysis.
Continuous Performance Tests
For measuring sustained and selective attention, I found the family of continuous performance tests, including the Visual and Auditory CPT (IVA-2), the Test of Variables of Attention (T.O.V.A.), Conners’ CPT-III, the gradCPT and the QbTest, some of which are described here. These tests usually contain two parts: a part with low stimulation and rare changes of stimuli, which tests for lack of attention, and a part with high stimulation and numerous changes of stimuli, which tests for impulsivity/self control.
Correct detection: This indicates the number of times the client responded to the target stimulus. Higher rates of correct detections indicate better attentional capacity.
Reaction times: This measures the amount of time between the presentation of the stimulus and the client’s response.
Omission errors: This indicates the number of times the target was presented, but the client did not respond/click the mouse. High omission rates indicate that the subject is either not paying attention (distractibility) to stimuli or has a sluggish response.
Commission errors: This score indicates the number of times the client responded but no target was presented. A fast reaction time and high commission error rate points to difficulties with impulsivity. A slow reaction time with high commission and omission errors, indicates inattention in general.
I’m currently unsure about two crucial points:
How much does any CPT measure the concept we naively call attention span? The papers I’ve read don’t refer to attention span per se, but a general capability of sustained and selective attention.
Are there any time-series analyses or longitudinal studies using a CPT, or alternatively meta-analyses using data collected from existing studies? I have not been able to find any.
Other Heterogenous Metrics
I also attempted to find a survey or review paper on attention span, but was unsuccessful in my quest, so I fell back to collecting metrics for attention span from different papers:
Three online tests (probably devised by the authors (?), since no source is given) (n≈2000 Canadians). Very little information about the exact nature of the tests.
Sustained attention span: “Counting the number of times responds correctly identified an X occurring after an A.”
Selective attention span: “Counting the number of times respondents correctly identified a change in the orientation of the rectangles”
Alternating attention span: “Calculating the difference in the time lapsed to perform a series of consecutive number or letter classification, compared to a mixture of number and letter classifications.”
Neurological research: The same games/tests as above with the participants being measured with an EEG (“Results were reported as ACE (Attention, Connectivity, Encoding) scores, as well as the number of attention bursts”) (n=112 Canadians)
Questionnaire developed by the authors based on Conners 2004 (reliability: α=0.786)
Wilson & Korn 2007 report several different measures of attention span during lectures: the amount of notes taken over time, observation of the students by an author of one study or two independent observers in another study, retention of material after the lecture, self-report in 5-minute intervals during the lecture, and heart rate. They also note that “Researchers use behaviors such as fidgeting, doodling, yawning, and looking around as indicators of inattentiveness (e.g., Frost, 1965; Johnstone & Percival, 1976).”
Plude et al. 1994 review how selective attention develops during a human life. For measuring attention, they mainly focus on studies using reaction time as a metric—the speed at which an action occurs as a result of a changing stimulus: eye movement patterns of infants, simple tests such as pressing a button on a changing (often visual) stimulus, the influence of irrelevant visual stimuli at the periphery on a task performed at the centre of the visual field, judging similarity of stimuli at various distances in the visual field, responding to a target stimulus surrounded by interfering distractor stimuli, and determining whether a visual target item is present or absent. They also mention skin conductance (measuring arousal).
They also mention studies investigating the time required for attentional switching in acoustic contexts: “Pearson and Lane (1991a) studied the time course of the attention-shifting process between lists and also found large age-related improvements between 8 and 11 years. Whereas 8-year-olds required more than 3.5 s to completely switch from monitoring one list to another, 11-year-olds and adults appeared to complete the switch in less than 2.5 seconds.”
This is not an adequate metric, I believe: It would also decline if people would become better at prioritising on which websites are more worthy of their attention.
Time that specific pieces of information (hashtags/n-grams/Reddit submissions &c) were popular
As it stands, I think there’s a decent chance60% that one or several tests from the CPT family can be used as tests for attention span without much of a problem.
I don’t think a separate dedicated test for attention span exists45%: The set of listed measures I found (apart from the CPT) appears to be too heterogenous, idiosyncratic, mostly not quantitative enough and measuring slightly different things to be robustly useful for a meta-analysis.
What Are the Existing Investigations?
A lack of long-term studies means we can’t tell whether attention spans have actually declined.
Do younger people perform worse on the sustained attention span test?, Yes (31% high sustained attention for group aged 18-34, 34% for group aged 35-54, and 35% group aged 55+) (the methodology is wholly unclear here, though: how do we determine the group that has “high sustained attention span”? Did they perform any statisitical tests? If yes, which?).
Do people who report more technology usage (web browsing/multi-screen usage while online/social media usage/tech adoption) perform worse on the sustained attention span test?, Yes. Light:medium:heavy usage for web browsing has 39%:33%:27% users with high sustained attention span, 36%:33%:27% for light:medium:heavy multi-screen usage, 36%:29%:23% for light:medium:heavy social media usage and 35%:31%:25% for light:medium:heavy tech adoption (though these numbers are basically not elaborated on).
Selective attention:
Do younger people perform worse on the selective attention span test? No (34% high selective attention for group aged 18-34, 30% for group aged 35-54, and 35% group aged 55+).
Do people with high selective attention use fewer devices at the same time? Yes (details p. 31).
Alternating attention:
Do younger people perform worse on the alternating attention span test? No (36% high selective attention for group aged 18-34, 28% for group aged 35-54, and 36% group aged 55+).
Do people who report more technology usage (tech adoption/web browsing/multi-screen usage while online) perform worse on the alternating attention span test? No, they seem to perform better: Light:medium:heavy tech adoption corresponds to 31%:39%:40% having high alternating attention spans, light:medium:heavy web browsing to 29%:34%:37% and multi-screening while online to 27%:32%:37%.
Do people who use social media more have higher Attention/Connection/Encoding scores on EEG measurements?, Not quite: “Moderate users of social media are better at multi-tasking than lower users. But, when crossing into the top quartile of social media usage, scores plummet.”
This is a marketing statement wearing the skinsuit of a previously great paper, it would be awesome if they released their exact methodology (tests performed, data collected, exact calculations & code written). I can smell that they actually put effort into the research: Creating an actual test instead of just asking respondents about their attention spans, doing EEG measurements of over 100 people, for 3 different types of attention…come on! Just put out there what you did!
Is self-reported attention span related to the number of social media accounts?, No, not statistically significant (F(2, 206)=0.1223, p>0.05) (via a one-way ANOVA)
Is self-reported attention span related to whether a respondent mainly uses a mobile phone or a computer?, No, not statistically significant (P(2,713)=0.923, p>0.05) (via a one-way ANOVA)
I do not trust this paper: Calling (what I think is) Generation Z “Generation D” (without source for the term), being clearly written in Word, and confusing grammar (I think the authors are all Americans, so no excuse here):
Users that are older such as late adolescents and emerging adults average approximately 30-minutes daily for just Facebook that does not calculate the time spent on all social media networks
Bakardjieva and Gaden (2012) examined the field of social interaction in general to the everyday chatter of unstructured and spontaneous interactions among individuals to highly structured and regulated interaction consisting of the military or the stock exchange.
Question answered: How much time do people spend on a website, on average?, “if you look at the trend for mobile browsing between the years 2017 and 2019 you would see that there is a drop of about 11 seconds in the average time spent on a website.” and “The data suggests that the average amount of time spent on websites before navigating away for all devices has gone down by 49 seconds which is a pretty huge reduction all things considered.”
The data is from the right timeframe (up to but not including 2020), but the linked SimilarWeb report is behind a paywall, so I can’t confirm the numbers. Furthermore, the time spent on websites is a weak proxy: Perhaps people simply have become better at prioritising information sources.
How long does any particular hashtag stay in the group of the top 50 most used hashtags? Specifically, how has that number developed from 2013 to 2016?, “in 2013 a hashtag stayed within the top 50 for 17.5 hours on average, a number which gradually decreases to 11.9 hours in 2016”, and “The average maximum popularity ⟨L(tpeak)⟩
on one day tpeak stays relatively constant, while the average gradients ⟨ΔL⟩
in positive and negative direction become steeper over the years.”
Do things become more popular faster over time? That is, when e.g. a movie is gaining popularity, did it take longer to become popular in 1985 than it did in 2018?, Broadly yes (the trends holds for popularity of hashtags in tweets (2013-2016)/n-grams in books (1900-2004)/number of theaters that movies were screened in (1985-2018)/topics for search queries on Google (2010-2017)/Reddit comments on posts (2010-2015)/citations of publications (1990-2015)/daily traffic for Wikipedia articles (2012-2017)). Again the length of the time at the peak mostly didn’t change (except in the case of Wikipedia articles, where the time at the peak shrunk)
While it investigates a question different from the one I have, this paper seems good and trustworthy to me, while supporting a suspicion I’ve had (observing that the lifecycle of e.g. memes has apparently sped up significantly). I’d be interested in seeing whether the same process holds for internet communities I’m part of (for example on votes LessWrong and the EA Forum or forecasts on Metaculus).
Mark 2023 is a recent book about attention spans, which I was excited to read and find the important studies I’d missed. Unfortunately, it is quite thin on talking about the development of attention span over time. It states that
My own research, as well as those of others, has shown that over the last fifteen years, our attention spans have declined in duration when we use our devices. Our attention spans while on our computers and smartphones have become short—crazily short—as we now spend about forty-seven seconds on any screen on average.
—Gloria Mark, “Attention Span” p. 13/14, 2023
which is not quite strong enough a measurement for me.
In 2004, in our earliest study, we found that people averaged about one hundred fifty seconds (two and a half minutes) on a computer screen before switching their attention to another screen; in 2012, the average went down to seventy-five seconds before switching. In later years, from 2016 to 2021, the average amount of time on any screen before switching was found to be relatively consistent between forty-four and fifty seconds. Others replicated our results, also with computer logging. seconds. Others replicated our results, also with computer logging. André Meyer and colleagues at Microsoft Research found the average attention span of twenty software developers over eleven workdays to be fifty seconds.⁹ For her dissertation, my student Fatema Akbar found the average attention span of fifty office workers in various jobs over a period of three to four weeks to be a mere forty-four seconds.¹⁰ In other words, in the last several years, every day and all day in the workplace, people switch their attention on computer screens about every forty-seven seconds on average. In fact, in 2016 we found the median (i.e., midpoint) for length of attention duration to be forty seconds.¹¹ This means that half the observations of attention length on any screen were shorter than forty seconds.
—Gloria Mark, “Attention Span” p. 74/75, 2023
She doesn’t mention the hypothesis that this could be the symptom of a higher ability to prioritize tasks, although she is adamant that multi-tasking is bad.
Furthermore, this behavior displays only a decrease in the propensity of attention, but not necessarily one of capacity: Perhaps people could concentrate more, if they wanted to/were incentivized to, but they don’t, because there is no strong intent to or reward for doing so. Admittedly, this is less of an argument in the workplace where these studies were conducted, but perhaps people just care not as much about their jobs (or so I’ve heard).
when email was cut off, people’s attention spans were significantly longer while working on their computers—in other words, they switched their attention less frequently.
—Gloria Mark, “Attention Span” p. 97, 2023
She gives some useful statistics about time spent on screens:
Nielsen reports that Americans spend on average five hours and thirty minutes daily of screen time on their computers, tablets and phones8. […] But what is really astonishing is that when we add in the time watching other media like TV and films to this, then we see that our attention is fixated on some form of screen, in some type of mediated environment, nearly ten hours a day8.
—Gloria Mark, “Attention Span” p. 180, 2023
She connects attention span to shot-length in movies:
The type of motion within shots has been changing. According to film scholar James Cutting and his colleagues at Cornell, shots containing the onset of motion (like a standing person who then runs) have increased because filmmakers believe that it will better attract viewers’ attention. […] The average film shot length in 1930 was twelve seconds, but then began to shorten, reaching an average of less than four seconds after the year 2010, as measured by James Cutting and colleagues.12 Interestingly, the shot length for film sequels also decreased. For example, the shot length of the first Iron Man film averaged about 3.7 seconds; for Iron Man 2, 3.0 seconds; and for Iron Man 3, about 2.4 seconds.13
—Gloria Mark, “Attention Span” p. 180/181, 2023
Like in TV and film, shot lengths in television commercials also shortened over time. The average shot length of commercials in 1978 was 3.8 seconds, dropping down to an average of 2.3 seconds in 1991. […] It’s not just the shot lengths, though, that are short—the overall length of advertisements on TV has also decreased. The majority of ads started out as sixty seconds in length in the 1950s,26 but that length comprised only 5 percent of ads shown in 2017. In the 1980s, advertisers started experimenting with showing fifteen-second ads instead of thirty-second ads. They discovered that fifteen seconds was even more persuasive than thirty seconds, especially when the ads used elements expressing cuteness and humor.27 In 2014, 61 percent of ads were thirty seconds in length, but three years later, that percentage decreased to 49 percent.28
—Gloria Mark, “Attention Span” p. 189, 2023
Do People Believe Attention Spans Have Declined?
Half of the public feel their attention span is shorter than it used to be, compared with around a quarter (23%) who believe they are just attentive [sic] as they’ve always been.
Again, the feeling of is not just reported by the young — it’s also the dominant feeling among the middle aged too, with 56% of 35- to 54-year-olds thinking their attention spans have worsened.
Even more widespread is the belief that young people’s attention spans in particular are worse than they were in the past—two-thirds of people think this is the case (66%).
Perhaps unsurprisingly, this belief is most common among the oldest age group surveyed, of those aged 55 or over — however, young people themselves also feel this way, with a majority of 18- 34-year-olds holding this view.
Note that selective attention mostly improves with age, so the older age-groups might be comparing themselves now to the younger age groups now (as opposed to remembering back at their own attention spans).
The absence of long-term research means it remains unknown whether technology has caused a deterioration in the country’s ability to concentrate — but comparisons with survey data from previous decades indicate that, on some measures the public feel more pressured than they did in the past.
In response to the questions (n=2093 UK adults aged 18+ in 2021):
“To what extent do you agree or disagree with the following statement? The pace of life is too much for me these days” (1983: 30% agree, 2021: 41% agree)
“To what extent do you agree or disagree with the following statement? I wish I could slow down the pace of my life” (1997: 47% agree, 1999: 51% agree, 2008: 45% agree, 2021: 54% agree)
What About Rates of ADHD?
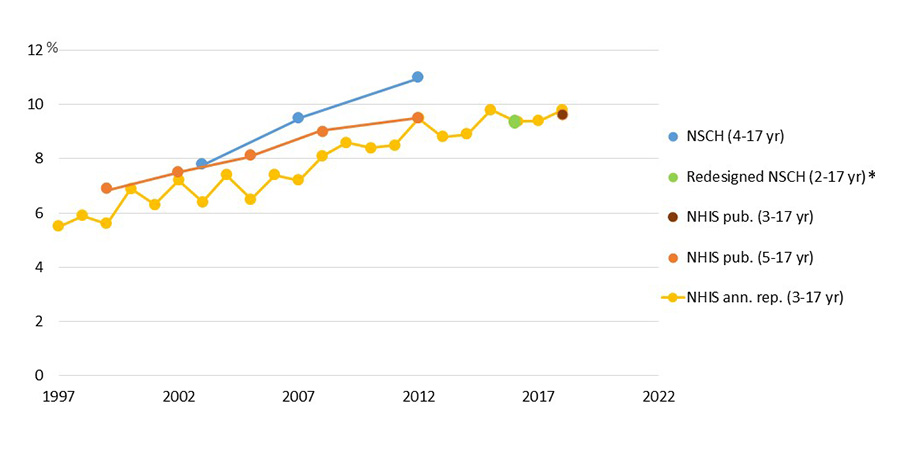
Data from the CDC shows a clear increase in the percentage of children with a parent-reported ADHD diagnosis:
There has been a similar increase in the diagnosis of ADHD among adults, “from 0.43 to 0.96 percent” between 2007 and 2016.
However, this does not necessarily mean that the rate of ADHD has increased, if e.g. awareness of ADHD has increased and therefore leads to more diagnoses.
What Could A Study Look Like?
Compared to other feats that psychology is accomplishing, finding out whether individual attention spans are declining appears to be of medium difficulty, so I’ll try to outline how this could be accomplished in three different ways:
Develop a good instrument for measuring attention span (optionally just use a continuous performance test). Once one has a suitable instrument for measuring attention span, one can every year (or every second year) for a couple of years pick a random sample from the population (not of the same set of people, though, since attention span increases with age), e.g. via the internet if the test can be done online. One could then apply a linear trend estimation or a fancier statistical technique I don’t know to find out whether attention spans have declined between the measurements.
This could be done relatively cheaply: Let’s say we collect 50 datapoints a year, from Mechanical Turk workers at $10/hr. A conservative estimate is that the test takes ~30 minutes to complete, so for three years the cost of the data would be 50⋅3⋅10$/h⋅0.5h=$750. It looks like there areopen-source implementationsof the test available (Conners’ CPT 3 costs $1.5k), so the additional cost is for the researcher setting up the test and recruiting the participants, which could take ~30 hours, and another ~30 hours for analysing the data. So the total cost of the experiment would be, at an hourly wage of $15 for the researcher (come on, we can let a grad student do it), $750+60h⋅15$/h=$1650
. Fudging upwards by taking the planning fallacy into account gives $2k for the experiment.
Use the control groups from studies testing the effect of interventions on attention as data and then perform a meta-analysis. A lot of studies use some variant of the CPT, I started collecting such studies in Appendix B.
Conclusion
Given the amount of interest the question about shrinking attention spans has received, I was surprised to not find a knockdown study of the type I was looking for, and instead many different investigations that were either not quite answering the question I was asking or too shoddy (or murky) to be trusted. It seems likely to me that individual attention spans have declined (I’d give it ~70%), but I wouldn’t be surprised if the decline was relatively small, noisy & dependent on specific tests.
So—why hasn’t anyone investigated this question to satisfaction yet? After all, it doesn’t seem to me to be extremely difficult to do (compared to other things science has accomplished), there is pretty clearly a lot of media attention on the question (so much so that a likely incorrect number proliferates far & wide), it appears economically and strategically relevant to me (especially sustained attention is probably an important factor in knowledge work, I’d guess?) and it slots more or less into cognitive psychology.
I’m not sure why this hasn’t happened yet (and consider this text evidence for a partial violation of Cowen’s 2nd law—although, to be fair, the law doesn’t specify there needs to be a good literature on everything…). The reasons I can think of is that one would need to first develop a good test for determining attention span, which is some work in itself (or use the CPT); be relatively patient (since the test would need to be re-run at least twice with a >1 year pause, for which the best grant structure might not exist); there are many partial investigations into the topic, making it appear like it’s solved; and perhaps there just aren’t enough cognitive psychologists around to investigate all the interesting questions that come up.
So I want to end with a call to action: If you have the capacity to study this problem, there is room for improvement in the existing literature! Attention spans could be important, it’s probably not hard to measure them, and many people claim that they’re declining, but are way too confident about it given the state of the evidence. False numbers are widely circulated, meaning that correct numbers might be cited even more widely. And it’s probably not even (that) hard!
Consider your incentives :-).
Appendix A: Claims That Attention Spans Have Been Declining
Most of these are either unsourced or cite Gausby 2015 fallaciously (which Bradbury 2016 conjectures to be the number of seconds spent on websites on average).
Today, individuals are constantly on an information overload from both the quantity of information available and the speed of which information gets into the hands of individuals through advertising and multimedia. Attention deficits tend to be increasing as it is challenging to attract individuals and hold their attention long enough for people to read or watch messages such as work memos, advertisements, etc.
Big data plays an important role in the development of microlearning. In the age of big data, human’s attention span is decreasing. As per Hebert (1971), “what information consumes is rather obvious: it consumes the attention of its recipients. Hence a wealth of information creates a poverty of attention and a need to allocate that attention efficiently among the overabundance of information sources that might consume it” (p. 41). An example of short attention span in the age of big data can be found in the music industry, as per (Gauvin, 2017), the average time that passed before the audience would hear the vocals on any radio song was 23 s, today the average intro is just 5 s long. Wertz (2017) also suggested that 40% of users are likely to abandon a website if it does not load within three seconds or less. Furthermore, a survey (Gausby, 2015) conducted by Microsoft indicated that the average attention span of a human dropped from 12 to eight seconds, which means shorter than a goldfish. Given the average human attention span is decreasing, microlearning becomes more and more important because it emphasises short learning duration.
Unfortunately, all too many of us are having “squirrel” days, according to Dr. Gloria Mark, a professor of informatics at the University of California, Irvine, who studies how digital media impacts our lives. In her new book, “Attention Span: A Groundbreaking Way to Restore Balance, Happiness and Productivity,” Mark explained how decades of research has tracked the decline of the ability to focus.
“In 2004, we measured the average attention on a screen to be 2½ minutes,” Mark said. “Some years later, we found attention spans to be about 75 seconds. Now we find people can only pay attention to one screen for an average of 47 seconds.”
Not only do people concentrate for less than a minute on any one screen, Mark said, but when attention is diverted from an active work project, it also takes about 25 minutes to refocus on that task.
Tech-savvy users often say that the way the modern internet works has made it so that people’s attention spans are getting shorter every single day but the truth behind this story is rather tough to ascertain. However, recent data from SimilarWeb indicates that people definitely are suffering from shorter attention spans, and what’s more is that these attention spans are shortening at a pretty rapid pace when you take into account the numerous factors that are coming into play, all of which serve some kind of purpose in this trend.
If you look at the data for how long users spend on websites before navigating away, for the most part the trend has been that these times are remaining more or less stable on web based browsing, but if you look at the trend for mobile browsing between the years 2017 and 2019 you would see that there is a drop of about 11 seconds in the average time spent on a website. When you take into account the fact that mobile browsing is starting to become a lot more popular and in many ways has become the preferred form of browsing for people on the internet, the change is a lot more drastic.
However, as much as technology can be used as an effective learning tool inside and outside the classroom, there’s no denying that one of the biggest challenges faced by educators today is the distraction posed by social media. Students are distracted by their phones during class, and even without that distraction, the time they spend on social media outside the classroom has an impact on their attention spans.
In 2015, a study commissioned by Microsoft and discussed in Time magazine found that the average attention span was in fact only 8 s. If indeed this is the case, then even participating in a 15-min lecture would be positively heroic. To place this in perspective, it was reported in the same Time article, that goldfish, of the piscine rather than snack variety, have an attention span of 9 s, one whole second greater than humans! It is perhaps rather premature to opt for an 8-s lecture format, as there are many caveats to the Time article, not the least of which is that no one knows how to actually measure a goldfish’s attention span. What has been measured is goldfish memory, which, according to researchers in the School of Psychology at the University of Plymouth, is actually quite good (7). Similarly the 8-s attention span for humans actually reflects the average time a person will spend on a web page before looking somewhere else.
I’ll list the closest thing those studies have to a control group, list sorted by year.
Studies Using the CPT
What Determines Continuous Performance Task Performance? (Maria J. O. van Asma/René P. Rombouts/Robert J. van den Bosch, 1996): Patient controls n=19 (mean age 29.5±8.1 years), normal controls n=20 (mean age 32.2±8.3 years). Tested with an unspecified digit related CPT.
Measuring Several Aspects of Attention in One Test (Iwona Kovalik-Gran/Jens Egeland, 2010): n=376 Norwegian patients, aged 14-77 (mean 32.9 years, standard deviation 13.8), either referred to Egeland or to the Vestfold Mental Health Care Trust, with various psychological disorders (57 without such disorders). Tested using Conners’ CPT. Scores for normal group not reported independently.
Reliability and validity of the Conners’ Continuous Performance Test (Danielle Shaked/Lauren M. D. Faulkner/Kathryn Tolle/Carrington R. Wendell/Shari R. Waldstein/Robert J. Spencer, 2019): n=91 undergraduate psychology students (20.01±1.68 years), tested using Conners’ CPT II. Page 3 lists more retest studies for Conners’ CPT II.
Do concerns about COVID-19 impair sustained attention? (Jihyang Jun/Yi Ni Toh/Caitlin A. Sisk/Roger W. Remington/Vanessa G. Lee, 2021): n=161 participants (23±5.2 years), recruited online. No control group, but instead a correlational study. Tested using the scene CPT.
Appendix C: How I Believed One Might Measure Attention Span Before I Found Out About The CPT
Before I found out about the Continuous Performance Test, I speculated about how to measure attention span:
(Note that I’m not a psychometrician, but I like speculating about things, so the ideas below might contain subtle and glaring mistakes. Noting them down here anyway because I might want to implement them at some point.)
It seems relatively easy to measure attention span with a power- or speed-test, via one of three methods:
Present a stimulus, change the stimulus and let the test subject report the change in stimulus; this results in two numbers: the time between the stimulus being initially being presented and the time it was changed (let’s call this value t_change), and the time between the change of the stimulus and the reporting of the change (calling this value t_report). Performing this test with different value of t_change should result in different values of t_report. There is a t_change for which t_report falls over a threshold value, that t_change can be called the attention span.
This method has some disadvantages:
It needs a change in stimulus that requires selective attention to notice, but changing e.g. visual stimuli involves motion, which direct attention. (Idea: have a colored stimulus continuously changing color, and a reference color, once the stimulus has the reference color, the subject is supposed to report; avoiding sudden changes in visual stimuli.)
The method would require many samples to find the t_change for which t_report falls over the threshold value.
Performing the test multiple times in a row might induce mental fatigue, decreasing attention span
Let the test subject engage in a mentally draining exercise like the Stroop test with some performance measure. I would the performance to decline over time, and one could define a threshold value at which the subject “is no longer paying attention”.
Let the subject observe a neutral stimulus while measuring some indicator of attention (such as arousal via skin conductivity or the default mode network being inactive), when the measured value falls under/over a threshold the subject has “lost attention”.
This method has the major disadvantage that it requires special equipment to perform.
Such an instrument would of course need to have different forms of reliability and validity, and I think it would probably work best as a power test or a speed test.
I’m not sure how such a test would relate to standard IQ tests: would it simply measure a subpart of g, completely independent or just partially related to it?
[This is one of the finalists in the SMTM Mysteries Contest, by a reader writing under the pseudonym TripleTaco. We’ll be posting about one of these a week until we have gotten through all the finalists. At the end, we’ll ask you to vote for a favorite, so remember which ones you liked.]
I’ve always thought it was really weird that Amish kids mostly don’t get autism, and I have found other people’s explanations unsatisfying. For most of America, the autism rate is about 1 in 44, but among the Amish, it’s more like 1 in 271. Like obesity, autism is extremely common in developed countries, and largely did not exist (or was not recognized) before modernity (diagnoses have been rising dramatically). So, what if some environmental factor of our modern lives is poisoning our children’s very minds?
It’s not because of vaccines
It appears that the correlation is mostly used by anti-vaxxers as evidence that children shouldn’t be vaccinated, which makes it data-non-grata; (we can’t talk about this data lest we reinforce their conspiracy theories).
It’s not because of vaccines, but what if there’s some other aspect of modern living that contributes heavily to autism? There are many other things that the Amish abstain from that could be contributing.
It’s not (just) kids watching TV
An easy culprit would be babies watching too much TV. Indeed, there’s strong evidence that needs to be considered here. An increase in cable TV subscriptions in a neighborhood is directly correlated to an increase in autism. The same article also points out that places with more precipitation get more autism (perhaps because people stay inside to watch tv?)
But wait, while research on this topic does support the theory that screen time is bad for babies’ social development, the effect size is not nearly large enough to explain the severe autism that many children get. No study I’ve seen directly correlates baby screen time with actual autism diagnosis (although few would argue that heavy screen usage is good for babies). The TV explanation is missing something.
It’s not (just) genetics
Some have pointed out that the Amish are genetically isolated, and perhaps they have good genes for avoiding autism. However, no genetic explanation can explain the dramatic rise in autism rates in other populations.
Are there any clues from treatment?
Often diseases are treated with therapies that reflect their causes. Bacterial infections are treated with antibiotics, for instance; kill the bacteria, and you solve the problem. Autism is generally treated with language and behavioral therapy. The child has extended one-on-one time with a therapist where they practice building the social skills they are lacking. If this is truly the best treatment (at least for now), does that tell us anything about possible causes?
Teaser
There’s more I’d like to say and link to, but I can’t really go much further without getting into my own theories on this topic. I do have a pet theory that I think better fits the observed data than other explanations. I have in fact found one other individual (a therapist who treats autism) espousing my exact theory, although it doesn’t appear to have gotten much traction. For now, I’ll just leave this mystery without suggesting a theory as requested.
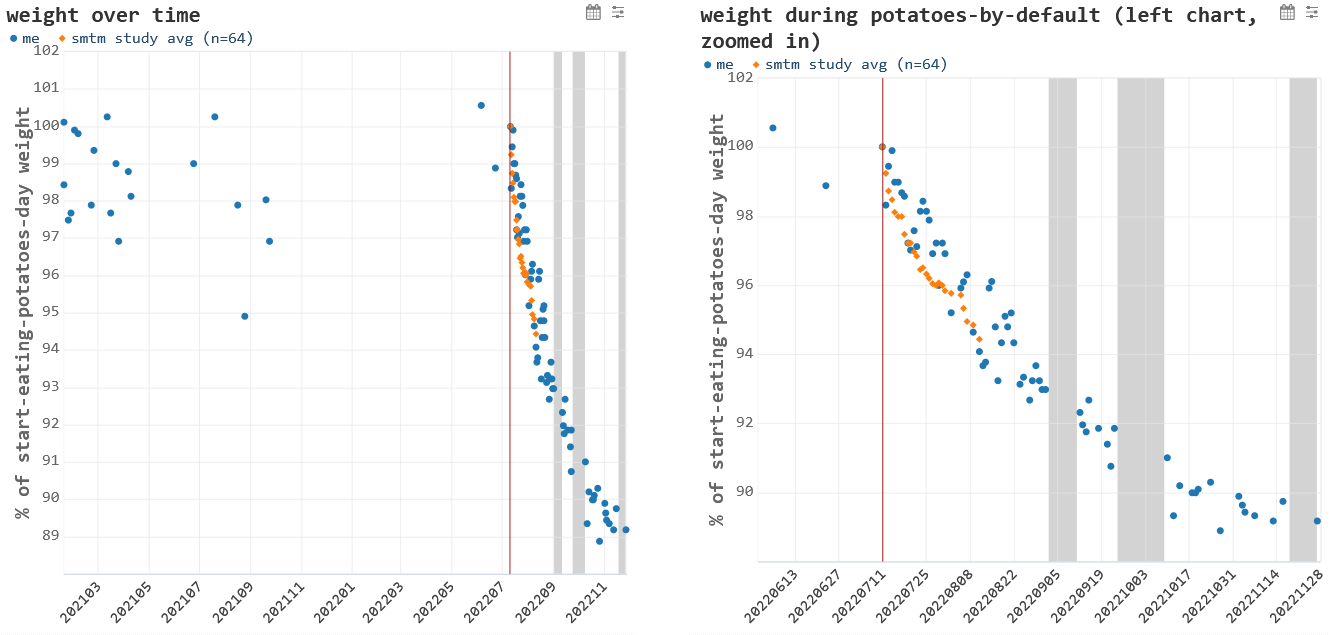
Krinn is a reader who participated in our Low-Dose Potassium Community Trial. She lost 6 lbs taking low doses of potassium, and liked it enough that she decided to keep going, along with a new exercise habit to help support the weight loss. And she started trying higher doses of potassium, eventually ramping up to around 10,000 mg of potassium a day.
This is a lot — way more than the average person gets from their diet, and a lot more than people added in the original potassium trial.
Krinn writes, “I decided to stabilize at about 10,000mg per day … because that’s about how much potassium people were getting during the SMTM potato diet community trial. … Aiming for that amount also meant that it would be easier to compare my results to something that worked decently well and to ask questions like ‘is there something special about whole potatoes, or is it mostly the potassium?’ If it’s mostly the potassium, you’d expect my results to be closer to the full-potato-diet results than to the low-dose-potassium results — which is what happened.”
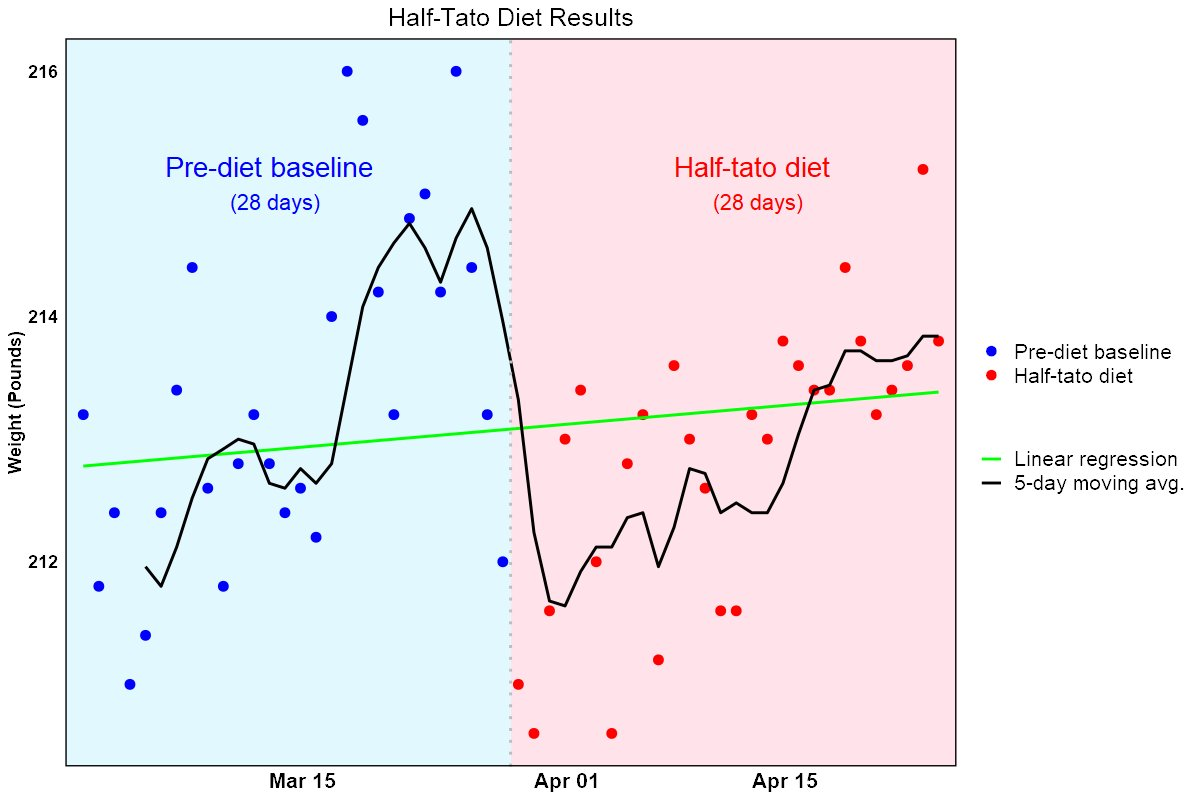
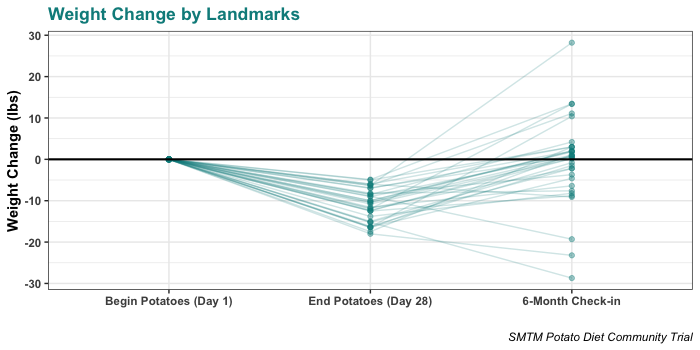
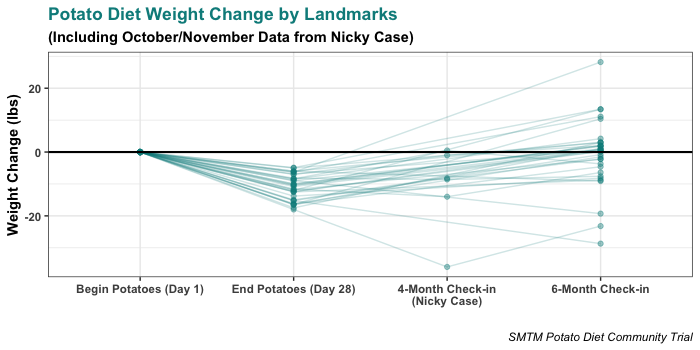
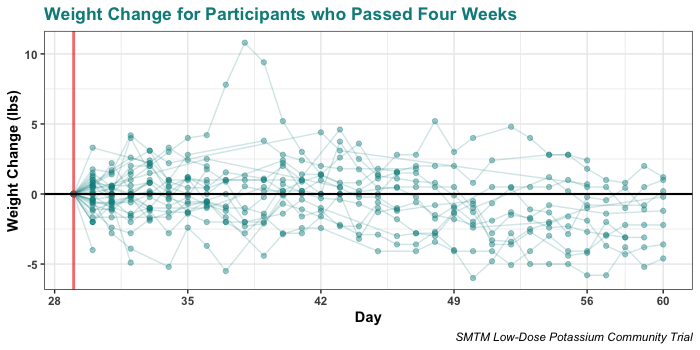
Indeed, she lost quite a bit of weight. Here’s the chart of her weight change so far:
Krinn’s report is excellent — nuanced, detailed, and clearly written. She covers almost every aspect of her self-experiment better than we could, so we won’t try to restate her points. We recommend that you read the report for yourself. Instead we will focus on the few small areas where we can add some speculation or additional context.
(Krinn’s full report is also reproduced in an appendix below, because tumblr posts do not always have the best longevity and we figured it might be good for the report to exist in two places.)
Again, you may want to read what Krinn wrote before you take a look at our comments. But we will restate this part: while this seems to be working for Krinn, it’s not clear that high doses of potassium are safe for everyone, and they almost certainly are not safe if you have kidney disease or related diseases like diabetes. Do not try supplementing doses this high without consulting your physician, and absolutely do not try it if you have kidney problems or any conditions that might compromise your kidney function.
Ok, here are our thoughts:
Optimal Weight Loss Brine
Originally, we argued that high doses of potassium alone might be responsible for weight loss on the potato diet. After all, eating nothing but potatoes does give you heroic doses of potassium.
In retrospect, that seems a little naïve. Sure, it could be just the potassium. But biology tends to be a bit more complicated than that.
At risk of oversimplifying (read the original piece), people knew that cholera patients needed electrolytes, but feeding them an electrolyte solution didn’t seem to help.
Through a series of coincidences, people eventually discovered that adding glucose to the electrolyte solution sometimes made the treatment work. But this didn’t immediately lead to a cure, because if you put too much glucose and salt in the solution, it made patients worse instead.
After more confusion, they discovered that sugar and sodium ions are absorbed together in the gut through a sodium-glucose cotransport protein, but you need the right concentration or it will dehydrate the patient instead, which often kills them. The solution was simple, but getting there was hard.
Getting sodium into someone’s body isn’t simple — you need to include glucose in your rehydration formula, and even then, you need to get the right ratios. This makes us suspicious that something similar might be the case for potassium.
Even if high doses of potassium are required for curing obesity, it seems pretty likely that potassium by itself isn’t the whole engine. So now we are looking for some other set of factors, probably other switches that are triggered when you eat ~100% potatoes, that might also be needed to make the gears of weight loss mesh.
Magnesium
The most likely candidate at this point seems to be magnesium.
Potassium and magnesium serve many complementary roles in our biology, and the two minerals are often prescribed together. We spoke to a physician about this, and he pointed out that for patients with low potassium (hypoK), if you don’t have enough magnesium (hypoMg), you’ll be hypoK forever unless you fix the hypoMg first, because of “some renal excretion thing I think” (his words). See also this paper, which says: “magnesium replacement is often necessary before hypokalemia and potassium depletion can be satisfactorily corrected with potassium supplements.”
Electrolyte mixes, like LMNT and Snake Juice, are sometimes used for weight loss, and these mixes usually contain some amount of magnesium. Assuming that, by a process of natural selection (it’s a electrolyte-powder-eat-electrolyte-powder world out there), they have run across something like the right electrolyte ratios to cause weight loss, this also suggests that magnesium might be involved.
Like potassium, most people are not getting enough magnesium, at least per the official recommendations. According to the NIH, you’re supposed to get 300-400 mg of magnesium per day. And potatoes are not only high in potassium, they are also pretty high in magnesium. Each potato contains about 40-50 mg of magnesium. Someone on the potato diet would be getting about 800-1,000 mg of magnesium per day.
If potassium and magnesium together are the cause of this weight-loss effect we’ve discovered, this would explain why potatoes are such a reliable way to cause weight loss, and why they’re often more effective than supplementing straight potassium.
All the above are just reasons for the hunch, but we also want to note that this hunch is supported by Krinn’s case study.
In her report, Krinn writes:
My go-to snacks are cashews, pistachios, cherries, and granola bars.
Cashews and pistachios are particularly high in magnesium, providing 260 mg per 100 g and 110 mg per 100 g, respectively. We don’t know exactly how much cashew Krinn is consuming, but it’s likely that it’s giving her a respectable amount of extra magnesium.
We discussed this with Krinn over twitter DMs, where she said, “cashews are one of my go-to snack foods, so whatever amount I’m getting, I would be extremely surprised if I was getting something less than a healthy amount of magnesium in my diet.”
She also notes that she tends to consume the magnesium and the potassium relatively close to one another.
…another way to look at it is that “eating cashews” and “drinking gatorade+potassium” are never _that_ far apart
since the potassium stuff is spaced out 4–6 hours apart across the day, and I eat cashews at least once a day, that puts a ceiling on how far apart those two things could possibly be
We have no idea if it’s helpful or necessary to take potassium and magnesium at the same time, but it’s worth noting that Krinn tends to leave little daylight between them.
In short, we’ve suspected for a while that potassium might only cause weight loss, or might cause it more effectively, when combined with reasonable doses of magnesium. The potato diet would get this “for free”, since potatoes contain high amounts of both. This hunch predicts that people who lose weight by supplementing straight potassium will also likely be getting high doses of magnesium from some source, either from supplements or their diet. Krinn’s case matches that prediction.
We’ve also recently been corresponding with a participant from the half-tato diet, who told us that straight potassium seems to have some kind of effect for her, and who mentioned that she has been supplementing 266 mg magnesium a day as magnesium glycinate capsules. Not conclusive, but another hit for the prediction.
Stearic Acid
Another possible connection is with stearic acid, a fatty acid found in “meat, poultry, fish, eggs, dairy products, and foods prepared with fats; beef tallow, lard, butterfat, cocoa butter, and shea butter are rich fat sources of stearic acid.”
If you’ve heard of this before, it’s likely from Fire in a Bottle (FIAB), a website/program/theory which argues that a diet high in stearic acid can cause weight loss. This is sometimes called The Croissant Diet (TCD), presumably in the hopes of confusing readers — you do not actually eat nothing but croissants. In fact, you don’t have to eat any croissants at all. But you do ideally eat lots of foods high in stearic acid, sometimes supplementing with additional stearic acid, and some people seem to lose weight when they do this.
We find the evidence for stearic acid to be pretty thin (though see FIAB for the other side). And there’s no theoretical reason to suspect that stearic acid influences potassium uptake or anything. But there are just a few hints, so we figured we might mention them here.
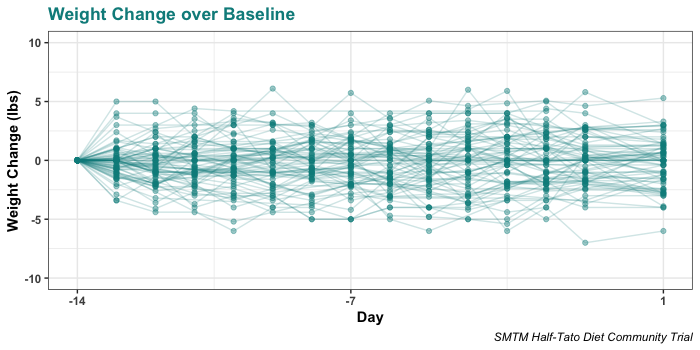
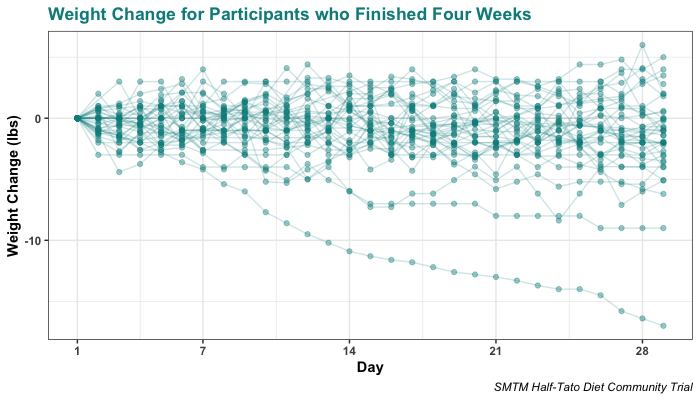
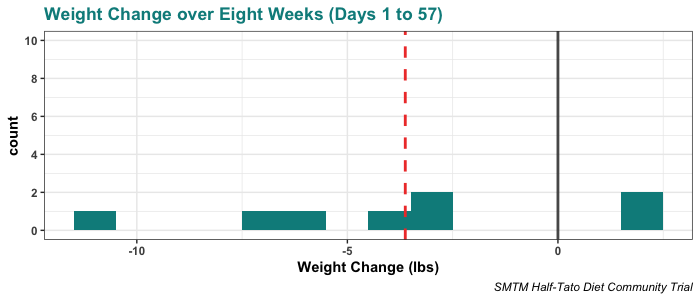
One is from our half-tato diet. Most people lost only a small amount of weight on the half-tato diet, but one person (participant 25348806) lost 17 lbs in four weeks. This person gave us detailed notes about the rest of her diet, and this part jumped out in particular:
…I also have dairy – at least one glass of milk a day (either raw whole milk or 2% or whole conventional) – and a small amount of juice or lemonade. Some mornings I may have full fat yogurt with collagen and stearic acid (see fireinabottle.net) but not all mornings. I have some extra potassium as well as other supplements.
For comparison, here’s what Krinn has to say about her fat intake:
I use a generous hand when measuring out olive oil. I believe that if you need either milk taste or milk fat, you shouldn’t half-ass it, so when I need milk taste or milk fat, I rely on whole milk and heavy cream. Fats, generally, taste good. … Once in a while, dark chocolate, usually with the nuts and fruit.
Milk fat and chocolate (via cocoa butter) are both high in stearic acid. You’ll also notice that Krinn usually takes the chocolate with her cashews.
And remember that participant from the half-tato diet we mentioned at the end of last section? Based on these hints, we asked her if she also consumes a lot of stearic acid, and she told us she eats a whole lot of dairy fat, and chocolate “EVERY DAY” (her emphasis).
This is certainly suggestive, but what doesn’t fit is the potato diet. Potatoes are high in both potassium and magnesium, so it would make sense if high doses of potassium and magnesium conspire to create the potato weight loss effect. But potatoes contain very little fat and approximately 0% stearic acid. The idea that you might need stearic acid to cause the potato effect is rather inconsistent with the potato diet, since you do not get appreciable amounts of stearic acid from potatoes.
That said, there are hints that people who are on half-tato, or who are supplementing potassium directly, do benefit from stearic acid. At the very least, we’ve noticed that some of the biggest success stories are people who have been getting decent amounts of stearic acid in their diet. Maybe stearic acid helps when you are getting less enormous doses of these minerals?
It’s always possible there’s some unknown connection — maybe the potato diet only works for people who already have sufficient reserves of stearic acid in their body. Or maybe some people need stearic acid for the effect to kick in and others don’t, for genetic reasons. Or maybe other fatty acids can substitute in a pinch, but stearic acid happens to be slightly better than average. But at this point, it definitely fits less well than magnesium.
This Age Needs Heroes
We love everything that Krinn did here. She participated in a community trial, decided to keep going, and spun it into a self-experiment. She came up with her own design and attacked her questions in her own unique way. She did something interesting and she wrote it down so that all ingenious people could be informed thereof and consider the results for themselves.
More people should do what Krinn did, and get involved in the business of conducting science. Anyone else who wants to do anything else remotely like this should feel free to reach out, we’d be happy to help. We’re in the process of writing a whole series about how to conduct self-experiments, which may be a good starting point. Consider this your invitation.
Here’s a reproduction of Krinn’s full report as it appears in her tumblr post:
An Ad-Hoc, Informally-Specified, Bug-Ridden, Single-Subject Study Of Weight Loss Via Potassium Supplementation And Exercise Without Dieting
Here’s the short version: I lost 30 pounds in 6 months by chugging a bunch of potassium salt and exercising a lot. My subjective experience is that cranking my potassium intake way up made it possible to do a lot more exercise than I had been doing without also eating a lot more. Exercising more without also eating more led to weight loss (as one would hope!). I did not diet: I ate as I had been doing and as it pleased me to do. Do with the raw data as you please.
Losing weight this way is unusual and worth paying attention to because many things about increases and decreases in weight and obesity are very poorly understood. Many people would like their personal weight and obesity levels to be different, so anything that improves our collective understanding of how to make that happen is valuable. However, losing weight this way is an experiment: it’s not necessarily safe to do what I did! Part of why I did it was to find out what would happen, and if you have any kind of existing kidney problems then you definitely should not do what I did. Note to other transfemmes: if you’re taking spiro, that counts as a kidney problem.
I also don’t want to overstate the significance of this experiment: what I’ve been up to in the last 6 months amounts to a single data point that happens to also be 1,100 spreadsheet cells. It’s a data point that is highly suggestive, sure, but it would be extremely ambitious to say that it proves anything beyond “this worked for me” and perhaps “it’s not impossible for this to work”. I am writing about it because as far as I know, this particular experiment is something that nobody else has tried, and, again, anything that improves our collective understanding here is valuable.
The long version comes next: how I came to be doing this experiment, what I did in the experiment, what I plan to do next, and finally what I think about it all. The really long version is the ongoing conversation that this post is part of, starting with A Chemical Hunger, which is a book-length literature review about the 1980s–present global increase in obesity prevalence, also the posts about single-subject research where the same authors discuss the limits of what can be learned from experiences like mine, also the Experimental Fat Loss guy and his wide variety of diet-only experiments, also somecritics who disagree.
How I came to be doing this
At the tail end of 2022, I noticed both that my BMI had hit 30 and that I had become very unhappy about my weight. There’s a specific photo where I didn’t realize until I saw the photo that my belly was hanging out over my waistband and it’s vividly unpleasant in my memory. Around the same time, I happened to find the potassium-supplementation community trial that the Slime Mold Time Mold folks were running. The value proposition was “this will be easy, cheap, and safe, but also it might not actually work,” and that sounded good to me, so I signed up for it and took a modest amount of potassium all through December and January. It kinda-sorta worked: I lost 6 pounds. Not nothing, but “it kinda-sorta worked” is the most one can really say about losing 6 pounds in 60 days.
The low-dose potassium delivered on all of what the SMTM folks promised, though. It was easy, cheap, and safe. So I kept doing it and, since I was already doing the potassium, decided that I should get an exercise habit going. I am a big believer in the idea that it’s a tremendous amount easier to go from doing Something to doing More Something than to go from doing Nothing to doing Something. The low-dose potassium got me through the first step: once I was doing Something about my weight, it was relatively easy to do More Something. When the community trial ended in early February, I didn’t have to worry about messing up its results by departing from the trial’s instructions, so I started taking more potassium and building my own experiment. I also kept in touch with the SMTM authors, who were very encouraging. 🐯💕
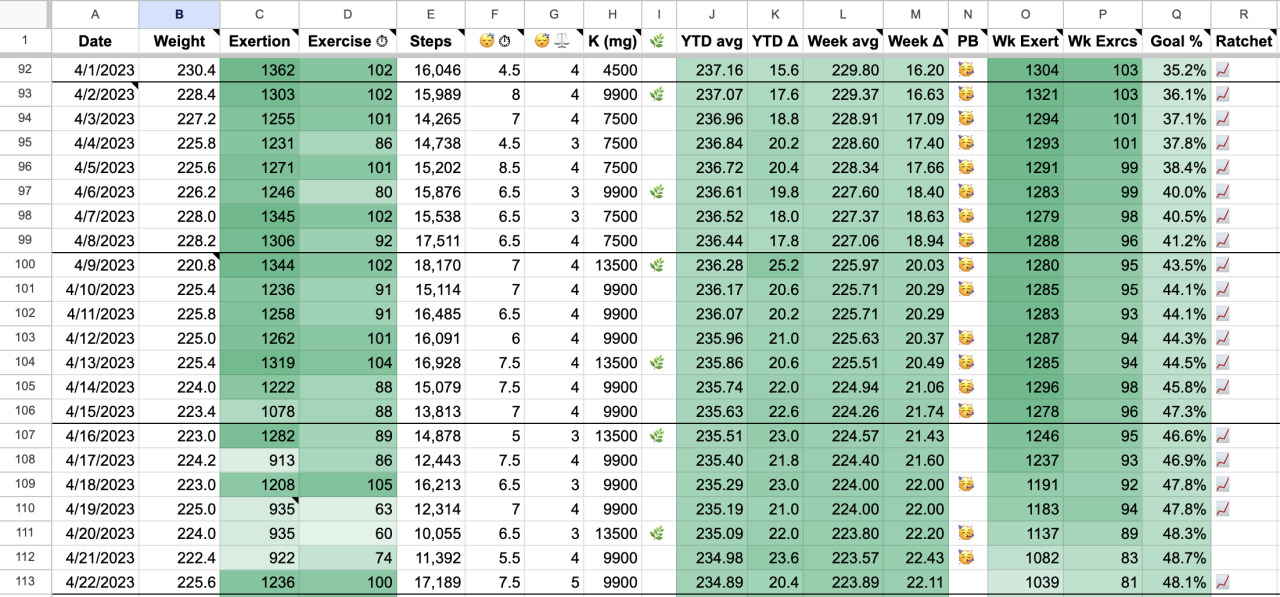
By late March I had brought myself up to daily amounts of potassium and exertion that seemed good to me, and I stuck with those. This is the first time in my life I’ve focused on trying to lose weight, and I was not fully prepared for how demoralizing it is that the weight change from day N to day N+1 sometimes seems perversely unrelated to what you were doing on day N. Fortunately I have experience with spreadsheets, so I put together a tracker for myself that focused on the trailing-week average of my daily weight and exercise measurements as well as long-term graphs. Three months of data were enough to put together a chart whose trendline said very, very clearly, “what you are doing is working — keep it up!” With any kind of long-term project it’s very important to create and sustain sources of feedback. All else being equal, the longer it takes before you can get a read on “is this going well or poorly?”, the worse it will go.
I decided that my goal would be to get my BMI from 30 (the lower limit of “obese”) to under 25 (the upper limit of “normal”). Happily, the math is very easy there: for my height, a BMI of 25 rounds off to 200lbs. I further decided that I was willing to spend all of 2023 working on this. That decision is why I’m writing this post now: halfway through a project is a natural time to pause and take stock.
What I did
By the end of March, my regimen was firmly settled and I kept at it through the end of June without further tinkering. The daily goals I settled on were 10,000mg of potassium and 1,200kcal of exertion. That amount of exercise worked out to be 90 to 100 minutes per day. For contrast, in 2022 my average amount of exercise per day was 15 minutes and my average exertion was 500kcal.
I used my smartwatch’s exertion number (“how many calories are you using above the amount you need to burn to be alive at all?”) and gradually walked up my daily goal, settling at 1,200kcal/day partially because it was working and partially because one hour of watch face equaling 100kcal was helpful for being able to read “how close to my goal am I?” without thinking hard about it. Most of the exercise was treadmill time, usually a brisk walk or light jog. Over the months I also did some running, some bicycling, and some hiking, but treadmill time was the reliable, unremarkable, do-this-every-day core of my exercise regimen. It took a while to ramp up to that amount of exertion and there were definitely days when I stumbled, for good reasons and bad. However, in general I hit the exertion goal and in particular had it absolutely dialed from early March to mid-April.
It was easier to be totally rigorous about the potassium-intake goal — it helped that that part only took a few minutes per day, instead of 90+ minutes! I used potassium chloride powder (whatever came up first on an Amazon search since all KCl should be alike) mixed with regular Gatorade (i.e. not the sugar-free kind) to make it taste okay (I recommend blue Gatorade, it’s the closest to appealing when kaliated — the yellow lemon-lime was meh and the fruit punch red was awful). I added two heaping teaspoons of KCl powder to a 20oz. bottle of Gatorade and drank that. KCl is about 52% potassium and a heaping teaspoon of it is about 6500mg, so I rounded up a smidge and called that 6600-and-a-bit milligrams of potassium per bottle. On Thursdays and Sundays I drank 2 full bottles and on other days 1.5 bottles. I recorded this as 10,000mg of potassium on regular days and 13,500mg on Thursdays and Sundays.
Is 10,000mg of potassium a lot? It’s a lot more than average! The SMTM potassium trial post contextualizes it helpfully:
For a long time, the recommended daily value for adults (technically, the “Adequate Intake”) was 4,700 mg of potassium per day. But most people don’t get anywhere near this amount.
In every CDC NHANES dataset from 1999 to 2018, median potassium intake hovers around 2,400 mg/day, and mean intake around 2,600 mg/day. In this report from 2004, the National Academy of Medicine found that “most American women … consume no more than half of the recommended amount of potassium, and men’s intake is only moderately higher.” Per this paper, only 0.3% of American women were getting the recommended amount. Similarly low levels of intake are also observed in Europe, Mexico, China, etc.
But in 2019, the National Academies of Sciences, Engineering, and Medicine changed the recommended / adequate intake to 2,600 mg/day for women and 3,400 mg/day for men. They say that the change is “due, in part, to the expansion of the DRI model in which consideration of chronic disease risk reduction was separate from consideration of adequacy,” but we can’t help but wonder if they changed it because it was embarrassing to have less than 5% of the population getting the recommended amount.
In any case, recommended potassium intake is something like 2,500 to 5,000 mg per day for adults, and many people don’t get enough.
Potatoes are exceptionally high in potassium. A single potato contains somewhere between 600 and 1000 mg of potassium, depending on which source you look at. They are the 6th highest in potassium on this list of high-potassium foods from the NIH, and 9th on this old list from the USDA. If you do the math, this means that someone on the potato diet, eating 2,000 kcal of potatoes a day, gets at least 11,000 mg of potassium per day, more than twice the old recommended intake.
This explanation is most of why I decided to stabilize at about 10,000mg per day: because that’s about how much potassium people were getting during the SMTM potato diet community trial. Because that community trial involved around 200 people, it was unlikely that there would be any truly heinous health effects from knocking back that much potassium, especially together with the anecdotal evidence that inspired the trial. Aiming for that amount also meant that it would be easier to compare my results to something that worked decently well and to ask questions like “is there something special about whole potatoes, or is it mostly the potassium?” If it’s mostly the potassium, you’d expect my results to be closer to the full-potato-diet results than to the low-dose-potassium results — which is what happened.
I measured those results in a very basic way: ordinary bathroom scale, first thing in the morning, every day. Considering how much noise there is in weight measurement, there’s just no advantage to measuring it more often. I kept the circumstances of the weigh-in simple and stable, trusting that that was good enough. I also measured exertion in two other forms — step count and exercise minutes — but that was mostly for my personal curiosity because both are basically downstream of exertion as such. Similarly, I tracked my sleep but didn’t expect that to matter a whole lot.
While I was affirmatively not dieting, I want to make sure to talk about my food habits because I could be missing something that’s easy for others to see as unusual but seems totally ordinary to me. My meals are heavy on pasta, rice, bread, and granola. I work diligently to get enough dietary fiber. I eat some meat but not a lot (eating a pound of meat in a week would be above average for me), and I enjoy coffee but not a tremendous amount of it since usually I make Chemex-style coffee and having a bunch of that in a day would be too time-intensive. My go-to snacks are cashews, pistachios, cherries, and granola bars. Like most people, I should eat more dark leafy greens than I do. I use a generous hand when measuring out olive oil. I believe that if you need either milk taste or milk fat, you shouldn’t half-ass it, so when I need milk taste or milk fat, I rely on whole milk and heavy cream. Fats, generally, taste good. I eat more whole food and food I personally cook than I eat packaged and processed food, and I only infrequently eat restaurant food (weekly pizza night, maybe twice a month other than that). I really like sour candies but basically stopped eating them last autumn after some very patient coaxing from my dentist. Once in a while, dark chocolate, usually with the nuts and fruit.
I ate as I had been doing: I ate the food I felt like eating and ate as much of it as I felt like eating. If I felt like eating more or less, I did that. Since I wanted to keep the exercise habit going regardless of whether or not I lost weight, it was very important to me to not make the exercise any more difficult than it had to be. Going hungry would definitely make it more difficult, so I avoided doing that. One way in which I’m very sure my experience generalizes is, it’s much easier to persuade people to try “add this supplement to what you’re already eating” than to get them to try “replace all of your current food with potatoes,” especially when talking about long-term or indefinite-duration changes.
What I plan to do next
I’ll be thrilled if I can recapture something like the 7-week March/April streak I had going. Most days in this period (44 out of 49) were PB days (i.e. a day where my trailing-week-average weight was the lowest it had been since the start of the year) and no two consecutive days in this period were non-PB days (i.e. if a day wasn’t a PB day, both the day before and the day after were PB days). I was losing almost 2lbs per week and exercising a lot and I felt great. However, my intuition is that that was the honeymoon period of going from mostly-sedentary to exercising regularly, and that I should expect further progress to be more difficult, to be like the less impressive results I got in May and June.
Still, the thing as a whole has definitely been successful enough that I’m going to keep at it until the end of the year, re-evaluating again in December (and maybe when I hit my weight-loss goal, which should happen around halfway between now and then). Since I’m using January 1st as my anchor date for the start of the experiment, it lines up nicely with the calendar if I just keep going all year and see what happens. Besides, I only need 6 months more to generate a year of data, while someone going from a cold start would need a whole year.
Given that I have a setup that is working pretty well, I’m reluctant to tinker with it. I might add one more high-potassium day in addition to Thursdays and Sundays, and I might start tracking some extra data — even though I’m not trying to change them, recording my food habits seems like the most helpful additional thing I could record.
If I develop health problems I’m gonna pull the ripcord (and post about it). There are already too many shitty fake weight loss regimens in the world that fuck up the health of people who try them, we do not need more.
What I think about it
Since I’m the one doing this experiment, I get to be excited about how it’s working out for me personally, which is to say, very well indeed. Right now it seems pretty certain that I’ll be able to reach my goal of losing ~50lbs in a long-term-sustainable way and just as importantly, getting myself to a much better baseline state of physical fitness. I feel pretty great about that part!
The experiment is not just for me, though: the reason it’s an experiment rather than just “I’m trying to lose weight” is that I am keeping track of things carefully such that other people could carry out the same steps I did and get results similar to or different from mine and ideally everyone eventually comes to pretty firm conclusions about whether this — losing weight via potassium and exercise without dieting — works or not. My chugging potassium and Gatorade for six months to a year is the very beginning of that process, and I expect that the difficult parts of the process will be carried out by people with more expertise and resources than me.
I also expect that I have not tumbled to the One Weird Trick for weight loss that everyone else just overlooked. As someone with plenty of programming experience, I have a hearty suspicion towards “well, it worked on MY setup” stories. One obvious alternate explanation for my successful weight loss is “well yeah, you doubled your exertion and kept your food intake the same, of course you lost weight” — but I don’t find that explanation satisfying. To start with, if it were that easy, people would do it more often. There are a tremendous number of people who would like to lose weight and a tremendous marketplace of devices, services, and professionals to help them use exercise for that purpose, and yet in a 20-year NCHS study, average exercise rose without obesity falling. It’s also very, very easy to find fat people who exercise plenty — you will find them more or less anywhere you find lots of people exercising, as well as in places like sumo stables. A member of my family has taken up powerlifting in the last year, making him both fitter and heavier by quite a bit.
Additionally, there’s studies like Keating 2017 concluding that short-term exercise intervention doesn’t do enough to matter, or like the Wu 2009 work concluding that exerise-and-dieting isn’t meaningfully better than just dieting over periods of 6+ months, and then there’s the STRRIDE study, Slentz 2004, concluding that jogging 20 miles a week can get people to lose about 7 pounds over 8 months. The STRRIDE study caught my eye because it’s pretty similar to what I did: they took obese mostly-sedentary folks, had them exercise more, and forbade them from eating less. However, once you do the math the results are much less similar: the average STRRIDE participant did around half the exercise I’ve done for at most a fifth of the weight loss (i.e. around 1lb/month vs. around 5lbs/month and around 3mi/day vs. 7mi/day). If someone else told me “Krinn, your naïve just-hit-the-treadmill exercise regimen is 2.5x as effective as an exercise regimen supervised & measured by professionals,” I would want them to provide some compelling evidence for that.
If you tell someone you want to lose weight and would like their advice, it is overwhelmingly likely that the advice will involve exercising more. Everyone has heard this advice. And yet, as Michael Hobbes observes in a searing piece for Highline, “many ‘failed’ obesity interventions are successful eat-healthier-and-exercise-more interventions” that simply didn’t result in weight loss. Even if we as a society choose to believe “more exercise always leads to weight loss, most people just fuck up at it,” that immediately confronts us with the important question, why do they fuck up at it? and its equally urgent sibling, what can we learn from those who succeed at it to give a hand up to those who have not yet succeeded?
[exercising more and eating less] is not an explanation any more than “the bullet” is a good explanation for “who killed the mayor?” Something about the potato diet lowered people’s lipostat set point, which reduced their appetite, which yes made them eat fewer calories, which was part of what led them to lose weight. Yes, “fewer kcal/day” is somewhere in the causal chain. No, it is not an explanation.
Since I’ve been doing this for six months, I feel pretty certain that the potassium is doing something positive for me and I’m entirely willing to put in another six months to find out what happens for me. Finding out whether that generalizes is beyond my power: all I can do is explain what worked for me, one middle-aged Seattle housewife, and hope that it’s useful to people who are in a position to do serious work about it.
One kind of serious work that’s available is the very cool analytic techniques that other people in this conversation have used while looking at their data. If you are the kind of person to get elbows-deep in R or Matlab, feel free to grab my day-by-day measurements for that (I release this data under Creative Commons’ CC0 if that’s relevant to you). I’m not going to do that, though, partially because it’s been a long time since I last used R but mostly because of the thing I said earlier about my whole experiment basically being one data point. If you have a data series, then yeah, get in there with some numeric interrogation, but if you only have one data point, that data point is what it is and statistical analysis can’t really add to it. All I can claim here is that this is a new data point: people going about their everyday lives do not spontaneously increase their potassium intake severalfold and the background work from the SMTM potato diet and potassium community trials tell me that no-one’s run a study looking directly at what happens if you do increase your potassium intake that much.
Do you want to increase your potassium intake that much? If you do, I have to re-emphasize the potassium community trial‘s safety warning: if you have existing kidney problems, do not try this. Also I’m gonna deploy the boldface again to make sure I get this across to other trans women: on this topic, taking spiro counts as a kidney problem! I am not a doctor and I’m extremely not your doctor, you should talk to your actual doctor if you have any kind of potential kidney issues and even if you’re in good health and want to try chugging a bunch of potassium, you should titrate up gradually the way the SMTM writeup suggests (which is also the way I did).
In addition to a general spirit of responsibility, those warnings are important because otherwise just telling you that this is easy would sound like a recommendation. Did I mention that the experiment was easy? Easy easy. Piss easy. Lemon squeezy, etc. Of course building an exercise habit wasn’t easy, but the potassium part didn’t make it easier or harder, and the potassium part itself was pretty trivial. Mix this powder into Gatorade a couple times per day, drink it, done.
That said, if you do want to try this, godspeed and please write down how it goes for you. I recommend building positive reinforcement into whatever you use to track it; my personal spreadsheet for this is adorned with color-coding and happy emoji. I also recommend at least thinking about the following questions, whether you’re going to do this, evaluate the results of this, or both.
How safe is it, in general rather than for me particularly, to chug this much potassium? This is the big one: “just mix potassium salt into Gatorade and drink it a few times a day” is so incredibly easy that even if the effect size is small, it could benefit a huge number of people, but of course it doesn’t benefit them if it’s not actually safe to do that.
Does this replicate? If it’s not safe it matters a lot less whether it replicates, so the safety question comes first, but if it is safe, then one would immediately want to find out whether it works for 1% of people, 10% of people, or 50% of people.
How much do other mineral nutrients, particularly sodium and magnesium, matter for this? Maybe they need to be combined in some specific way, as this Twitter thread suggests.
Do sex hormone levels matter? I’m a trans woman and I’ve been having problems with access to HRT in this timeframe. Given how many things in one’s body testosterone and estrogen affect, and given that previous obesity research has shown differences based on hormone profiles, that’s definitely something to keep an eye on. Also because spironolactone in particular messes with renal function and potassium metabolism, I expect that it affects this. Digression: spironolactone is total bullshit as an anti-androgen of first resort. It sucks and I hate it and I should have switched to other anti-androgens even sooner than I did. If you’re using spironolactone as an anti-androgen because it was the first thing your doctor tried for that, you really should try something else and see if that works.
I steadfastly avoided dieting. I like my existing diet just fine, and that’s why I preferred the “what if I just chug a bunch of potassium” plan. All else being equal, I’d rather try things that let me eat what I like than things that require throwing my relationship with food into upheaval. But of course you wonder, what would happen if you did combine dieting and exercise and potassium? The ExFatLoss guy has been busy trying a lot of diet-only interventions and he’s got a lot of interesting results. I am not the person to try it, but it’s one of the obvious things to try, so I hope someone does try it.
How does this interact with the munchies? If you decide to try what I tried and you, like me, enjoy living somewhere where marijuana is legal, I think you should look at whether the potassium changes how you experience marijuana-induced hunger/overeating. One of the things I found very striking about the matter is that it was possible for me to chug enough potassium that the marijuana-induced hunger was drastically reduced. I expected the opposite since the potassium was causing me to eat less (relative to exertion) at other times. However, I have very strong habits about marijuana (exactly twice a week, edibles only, same amount every time) and I’m not willing to change them for this, so who knows how this aspect will work out for others. Definitely something to keep an eye on, though. Even if I wasn’t losing weight, the potassium reduces marijuana-induced overeating enough that I’d probably keep going with it just for that effect.
Conclusion
I spent 6 months trying to lose weight with lots of potassium and exercise but without dieting. So far I have succeeded. Unless something disastrous comes up, I’m going to keep trying it for at least another 6 months and going to keep recording what I’m doing. I’m particularly curious to see where I’ll plateau, since I assume at some point I’ll start getting really hungry and/or tired instead of accidentally starving. I hope that my experience and the data I’ve recorded from it, are useful to people who are looking into questions about obesity and weight. Please feel free to use my data and my writeup (this post) for that. If you want to try doing as I’ve done, good luck and stay safe: this has worked for me but it is still experimental, it might be unsafe and/or fail to work for you.
I suspect more and more that the idea of “macros” is just as useless [as CICO], unless you subdivide each of the macronutrients so much further as to dilute the concept completely.
Carbs, fat and protein are definitely real, and they’re definitely a useful lens through which to view some problems. If you get too much protein, you really can kill yourself by rabbit starvation.
But this doesn’t mean that the macros are a useful lens for every problem related to nutrition. For example, we know they have basically no bearing at all on scurvy. So they may not be a good way to understand other issues, like obesity.
ExFatLoss makes a number of good points and we encourage you to read his essay. Here is a bit of extra commentary:
Ontology
First of all, ExFatLoss is doing the right kind of work here. In the 1980s, when obesity started looking like a major problem, macros probably seemed like a promising angle. But when you’ve spent 40 years attacking a problem from the same angle with no success, maybe it’s time to find a new angle. This is the kind of ontological remodeling that you need to crack tough problems.
If you commit to a lens too quickly, it’s easier to get locked in on assumptions that might turn out to be wrong. Related to this, we like the caution ExFatLoss shows in his naming conventions:
I changed the name because I wanted it to be more descriptive of what it was, not the proposed mechanism (lack of protein) – after all, I am still not sure that’s the causal factor.
But I also chose the “ex” (for experiment) part because it conveys uncertainty, and that the diet is in flux. It’ll evolve, hypotheses will be disproven. … In a sense, it’s almost like a serial number for an experiment, and I’ve added a few new serial numbers since: ex150deli, ex150sardines, ex150choctruffle, ex225.
…
Maybe we’ll figure out what exactly makes ex150 tick, and then we can nail down a more descriptive name. Until then, I’m hesitant, because it would be speculation and I’d rather have a serial number than a name that’s just flat out wrong.
Macros are probably just too “big”. Dividing all food into three categories is pretty broad strokes, and it won’t be surprising if it turns out that these strokes are too broad to be helpful. We can equally say that dividing all matter up into four elements didn’t work very well, and chemistry progressed much better once people got a handle on the fact that there was more than one kind of earth, that there are various airs, etc.
Phase of matter was the system of the world at one point, but today we don’t think so much about the solid/liquid/gas distinction — we no longer think of oxygen as a fundamentally different species of thing from copper. They’re not a type of air and a type of earth, they’re both elements, elements that happen to be in different phases at room temperature.
The other reason we don’t think obesity has anything to do with macros is because of history.
People ate all kinds of diets throughout history, including all sorts of “bad” diets. People tried every combo of macros, and never got obese.
Some cultures ate high-fat diets. Some ate low-fat diets. Some ate lots of carbs. Others ate almost no carbs. You name it, some culture probably tried it.
On top of this, people were subjected to all kinds of voyages, expeditions, crop failures, sieges, economic shocks, and migrations. When you’re under siege, you eat whatever happens to be in the city, so people besieged in different places ended up eating different weird diets just to stay alive.
These various shocks gave them all kinds of dietary diseases. Scurvy is famously associated with the age of sail, but also struck on the crusades. Beriberi is often found in prisons. And the ancient Romans discovered protein poisoning while sieging Intercatia around 150 B.C.:
Their soldiers were sick from watching and want of sleep, and because of the unaccustomed food which the country afforded. They had no wine, no salt, no vinegar, no oil, but lived on wheat and barley, and quantities of venison and rabbits’ flesh boiled without salt, which caused dysentery, from which many died.
The point is that throughout time and space, people have chosen or been subjected to almost every strange diet imaginable. These did give them all kinds of weird illnesses — we know that eating the wrong combination of things can make you sick in various ways. But as far as we can tell, these weird diets never made them obese.
This makes it unlikely that obesity can be caused by an imbalance in macros. If there were some ratio of fat / carbs / protein that could make you obese, someone would have noticed in the last 3000 years, because someone at some point would have been eating that ratio. History has provided a pretty thorough search of diet-space (not totally exhaustive, but covering a lot of ground) and has discovered lots of ways that a bad diet can fuck you up. But none of those ways was obesity.
ExFatLoss makes this same point:
There were of course a near infinite amount of diets people could’ve consumed back [in ancestral times]. All we know is they didn’t add refined flour and seed oils, because they wouldn’t have had those. But there might’ve been carnivorous ancestral peoples, fish-eaters, maybe some near-vegetarians. Some might have lived heavily off dairy. Some ate a lot of muscle meat, others more fat. The paleolithic era lasted over 3 million years and the earth is a big place.
So if obesity is a dietary disease, you’d think that some culture somewhere would have stumbled onto it at some point. As far as we can tell, that’s not the case. Though if someone can find an example of a reliably obese culture from before 1900, we would be very interested to know.
To us, this is strong evidence against any macronutrient cause of obesity. And in general, we don’t think obesity has to do with ANY nutritional element of food. Vitamin C isn’t a macro, but the random walk of diets through history discovered the related disease (scurvy), and eventually normal science discovered the cure and the underlying compound. If obesity were caused by some micronutrient or something, we think it also would have been stumbled upon in antiquity, and that since then we would have found the missing compound at fault.
The exception might be nutritional elements that were very rare until the late 20th century. If there’s some substance that it was hard to even get 1 mg of before 1940, but most people are eating 200 mg/day of today, it would make sense why no one had gotten fat off that substance until recently.
This is one point in favor of the seed oil theorists, who usually blame linoleic acid for the obesity epidemic. This compound has always been in foods, but it used to be much harder to get a lot of it. So if too much linoleic acid makes you obese (we don’t think it does, but just by way of example), it would make sense that no one before 1940 would have ever stumbled on this, because almost no one before 1940 was ever exposed to linoleic acid in these quantities. Hence such images:
We said, “we don’t think obesity has to do with any nutritional element of food”. But it might plausibly have something to do with non-nutritional elements of food, like pesticides or other contaminants. Again, if it’s something no one was exposed to before the 20th century, or that no one was exposed to in such modern quantities, then it isn’t ruled out by the relative absence of obesity before the 20th century.
Symmetry
It’s easy to assume the cure and the cause will be symmetric. For example, people who believe that a low-fat diet will cure obesity usually believe that this is because high-fat diets caused obesity. We think that high-fat diets can’t have caused the obesity epidemic, because people in history sometimes ate high-fat diets and didn’t get obese. Similarly, people who believe that a low-carb diet will cure obesity usually believe that this is because high-carb diets caused obesity, etc.
But it could be that something else (FACTOR X) caused obesity, and a low-fat diet happens to cure obesity for reasons totally unrelated to the cause.
This kind of thing is common. Antibiotics cure infections because they kill the bacteria that are making you sick, not because the infection was caused by a penicillin deficiency.
Empirically, it looks like macro-changing diets (e.g. low-fat, low-carbs, etc.) don’t reliably cause weight loss. But it’s possible that some nutritive diet could treat obesity — the potassium trial essentially fits this description, since potassium is a necessary mineral. We just don’t think a nutritive diet could cure obesity because of a matched deficiency.
So we did this half-tato diet community trial. People signed up for a minimum of six weeks — two weeks of baseline, so we could see how their weight changed when they were eating as normal, and then four weeks where they got around 50% of their calories from potatoes every day.
This was inspired by our original Potato Diet Community Trial, which worked pretty well. In that study, people lost an average of 10.6 lbs over four weeks eating almost nothing but potatoes.
We say “almost nothing but potatoes” because most people took multiple cheat days, and it didn’t seem to make much of a difference. Combined with a couple of case studies, who reported enormous success on a half-tato diet (in particular, M with his potatoes-by-default), this made us wonder if a half-tato diet could be made to work almost as well as a full-tato diet.
Anyways, let’s look at some results.
Today’s analysis is based on a snapshot of the data taken on June 1, 2023 (about 10 weeks after the study was launched). This means we have up to 10 weeks of data, specifically 2 weeks of baseline and 8 weeks of half-tato. A few people are still going with the half-tato diet, but we will look at their data later.
The dataset is mostly straightforward, but here’s one note: One or two important measurements were missing for a small number of people. For example, they might have entered a weight for Day 28 and Day 30, but not Day 29 (which is important because Day 29 is the end of the first four weeks).
When an important measurement like this was found to be missing, we filled it in by making the missing measurement the average of the two values around it. For example, if the weight measurement for Day 29 was missing, we filled it in with the average of the weights on Day 28 and Day 30.
We did all these replacements before doing the analysis, and only a few measurements were interpolated like this.
As usual: raw data, the analysis script, and study materials are available on the OSF.
Participants
A total of 123 people filled out the signup form.
Of those, 8 people filled out the form incorrectly in such a way that we couldn’t sign them up (they didn’t enter an email, didn’t enter critical data such as height, etc.). We enrolled the remaining 115 people in the study.
Of the 115 people who were enrolled, 92 entered at least one day of weight data.
For people who entered any data, the most common outcome was to make it the full 2 weeks baseline + 4 weeks half-tato, though people dropped out at various points along the way, and a few people didn’t finish the baseline two weeks.
Here you can see how many days people completed. In this figure, the vertical line at 0 divides the baseline span (Days -14 to -1) from the half-tato span of up to 8 weeks (Days 1 to 57).
Let’s summarize that plot. As of the snapshot on June 1st:
92 people entered at least one day of weight data
75 people made it to Day 1, past the baseline period of two weeks
38 people made it to Day 29, the end of the first 4 weeks of half-tato
8 people made it to 8 weeks or further, and some are still going
For this analysis, we will mostly be focusing on weight change up to Day 29, since there’s not much data past that point.
Weight Change over Baseline
First let’s look at the baseline. Similar to a crossover design, this baseline serves as a kind of control group.
There was very little average weight change in the baseline period, and it was not statistically distinguishable from zero. Here’s the histogram of weight change over baseline, with a black vertical line at 0 lbs (i.e. no weight change over baseline) and a red dashed vertical line at the mean weight change:
The mean weight change over this period was -0.22 lbs, with a 95% CI of -0.70 lbs to 0.27 lbs. This is not statistically distinct from zero.
The mean suggests an average loss of 0.11 lbs per week on average, or 0.35 per week if we take the lower bound of the confidence interval.
Of course, it’s also consistent with an average weight GAIN of 0.14 lbs per week if we take the upper bound of the confidence interval.
In previous studies, people have expressed concern about the Hawthorne effect— that when we ask people to measure their weight, they might start losing weight simply because they are aware that their weight is being observed. Looking at the baseline period, we find very little support for this idea, even with a sample size of 75 people.
Observing your weight for two weeks just doesn’t change it much, and likely doesn’t change it at all. Going forward, we will continue to not worry about the so-called Hawthorne effect.
(Also, it’s amusing to see that Wikipedia kind of drags this whole idea: “some scholars feel the descriptions are fictitious” and “J. G. Adair warned of gross factual inaccuracy in most secondary publications on the Hawthorne effect and that many studies failed to find it.”)
Here’s a plot of weight change over baseline, including only people who finished the two-week span. As you can see, these look like a bunch of random walks around zero.
Weight Change at Four Weeks
Our main interest is weight change on the half-tato diet, specifically people’s weight change between the morning of Day 1 and the morning of Day 29. Here’s the histogram of that variable, with a black vertical line at 0 lbs (i.e. no weight change over 29 days) and a red dashed vertical line at the mean weight change:
People lost 1.7 lbs on average over these four weeks, and that loss is significantly different from zero, t(37) = 2.70, p = .010. Another way of putting this is that 27 out of 38 people (71%) lost at least some weight.
By now we’re sure you’ve noticed the extreme outlier, the person who reported losing 17 lbs over four weeks (participant 25348806). This outlier is impressive, and we’ll look at her results in more detail later, but excluding that person doesn’t change the overall results. Without the outlier, average weight loss is 1.3 lbs over four weeks, and that loss remains significantly different from zero, t(36) = 2.66, p = .012.
We see that weight loss is significantly different from zero. People do seem to lose weight on the half-tato diet.
But we should also emphasize that they don’t lose much — the effect size here is a disappointment. We had hoped that the half-tato diet might have around half the effect of the full potato diet, but that just didn’t happen.
Overall, the effect is less than half the effect of the original potato diet. Average weight loss on the potato diet was 10.6 lbs, so half of that would be 5.3 lbs. Instead we see only around 15% of the effect of the full-tato diet.
We should note that there are some mitigating factors here. In particular, about 30% of participants in the half-tato diet started out as “normal weight” (BMI < 25), compared to only about 15% in the original potato diet. (In the original study, people who were obese or overweight tended to lose more weight, so this means the average weight loss will look smaller when there are fewer obese or overweight participants.)
But weight loss on half-tato is still quite minor, even if you limit the analysis just to overweight (BMI > 25) participants, who lost 1.8 lbs on average, or obese (BMI > 30) participants, who lost 3.1 lbs on average. This is still much less weight loss than on the original potato diet.
Another way to put it is like so: On the original potato diet, 64 people made it 4 weeks. One of those people lost no weight. Everyone else lost more than the AVERAGE weight loss on the half-tato diet. It’s really no contest; full-tato is overwhelmingly more reliable and causes overwhelmingly more weight loss, at least among the people who can make it four weeks on mostly potatoes.
Frankly, this just emphasizes how successful the original potato diet study was. In fact, on reflection the Potato Diet Community Trial was probably the most successful weight loss study of all time. Are there any other studies that caused weight loss in 98% of people who finished the study, and caused an average of 10.6 lbs of weight loss over just four weeks? Not that we know of.
Trajectory
As we mentioned, there’s one extreme outlier who lost 17 lbs over four weeks. You may also have noticed a less-extreme outlier who lost 9 lbs, who happens to be someone who participated in the original Potato Diet Community Trial and saw a lot of weight loss there as well, losing 19 lbs. Both of them stand out quite clearly in a plot of people’s weight loss trajectories:
Having seen some reports like this one, we wondered if there might be a yo-yo effect on the half-tato diet, where in the beginning people lose weight no problem, but at some point the potato effect stops working and their weight heads back to baseline. That seems like a reasonable way to interpret this plot:
But overall, this doesn’t seem to be the case. In general, half-tato weight loss over four weeks seems small but constant:
Weight Change at Eight Weeks
We also have a tiny bit of data on people’s weight loss taking the half-tato diet out to eight weeks. Here’s the plot:
The average weight loss at eight weeks is 3.6 lbs, though you can see that one person has lost more than 10 lbs. With only eight individuals, this is too few people to do a statistical analysis. But it does suggest that longer spans on the half-tato diet may be effective.
Note that the extreme outlier does not appear in this group — that person only sent us data up to Day 29.
Here’s the whole span from everyone who finished baseline (minus our main outlier), showing all data points from the start of baseline to the end of eight weeks:
What Things Correlate with Weight Loss
There’s not much variation in people’s weight loss over these four weeks, but some people did lose more weight than others. This makes us wonder if there are any variables that might be correlated with weight loss.
Take the analyses below with a grain of salt. They’re very exploratory. The sample size is small. We’re not correcting for multiple comparisons. And of course, all these correlations are correlational.
As you well know, correlation does not imply causation — but as XKCD reminds us, “it does waggle its eyebrows suggestively and gesture furtively while mouthing ‘look over there’.” Correlations can still be suggestive, and if any of the correlations we find are real, we should eventually be able to demonstrate the same relationships experimentally. So let’s take a look and see if anything stands out.
BMI
Our first surprise is that BMI doesn’t seem to have much to do with weight loss.
The correlation between weight loss and starting BMI is relatively small, and is not statistically significant, r(36) = -0.29, p = .078.
Protocol
We let people sign up for three different protocols for the half-tato diet, three different ways you could try to get about 50% of your calories from potatoes. People ended up about evenly split between the three approaches:
Here is a plot of weight loss by each of the protocols:
As you can see, there are no huge differences in weight loss between the three protocols, though Potatoes-By-Default includes the outlier who lost the most weight.
Percent Potato
We asked people to estimate what percent of their total calories they were getting from potatoes each day, and some people reported getting a much higher percent potato than others. Since some people were doing about 50% potato, and others were doing only about 10%, you might suspect that the diet caused more weight loss for people getting more potato.
This is much more muddy than we expected. Getting closer to 50% of your calories from potatoes does seem to maybe cause more weight loss, but if so, it’s not super clear. The correlation is quite small and not significant, r(36) = -0.28, p = .084, and weaker if you exclude the major outlier, r(35) = -0.24, p = 0.147.
It’s hard to imagine that percent potato doesn’t matter at all, and we do see that the three people who lost the most weight were all getting close to 50% potato. This suggests that for best results, you should try to get around 50% potato on average. But there isn’t a clear correlation overall.
Dairy
In the original Potato Diet Community Trial, we asked people to avoid dairy entirely. This time around, we decided to just ask people to track how many servings of dairy they got each day. This lets us look for any correlation between dairy consumption and weight loss on half-tato.
There may be a bit of a trend where more dairy is related to less weight loss, but the person who lost the most weight ate plenty of dairy, and the overall correlation is not significant, r(36) = 0.15, p = .355.
That said, the relationship is slightly stronger if we exclude the outlier, though still not significant, r(35) = 0.29, p = .078.
Tomato
We were also concerned that tomato products might interfere with potato-based weight loss. So just like dairy, we asked people to track how many servings of tomato products they had each day. Here’s the scatterplot:
Surprisingly, this relationship is significant, even with such a small sample. The overall correlation is r(36) = 0.37, p = .021, and it remains significant if you remove the extreme outlier, r(35) = 0.36, p = .031.
You can see that the two outliers, people who lost the most weight, almost entirely avoided tomato products on the diet. Also interesting is that the person who gained the most on the diet happens to be the person who ate the most servings of tomato products.
This is correlational, not corrected for multiple comparisons, etc., but it does provide more support for our suspicion that tomatoes interfere with the potato weight loss effect. This would be great to experimentally confirm at some point, and it should be relatively easy to test — just assign some people on a potato diet to use ketchup, and others to eat their potatoes bareback, i.e. no ketchup. In the meantime if you are trying to lose weight using potatoes, we certainly encourage you to avoid ketchup.
Cooking Method
We’ve previously mentioned that boiling or soaking potatoes removes a lot of their potassium. So we’re curious to see if people who boiled their potatoes lost less weight than people who baked, roasted, fried, or otherwise kept their potatoes for the most part whole and un-leached.
Most people didn’t leave detailed notes on how they prepared their taters, but the people who did leave notes often mentioned either boiling them or using frozen potato products, which are generally pre-boiled / blanched / parboiled.
This might explain why the half-tato diet did not cause much weight loss on average — if we’re right, and the weight loss is caused by potassium (or anything else in the potatoes that is leached out on boiling/blanching/soaking; who knows, maybe iodine), then many people were consuming less effective potatoes.
There aren’t enough reports to bother hand-coding preparation method or doing an analysis, but here are some examples:
(42475044) Most of my potato meals were a 50/50 mix of roasted yellow potatoes (partially peel 1 inch cubes, lightly oil, 375 convection for 45 minutes), and store-bought frozen french fries (whatever seemed to have the least oil) cooked in the air fryer with no additional oil.
(63062664) My protocol was mostly whole boiled potatoes pan-fried in ~15g of butter or a small glug of rapeseed or olive oil. Usually ~1kg for breakfast + lunch.
(78152385) I ate mainly russet or golden potatoes, baked or roasted, and I didn’t eat the skins of the russet because last time I did that it gave me the worst stomach cramps I’ve ever had. I also ate a lot of Alexia french fries with sea salt, and some sweet potatoes.
(80975703) I always ate potatoes I had boiled in batches and kept in the fridge. My favourites were red potatoes, half peeled, but I also had yellow or white potatoes, fully peeled. Always with a bit of olive oil and salt and spices, chopped up and reheated in a pan on the stove.
(28228309) I had visions of making home-made latkes or really fine hash browns. I just didn’t make time. While I know we are supposed to start with whole potatoes, I’m sure glad I found frozen potato patties at the store, or there’s no way I could’ve even approximated the quantity of potato I needed. I put my toaster to 6 (nearly the highest setting) and toast them twice, and they’re great, and I could do it for breakfast on work days.
(30834698) I do not like skin on the potatoes; I can eat it, but I do not like the taste or how it makes me feel; I prefer them without skin, so I mostly eat them like that; usually just boiled with a pinch of salt, sometimes in the oven, sometimes with a drop of olive oil; sometimes with some harissa; the easiest and tastiest for me was boiled with salt, then peel the skin and eat them
(72618178) In general I was making homemade oven-baked ‘fries’ (thinly sliced par-boiled potato). I would often give in and allow myself ketchup or spicy mayo. I also went through some phases of doing homemade gnocchi, mashed potato, and faux-dauphinoise (thinly sliced, stacked, oven-baked potatoes with veg stock and a bit of butter).
As you can see, many people boiled their potatoes or used frozen potato products that were likely boiled in some way before freezing. But to be fair, this does not describe everyone. Some people did report mostly baking or roasting:
(58681391) I usually baked an entire 5 lb. bag of gold potatoes at 350 for 1.5 hours, for roughly three servings. I didn’t use oil when baking but would sometimes refry the baked potatoes into hash browns with about 1 tsp of avocado oil.
(70030447) My main method for eating potatoes, as I work from home, was to chuck a few russets in the oven for an hour after coating them in salt and pepper, then once they’re done I would cut them into two halves and eat those entirely. I found olive oil a hassle, and putting salt and pepper on the insides after they’re done was also too much hassle for me to want to bother doing everyday. Maybe I’d do that if I cooked them some other way.
Despite eating baked or roasted potatoes, neither of these people lost weight. The first saw no change at all, and the second gained 4 lbs. This is enough to show that baking or roasting is not enough to ensure weight loss.
But there may be other reasons these two didn’t lose any weight. 58681391 ate a lot of tomato and dairy, and got only about 38% of their calories from potatoes. 70030447 ate an unusually large amount of dairy (third most out of everyone) and got only about 20% calories from potatoes.
In any case, we still suspect that starting with whole, raw potatoes, and not boiling, soaking, or blanching them, might be important for causing potato weight loss. We didn’t make people roast or bake their potatoes in the original potato diet study, but maybe with +90% potato, it doesn’t matter.
It might have been an oversight not to ask people to roast or bake their potatoes for the half-tato protocol. If you’re trying it for yourself, probably don’t boil them or live off of frozen french fries.
Regression Analysis
To wrap up these correlational analyses, we fit some regression models to try to predict weight change from multiple factors at once. In all these models, we excluded the outlier who lost 17 lbs, participant 25348806, because we wanted to try to understand things that might have impacted weight change for the average participant, who did not lose so much weight.
One especially strong model included total dairy consumption (p = .007), total tomato consumption (p = .003), and their interaction (dairy * tomato; p = .035). This interaction had a negative sign, suggesting that tomatoes and dairy are slightly less than the sum of their effects. All three terms were significant predictors of weight change, and the model explained 23.7% of the adjusted variance in people’s weight change.
This was a much better fit than we expected, especially given the small sample size, and it provides more support for the idea that tomato and dairy consumption for some reason inhibit the potato weight loss effect. Note that this is TOTAL dairy and tomato consumption over four weeks, not average daily consumption, which provided a weaker fit.
This was not the best model we found, however. When you dummy-code the three potato protocols, and put them in a model with total tomato consumption and the two-way interactions, many terms are significant (for example, True Half-Tato condition * tomato sum is significant, p = .0004) and the model explains 37% of the variance in weight loss. We literally are not sure what to think of that, and are not sure how to interpret this result.
In any case, these are very simple models. It will be hard to squeeze more information out of just 37 observations, but if you have experience with more complex forms of statistical modeling, we encourage you to download the data and see if you can make more sense of it than we can.
Potatosis
Some people liked getting half of their daily calories from potatoes:
(23555212) This was cool! I have a newfound appreciation for potatoes.
Other people did not:
(28228309) Oh happy day. No more forcing myself to eat bland potatoes.
(81471891) Not super happy with my mindset about this diet. It’s currently “I *have* to eat 1 kg of potatoes per day!”, and feels a bit forced.
This is kind of striking compared to the absolutely rave reviews we got about the 100% potato diet, where most people said that they loved it. You’d think that eating 100% potatoes would be a bigger ask and a bigger pain than eating just 50% potatoes, but apparently not.
This makes us wonder if most people in this study never went into “potato mode”. In the original potato diet study, we found that after a day or two of eating potatoes, most people’s appetites waned, they didn’t want anything aside from potatoes, and they began to steadily lose weight. This seemed like a separate “mode” the body can be in, that both caused weight loss and made it easy to eat nothing but potatoes without major discomfort.
If something about the half-tato diet keeps people from going potato mode — the percent potato wasn’t high enough, the potatoes were prepared wrong, ketchup is a potato inhibitor, etc. — that would explain why people didn’t lose much weight, and why many people found it difficult to stick with even a mere 50% potatoes.
This is corroborated by a comment from one person who was also a participant in the original potato diet study, and says that they found half-tato very different:
(42475044) Overall this didn’t work anywhere near as well for me as the full potato. My weight over the last 8 weeks has largely stayed the same, whereas on the full-tato I lost 9 pounds in 3 weeks. I could definitely feel that the potatoes were helping me not gain weight, but I think my non-potato calorie intake was just too high for the potatoes to compensate for. On the full-tato diet I was able to eat as much as I wanted and still lose weight, but that doesn’t seem feasible for me on half-tato.
That said, at least one person on the half-tato diet did report signs that sound a lot like potato mode:
(21268204) Sweating at night, which I never do otherwise. Appetite low… Get full really fast even when eating non-potatoes … 2nd day in a row that it didn’t occur to me to eat until 4pm … Have not been hungry at all the last few days. The calories I did get were because I forced myself to sit down, mostly, with some potatoes
This participant lost only one pound over the first four weeks, but kept going and lost 3.5 lbs over eight weeks.
All this suggests that there might be a right and a wrong way to do half-tato. If you do it wrong, basically nothing happens, maybe you lose a little weight on average. But if you do it right, you go into potato mode, much like on the full-tato diet, and you start losing weight very quickly.
Let’s assume for the moment that there is such a secret magic switch (or set of switches) that can make half-tato cause rapid weight loss, and try to figure out what it is. If there is such a switch, then almost everyone on the full potato diet tripped it. All the case studies (like M) managed to trip it. The major weight-loss outlier in this study, and maybe some of the less major outliers, seem to have tripped it. Maybe they were doing something right that puts you in potato mode — so what would that be?
The extreme outlier (25348806) in this study give us a fairly detailed report of how she approached half-tato, saying:
I signed up for a spreadsheet for 52 weeks. I’m doing the diet and have had great success … Am female with 100 or so lbs to lose (now 30 down).
I first lost about 15 lbs doing a very loose version of potato by default after first reading your blog pre half tato experiment and have since lost another 15 beginning April 22 with starting half tato in earnest. I steam peeled yukon gold in batches in the Instant pot for 12-15 minutes at high/manual (depends on size, I try to get bigger but often its just medium available). Right out of the instant pot I add white vinegar which helps preserve color and appearance and tastes great later (more subtle than adding vinegar at mealtime) before cooling and fridge. I started eating a mix of cold and hot depending on if microwave is available (sometimes with mustard) but now I’ve settled into just hot (2 min microwave) with mainly salt. I try to have this 2-3 meals out of the day (2 medium or 1 big 1 smallish per meal). One of the 2 potato meals I may add one of: poached egg yolks; calf liver lightly sauted in butter (plus lingonberries and/or honey); or cooked ground beef (with 21 gun salute seasoning from trader joes and sometimes full fat sour cream), and possibly pepper or cholula sauce (rare), occasional oysters (fresh or canned). I don’t add ketchup (except once – when I went out and had beef fat fries at a steakhouse bar which did not seem to stall). I really enjoy the potatoes and look forward to them. I am not hungry but feel satisfied. I also have dairy – at least one glass of milk a day (either raw whole milk or 2% or whole conventional) – and a small amount of juice or lemonade. Some mornings I may have full fat yogurt with collagen and stearic acid (see fireinabottle.net) but not all mornings. I have some extra potassium as well as other supplements.
We love the level of detail, but it’s hard to know which of these elements are required to enter potato mode, if any of them are. But there are some features that this outlier and all the half-tato case studies (M, Nicky, and Joey “No Floors” Freshwater) share:
Nicky had a bit of ketchup, but everyone else either never or almost never had ketchup with their potatoes.
None of them avoided dairy
All of them mention eating meat and eggs
All of them used butter and/or oil
None of them ate boiled potatoes; their potatoes were generally steamed, air fried, microwaved, or baked
To us, this further supports the idea that at least part of the secret switch is eating not-boiled whole potatoes and mostly avoiding ketchup and tomato products. Dairy doesn’t seem to matter much, or at least it didn’t stop these people, and neither do various fats, meat, or eggs. Of course, it’s difficult to tell if there might be some ADDITIONAL element that they are all getting right. Are they all getting lots of magnesium or something? Hard to say.
Just in case it helps, here’s a closer look at the other people who lost relatively large amounts of weight on the half-tato diet:
Participant 26130773 lost the second-most over four weeks on half-tato, a total of 9 lbs. Overall he ate a good potato percentage, reporting 40%-60% most days, though on some days he only got 20%.
This participant left almost no notes and didn’t report his dairy or tomato intake, which makes it hard to figure out what he might have been doing right. But one thing that jumps out is that it’s clear he was eating lots of eggs. Here are his notes from the first three days of the diet:
5 eggs, potatoes for lunch (350 cal eggs. If I do 2 yokes 3 whites, 190 cal) Protein shake (120) for snack Turkey b patty, salad (600?)
5 eggs w 2 yolks, few bites turkey (225) Protein shake (120) Soup w meatballs (500)
5 eggs w 2 yolks (190) Protein shake (120) Normal dinner cheat (900) 2 drinks
Participant 56896462 lost the third-most over four weeks on half-tato, a total of 6 lbs. He had a very good potato percentage, 40% or 50% almost every day. He ate some dairy and some tomato, about 2 servings of dairy a day and 1 of tomato, on average. He also left very few notes, though we notice that he is in Italy.
Conclusions
The half-tato diet causes some weight loss in most people, but for most people, it is much less than half as effective as the full potato diet. If you really want to lose weight, probably go for the full potato diet instead, and try to get as close to 100% of your calories from potatoes as you can.
However, a small number of people do lose a lot of weight on the half-tato diet. This suggests that there might be some way to go into “potato mode” while on half-tato, if you do it right. If we could find out how to make this happen reliably, that would be pretty neat.
Our guess is that it involves some combination of:
Baking, steaming, microwaving, or roasting whole potatoes instead of boiling them or using pre-boiled frozen potato products
Avoiding tomato products, especially ketchup
Getting enough of something else, possibly something found in eggs, meat, or dairy.
We should note that this list is largely based on circumstantial and/or correlational evidence. We do worry that ketchup might be a potato-blocker, but the evidence is not yet all that strong. That makes all of these guesses good subjects for future experiments.
You could design a large trial to answer these questions — randomly assign 100 people to do half-tato with ketchup and 100 people to do half-tato without — but you might need a very large sample size to be able to detect a difference. And while we’d love to see more community trials, it may not be practical to do multiple trials of several hundred people each, one after the other, to try to chase down whether each of these things makes a difference. That seems like it would take forever and be a lot of work.
So instead, another option would be for individuals to test these guesses as a self-experiment, which could provide very strong evidence, and might be able to provide it quickly.
For example, let’s say that Gary is a fellow who is happily losing 2 lbs a week on the full-tato or half-tato diet. Whatever makes potato mode happen, Gary has found it, even if he doesn’t know what he’s doing right.
Now Gary can test individual switches to see if they turn potato mode off. For example, he can randomly assign some weeks to be ketchup weeks, where he always has ketchup with his potatoes, and other weeks to be no-ketchup weeks, where he religiously avoids ketchup and all other tomato-based foods.
If Gary’s weight loss always stalls on ketchup weeks, but continues humming along on no-ketchup weeks, that’s a pretty clear sign that avoiding ketchup is one of the switches to make the half-tato diet work. If the randomization makes no difference, that’s a pretty clear sign that ketchup doesn’t matter, at least not for him.
You can imagine a similar design for anything else. Gary could randomly assign some weeks to try only boiled potatoes, and other weeks to try only baked potatoes, and see if it makes any difference.
We doubt things will be this simple — it’s quite possible that one brand of ketchup kills the potato effect, while another brand has no impact — but we won’t know until someone has tried. It might take several weeks to pick up a clear signal, but anyone who is able to get a potato diet working for them can test any of these switches out for themselves.
All we ask is that if you try something like this, please publish your results online, regardless of how it turns out. We’re very curious to know what will happen!
Closing Notes
Some people have gone for more than eight weeks on half-tato, and we plan to analyze their results at some point in the future. It will be a small sample size, but we are excited to have some more case studies. So stay tuned.
If you are interested in doing an N=1 experiment about these ideas and want our help designing a protocol, please feel free to contact us.
If you would like to be notified of future stupid studies, or if you want to keep up with our work in general, you can subscribe to the blog by email (below), or follow us on twitter.
And if you feel like reading this post has added a couple of dollars’ worth of value to your life, or if you have lost weight as the result of our research and you think it improves the quality of your life by more than one dollar a month, consider donating $1 a month on Patreon.
Thanks for going on this journey with us.
Sincerely, Your friendly neighborhood mad scientists, SLIME MOLD TIME MOLD
In the original potato diet study, we asked people to try to eat nothing but potatoes. This worked pretty well — people lost 10.6 lbs on average over just four weeks.
But we also told them, “perfect adherence isn’t necessary. If you can’t get potatoes, eat something else rather than go hungry, and pick up the potatoes again when you can.”
People took this to heart. We asked people to track how often they broke the diet, and almost everyone took at least one cheat day.
Five people said they stuck to the diet 100%, but everyone else said they broke the diet at least once. Most people cheated only a few times, but as you can see from this histogram, a substantial minority cheated more than half the time:
Taking these cheat days didn’t seem to matter much. Almost everyone lost weight, even if they cheated a lot:
In general, the more often people cheated, the less weight they lost. But even the people who cheated the most still lost around 5 lbs.
Realistically, our original potato diet study was really more like a 90% potato diet. People took quite a few cheat days, and it mostly didn’t seem to matter. Makes you wonder how low we can push that percent and still have it work — after all, the original weight loss effect was ginormous.
This is one reason why today we are announcing a 50% potato diet study. We’re looking for people to volunteer to get about 50% of their calories per day from potatoes for at least four weeks, and to share their data so we can do an analysis. You can sign up below.
Case Studies
The other reason we’re doing this study is a number of extremely interesting case studies.
Case Study: Joey No Floors Freshwater
The earliest case study comes from Joey “No Floors” Freshwater, who shared his story on twitter. He did a version of the potato diet consisting of “1-1.5lbs of potatoes a day when I could”. This comes out to about a 20% potato diet, and it turns out the 20% potato diet works quite well, at least for Joey.
Sadly Joey is no longer on twitter, but we do still have the screenshots:
Nicky Case Study: Nicky Case
The second case study comes from Nicky Case. Nicky participated in the original potato diet study and lost more than 10 lbs over four weeks, without much difficulty. This is kind of striking because Nicky was pretty lean to begin with.
After the potato diet ended, her weight slowly climbed back up. So 50 days after the end of the potato diet, she started a half-tato diet (“at least ONE meal per day is potato”). On the half-tato diet, she lost weight at about half the rate she did on the potato diet, and described it as “TRIVIALLY EASY to do”. Here’s the figure:
This is very encouraging. Nicky tried both the potato diet and the half-tato diet for more than 40 days each, and the direct comparison makes it pretty clear that the half-tato diet caused about half as much weight loss, at least for her.
M tried a version of the potato diet he calls “potatoes by default”. He describes this approach like so:
If I didn’t have anything better to eat, I’d eat potatoes. This meant that if I had plans for lunch or dinner, I would eat whatever it was I would’ve normally eaten ad libitum, and I tried actively to prevent the diet from materially interfering with my lifestyle (I drank alcohol socially as I normally would’ve, I participated in all the meals I normally would’ve participated in with friends, I tried arbitrary new dishes at restaurants, etc.). … In practice, “potatoes by default” meant I was eating potatoes for roughly 1/3 of my meals, mostly for lunch when I was working from home during the week or on weekends, since I usually had dinner plans of some kind.
This relatively potato-light approach caused surprisingly rapid weight loss. M describes it like so: “I think my main reaction to the data was that it was kind of insane? I was eating potatoes a third of the time and literally whatever else I wanted the rest of the time, and losing weight almost as quickly as the full potato diet.”
Here’s the figure. The chart on the right is just a zoomed-in version of the chart on the left, the vertical red line is when he began the potato diet, and the gray bars are when he was traveling and ate no potatoes:
The orange dots in this plot follow the daily averages for the full-tato diet we did. You can see that they are very similar to the blue dots, which are M’s data. When M says that he was losing weight almost as quickly as the full potato diet, he wasn’t joking. While the half-tato diet worked about 50% as well for Nicky, “potatoes by default” seemed to work much better than 50% for M.
You’ll also notice that M kept on “potatoes by default” for much longer than 30 days, and while the weight loss seems to slow a bit near the end, he keeps losing weight for basically the whole period covered in the plot. He loses more than 10% of his body weight over about three months! And he wasn’t even getting that many calories from potatoes — only like 30%!
Design
That’s why we are running a half-tato diet community trial. Let’s take a look at the design!
Half-Tato Diet Protocol
The half-tato diet is very flexible. As long as you are getting around 50% of your calories each day from potatoes, you’re on target.
Here are three ways of doing half-tato:
❖ True Half-Tato: Try to get 50% of your calories from potatoes each day, however you want.
❖ Potatoes-by-Default: This is M’s plan, and it worked well for him. Basically, if you don’t have any other plans for a meal, eat only potatoes (a little cooking oil and spices/hot sauce are ok, but nothing substantial). Otherwise, if you are seeing friends or going on a date or anything else, eat as you normally would. If you choose this plan, consider taking a close look at M’s email to us where he describes his protocol in more detail.
❖ Potato Meal: Have one meal a day be nothing but potatoes (with basic spices, etc.). For other meals, eat as normal. This is basically what Nicky Case tried for her half-tato diet. She describes it as “½ the weight-loss effect, but it was *much* easier than Full-Tato. Trivially easy, even.”
On the signup sheet (linked below), we will ask you to indicate which approach you are planning to follow. You don’t have to stick with the approach you choose, but it will be good to know which approaches are most popular, and if there happens to be a big difference between these approaches for some reason, maybe we’ll be able to pick up on it.
When you’re not eating potatoes, please eat as you normally would. The goal is to see how the diet works when you otherwise eat, exercise, and live as normal, so try not to change too much.
We do, however, have two small suggestions.
In the original potato diet study, we asked people to try to avoid dairy. But now we are not so worried about it. For the half-tato diet, please feel free to continue eating dairy if you want. We will just ask you to track the number of servings of dairy you eat each day on your data sheet. That way, on the off chance that dairy does make a huge difference, we may be able to detect it.
The second has to do with tomato products, especially ketchup. We reached out to the case studies we mentioned above, and most of them told us that they didn’t have ketchup with their potatoes, or didn’t have it very often, so “no ketchup” may be important for the half-tato diet to work. You may want to avoid tomato products and not have ketchup with your potatoes, but it’s really up to you.
Like with dairy, we will just ask you to track the number of servings of tomato products you eat each day on your data sheet. That way, if tomatoes stop the potato effect for some reason, we may be able to detect it.
To sum this up:
Get around 50% of your calories from potatoes each day, using whatever method (one potato-only meal a day, potatoes-by-default, etc.) you like.
Start with whole, raw potatoes when you can, consider cooking them in a way that keeps them as whole as possible.
Otherwise, eat as you normally would. Don’t consciously eat better, but also don’t consciously eat worse.
On the spreadsheet we share with you (below), track your weight, approximate percent potato for each day, your energy, mood, and the ease of the study, as described on the sheet.
Track servings of dairy just in case, don’t bother avoiding it if you don’t want to.
Track servings of tomato products, just so we can see if there’s a difference. Maybe consider avoiding them, especially if you’re not losing weight.
Track any bonus variables you’re willing/interested to track.
On the first day of half-tato, start eating potatoes as per the approach you chose above (e.g. potatoes-by-default). As long as you are feeling ok, keep trying to stick with it. The effect sometimes takes a couple days to become clear; there’s lots of variation between different people; you may lose a little weight one day and gain weight the next; don’t worry if the effect takes a little while to show up.
If you start feeling bad or weird, try one of these helpful hints:
Eating a potato (or something else). Hunger feels different on the potato diet and you may not realize that you are hungry. Yes, really.
Drinking water.
Eating a different kind of potato. Different varieties of potatoes may seem like they’re all pretty much the same, but they can really be quite different, and if you’re eating a lot of potatoes, these differences become much easier to notice. You will almost certainly want to eat more than one kind of potato.
Peeling your potatoes. Eating less peel / no peel seems to help some people with digestive and energy issues, especially after a few days on the diet.
Eating more salt. Potatoes are naturally low in sodium and you may not be getting enough. They’re also high in potassium, which can throw off your electrolyte balance if you don’t get enough sodium to match it.
If you try these things and still feel bad or weird, take a day or two off the half-tato diet and just mark down on your sheet that 0% of your food (or whatever) for those days was from potatoes.
If you start feeling really bad, or you otherwise can’t make the half-tato work for you, just stop the trial early. We don’t want anything bad to happen to you. Just send us an email to close out the trial as normal (see below).
Two-Week Baseline
In our previous community trials, we didn’t include a control group. This is because we expected the effect sizes to be ginormous. People don’t, generally speaking, spontaneously drop 10 lbs in four weeks, so it’s clear the weight loss on the potato diet is “real” without the need for a control group.
This worked less well for the potassium trial, but we wanted to get the biggest sample size we could for that study, and we weren’t sure how many signups we would get beforehand. We stand behind the idea that when you’re trying to estimate an effect size, it’s good to get as many people in the experimental condition as possible.
We’re still not going to include a control group, because we don’t think it would be very interesting to recruit half of you to sit around and do nothing for several weeks, and it wouldn’t teach us very much.
But we will do the next-best thing, and that’s to ask you to take a baseline of your weight change without the half-tato diet. For the first two weeks of the study, eat as you normally would, and track your weight over time. Then on the fifteenth day, start the half-tato protocol and get on to eating lots of potatoes. It’s simple.
This lets us use everyone as a control group for themselves, sort of like a crossover design. While this design wouldn’t work for everything, we think it works pretty well for the half-tato diet.
Variable-Span Signup
We’d like you to try the half-tato diet for at least four weeks. With the two-week baseline, this is a total commitment of six weeks.
But if you’re willing to go further, we would be really interested to have that data. So for the half-tato diet community trial, we are opening things up and letting people enroll for however long they want.
Credit where credit is due, this part of the design was Nicky Case’s idea. She describes it as a “hey this trial runs for however long you want, and we’ll just report data every month for whoever hasn’t dropped out yet” design, and we think it makes a lot of sense.
This is a bit like what we did with the potassium trial — we asked people to keep going to 60 days if they were willing, some did, and we reported on their data in a second analysis post. We want to do the same thing in this study, except that we’d like to ask you to sign up for longer spans up front, if you’re willing.
We won’t hold you to this. It’s not a commitment. We’d just like to know up front how long you’re planning to sign up for. If you can’t make it that long, that’s fine. Just tell us how long you’re thinking you might try.
(Obviously you can also keep going for longer if you want, don’t let us stop you.)
For example, you can sign up for:
2-week baseline + 4-week half-tato
2-week baseline + 8-week half-tato
2-week baseline + 12-week half-tato
And so on and so forth, all the way up to 2-week baseline + 68-week half-tato. We will take snapshots of the data at relevant intervals and analyze the data up to that point.
Sure, “report every month on whoever hasn’t dropped out yet” has a selection bias. The people who sign up for 52 weeks will not be your average ordinary citizens. In fact, they will be paragons, heroes. But that doesn’t concern us. We still want to see those data.
And if you sign up for 52 weeks but it turns out no one can actually be bothered to do half-tato that long, that’s still useful data. Just think about it. 😉
Sign Up
Ok researchers, time to sign up.
The only prerequisites for signing up are:
You must be 18 or older;
In generally good health, and specifically with no kidney problems;
Willing to do a two-week period of baseline measurements;
Willing to get about 50% of your calories every day from potatoes, as described above, for at least four weeks, and;
Willing to share your data with us.
As usual, you can sign up to lose weight, lower your blood pressure, get more energy, or see one of the other potential effects. But you can also sign up to help advance the state of medical science. This study will tell us something about nutrition, weight loss, and obesity. If the half-tato diet works for most people, it will give us a practical weight-loss intervention that’s much easier than the 100% potato diet.
And beyond that, running a study like this through volunteers on the internet is a small step towards making science faster, smarter, and more democratic. Imagine a future where every time we’re like, “why is no one doing this?”, every time we’re like, “dietary scientists, what the hell?”, we get together and WE do it, and we get an answer. And if we get a half-answer, we iterate on the design and get closer and closer every time.
That seems like a future worth dreaming of. If you sign up, you get us closer to that future. We hope that this is only the beginning of what will be a century full of community-run scientific trials on the internet. Maybe by 2030, the redditors will have found a way to triple your lifespan. But for now we are doing potato.
Eating this much potato may sound a little daunting, but people who have tried it say that it is much easier than they expected, and delicious to boot. Here’s our suggestion: If you are at all interested in trying the half-tato diet, go ahead and sign up and start collecting your data. Collect your baseline measurements for two weeks, then try the first day or two of half-tato and see how it feels. If you hate it and have to stop, we would still love to have that data.
If at any point you get sick or begin having side-effects, stop the diet immediately. We can still use your data up to that point, and we don’t want anything to happen to you.
We are mostly interested in weight loss effects for people who are overweight (BMI 25+) or obese (BMI 30+), but if you are “normal weight” (BMI 20-25) you can also sign up. The original full-tato diet caused weight loss in people of normal weight, and it would be interesting to see if the same thing happens for the half-tato.
And for everyone, please consult with your doctor before trying this or any other weight loss regimen.
If you were part of the original SMTM Potato Diet Community Trial, or the SMTM Low-Dose Potassium Community Trial, please feel free to sign up for this study as well! We know that most people who were part of the Potato Diet Community Trial have returned to their baseline weight in the last 6 months, so the original results shouldn’t interfere. And it will be very interesting to compare your weight loss on the half-tato diet to your weight loss on the full-tato diet. Since we can make direct within-person comparisons, this will give us a much better sense of if the half-tato diet works half as well (or better; or worse) as the full-tato diet.
Anyways, to sign up:
Fill out this google form, where you give us your basic demographics and contact info. You will assign yourself a subject number, which will keep your data anonymous in the future.
We will clone a version of this google sheet and share the clone with you. This will be your personal spreadsheet for recording your data over the course of the diet.
On the first day, weigh yourself in the morning. If you’re a “morning pooper”, measure yourself “after your first void”; if not, don’t worry about it. We don’t care if you wear pajamas or whatever, just keep it consistent. Note down your weight and the other measures (mood, energy, etc.) on the google sheet.
For the first two weeks, eat as normal and continue to track your weight and other variables to provide the baseline. Then when the two weeks of baseline are complete (clearly marked on the data sheet), start eating about 50% potatoes, and continue with the half-tato diet for however long you signed up for (4 weeks or longer).
We prefer that you try to get around 50% of your calories from potatoes for at least four weeks. But imperfect adherence is ok. If you only get 30% of your calories from potatoes one day, or you have to skip a day entirely, that’s all right. Just note it down on your sheet. We’re interested in how the diet works for normal people at home, with all the complications that entails.
When you reach the end of the diet (whether you’re ending the diet early, reaching the span you signed up for, or going beyond it), send us an email with the subject line “[SUBJECT ID] Half-Tato Diet Complete”. This will give us a sense of how the study is proceeding in general and is your opportunity to tell us all about how the study went for you. Please tell us any information that doesn’t easily fit into the spreadsheet — how you felt, what kind of potatoes you used, how you prepared them, before and after pictures (if you want), advice to other people trying this, etc. There’s a chance that the half-tato approach will work for some people and not for others, and if that happens, we’ll dig into these accounts to see if we can figure out why.
Remember that it is ok to end the study early if you need to, for example if you get sick, or if you decide that 12 weeks or whatever is too long of a commitment. It’s also fine to reach 12 weeks and keep going if you’re having a good time. Just make your intentions clear in the comments on your data sheet and send us an email whenever you decide to finish, we’d love to hear from you.
Assuming we get 20 or so people, we will write up our results and publish them on the blog. We would really like to get a couple hundred people, though, since at that point it becomes possible to do more complex statistical analyses. So if you think this is an interesting idea, please tell your friends!
This post is an interview with some guy, writing under the name Exfatloss, who has been conducting a weight loss self-experiment and recently put out a blog post about the results so far.
Exfatloss has tried a lot of different weight loss techniques, including the potato diet, but nothing seemed to work over the long term. Until now, that is. He has invented a diet he calls “ex150” that has caused a surprising amount of weight loss, and which seems to be quite reliable — at least for him.
This interview is lightly edited for clarity, and to make Exfatloss “sound smart and funny” per his request.
Exfatloss: Hey SMTM, I finally wrote up a summary on my crazy diet experiment, now that I’ve lost just over 43lbs in 5 months. It has a weight graph that I hope you find enlightening.
Feedback from an experimental/author/publication/science/whatever perspective highly appreciated!
SMTM: This is very exciting, and it makes us want to drink some heavy cream right away, yum. Several questions:
ex150
SMTM: For starters let us make sure we understand the ex150 diet as you describe it. It involves:
Eating just one meal per day, of:
~150 g meat, usually as
ground beef chuck (80% lean / 20% fat) or
ribeye steak
~60 g green vegetables, usually as
microwaved frozen vegetables “(okra, spinach, green beans, fajita mix)”
~80 g pasta sauce, usually as
“the sauce is low-everything and mostly water (e.g. most store brand tomato/alfredo pasta sauce)”
I.e. either red or white sauce
As much butter as you want to cook these things in. (“usually about 15g”)
None of these things measured or weighed precisely, i.e. the diet seems quite flexible. “I don’t think the exact number matters much.”
Exfatloss: Initially I just cut a 1lb thing of ground beef into thirds. It’s pretty much exactly 150g that way. I’d say it doesn’t matter much if you do 130g or 170g. That’s what I mean by “exact numbers don’t matter much.” If lack of a kitchen scale is holding you back, don’t worry about it, eyeballing it worked fine for me. Now if you were to eyeball double the amount of meat… I dunno. I’d consider that more “ex300” than “inexact numbers.”
tl;dr, just buy 1lb of meat and cut it into thirds.
SMTM:
Otherwise eating no meals but:
butter and whipped cream, as much as you want, as snacks/desserts
Sometimes with instant coffee powder for flavor or tomato sauce to cut the fat taste
Quite a lot of it, “I go through a lot of cartons of heavy cream, maybe one every 2-4 days.” How big of a carton? 16 oz?
As a result, most calories come from cream.
No-calorie foods like coffee are also ok, including coffee with arbitrary amounts of cream, and including going to Starbucks.
Exfatloss: The heavy cream comes in 32oz. I have 3 of those in my fridge right now. I think it’s about one 32oz carton every other day I go through. I put instant coffee powder in the whipped cream most days for flavor.
SMTM: Also you are currently in the USA right?
Exfatloss: Yes, and have been for this entire weight loss period so far.
SMTM: As we understand the intent behind the design, the butter and whipped cream are there to make it high-fat, the 150 g meat is there to make it a low-but-nonzero protein diet, and the vegetables are there to give some minimum amount of fiber. Does that seem right?
Exfatloss: Vegetables for flavor/texture and minimal fiber, yes.
Pure ground beef tastes like shit. Trust me, I’ve tried it.
Butter/cream are there to provide calories that are not protein/lithium/whatever the factor is. They’re a known-not-fattening source of calories that also happens to cause no bloating and that I deal with super well.
SMTM: Butter and cream are “a known-not-fattening source of calories that also happens to cause no bloating”? Our sense is that most people would assume that butter and cream are fattening and might cause bloating, so the fact that you seem so confident is surprising. Known to whom, how? It’s news to us!
Exfatloss: Well, known to me, at this point 😉 Through trial and error. There are a bunch of people with theories why (low protein, low PUFA, low UFA).. but honestly I have no clue if any of them are right. I just know I lost a bunch of weight eating mostly heavy cream.
I think it’s an important factor of any sustainable diet that you are NOT in a caloric deficit, or it won’t work (Caloric deficit symptoms -> “willpower breakdown” -> quit diet).
SMTM: This also really stands out! It does seem to fit with what we saw on the potato diet. How did you come to this conclusion?
Exfatloss: Decades of experience? Pretty much any time you restrict your intake or increase your expenditure, you can expect to keep it up for 1-3 weeks or maaaybe if you’re really hardcore a bit longer, and then it stops working and you lose “willpower.” That seems like THE ultimate diet experience of everybody who’s ever tried to lose weight. I write about this in my latest post.
Also when people say “deficit” they are super vague and conflate things and that’s why it’s both necessary and impossible to run a deficit to lose weight. Planning on writing about this at one point.
SMTM: What is the pasta sauce there for? You say, “mostly water”, is that also part of the design?
Exfatloss: Flavor and to soak up the fat 🙂 It tastes significantly better with the sauce. Maybe that’s just me. This whole meal is my previous go-to meal for over 3 years, just scaled down. I used to eat 1lb of that stuff per day, now it’s ~170g and I added the cream to make up for the calories.
SMTM: It may not matter, but we’re curious, what method do you use to test whether you’re in ketosis? If you tracked your ketones data it might be interesting to graph or publish it as well.
Exfatloss: Currently using a ketone blood meter (finger prick style). I will say a lot of carnivore peeps are calling my “zero fiber != ketosis” statement BS and I’ve updated that section of the blog post to clarify.
Since ketone blood strips are expensive and annoying I haven’t tracked those in years, since first starting keto 7 years ago. So unfortunately no data to show 😦
Would be cool if CGMs could track more than just blood glucose! I would love to have years worth of ketone levels. Good news is that the next-gen Libre Freestyle CGM will have this! Very excited.
Palatability and Variability
SMTM: In your post you talk a bit about hypotheses, including this one:
Palatability/brain hack: there is a lot of science out there around the brain’s ways of dealing with food, food reward, and metabolism. Stephan Guyenet’s The Hungry Brain is maybe the best summary, I think. I’ll admit I haven’t read the book, but I listened to a few podcasts where he talks about the ideas, and I think the ex150 diet fits his hypothesis. The idea is that hyper-palatable food that is very energy-rich causes us to overeat in terms of energy. The ex150 diet has 1 hyper-palatable meal every day, but it is very small. The remaining calories come from a bland mono-food that’s hard to overeat (heavy cream). Maybe this tricks the brain into not overeating the cream, yet never feeling more than 24h away from a hyper-palatable meal to release lots of dopamine or other happy food reward signals? I think that even if this might not be the main causal factor, it sure helps make the diet sustainable. I’m never more than 24h away from the most delicious meal I could imagine, and I can eat unrestricted amounts of “dessert” (=whipped cream w/ instant coffee powder).
This mostly seems like evidence against the palatability hypothesis to us, though it might be interesting to ask Guyenet what he thinks. But to us it seems like you are eating delicious foods and getting a lot of food reward. If as much heavy cream and butter as you want plus “the most delicious meal I could imagine” counts as “low palatability”, then the term is so meaningless that it should be tossed out.
Exfatloss: I do personally think that “palatability” (and “satiety”) are meaningless the way they’re often used, even by Guyenet. I heard him on a podcast where he basically said (paraphrasing) “Science has found that humans tend to be caused by their brain to overeat foods that have high palatability.” Wait, isn’t that the definition of palatability? Very roundabout way of saying “Food that tastes good tastes good.” 😀
SMTM: Yeah that has always seemed kind of circular to us.
Exfatloss: I’ve @mentioned Guyenet on Twitter, but he didn’t reply (maybe cause I’m a nobody lol). Maybe I’ll ask him again when I have street cred lol. I do think he’s a good representative/explainer of “The Science” on this because he’s got a good grasp of various ideas out there and has been in full-contact debates with Taubes etc. and was able to hold his own. I respect him. I sometimes feel like citizen-scientism is bordering on anti-science and someone knee-deep in science like him is able to check that tendency. That said, in a fight, my money is on Taubes.
SMTM: We like Guyenet and he’s interacted with us a tiny bit, maybe we can help get his attention. We understand that he’s reluctant to engage with weird randos on the internet but we’d be curious to see what he thinks of this.
Exfatloss: Regarding the dichotomy here: I think the meat/vegetables/sauce meal has near infinite palatability, I’ve literally eaten a pound of this before scaling it down for ex150. So if this diet was “eat as many of these tiny meals a day as you want” I’d eat 15 of them. But I can only have 1. The cream/butter on the other hand has extremely low “palatability” in the sense that it’s very hard to overeat.
How do you know you’ve had too much cream? You’ll fricking know. It comes from one second to the next, where the thought of another sip almost makes you gag. Total on-off switch for me, whereas I can literally eat carbs until I puke and not be satiated (ask me how I know. College, man!)
So if “palatability” means something like “able to overeat” then cream is not it, because it’s very self-limiting. Potatoes and dry chicken breast are also very self-limiting, but they’re in fact so limiting that I got into a massive deficit, got caloric deficit symptoms, and had to quit the diet (plus all the fiber made me feel bloated and gross).
SMTM: Your results look a little more like the variability hypothesis, though. We interpret this as a version of (or closely related to) the palatability hypothesis, where the problem is not tasty foods per se, but eating a variety of foods that are tasty in different ways. We think this theory is poorly-supported but ex150 is definitely a low-variety diet, mostly consisting of the same 5 or so foods eaten every day, however delicious they might be.
It’s clear that ex150 is a low-variety diet, close to a mono diet. But it also seems like variety or mono-ness aren’t the active ingredients here because you did other low-variety and/or mono diets and they didn’t work for you at all. If low-variety or mono diets worked for you, then you would have lost weight on the other low-variety/mono diets you tried — on the carnivore diet, on the “eating only at In’n’out burger” diet, and on the potato diet.
Exfatloss: Yea I do think there’s something to “variety -> overeating.” I do think mono-foods “work” in being self-limiting. My hypothesis here is basically that ex150 manages to hit the goldilocks zone – 1 hyper-palatable meal per day and the rest is a self-limiting mono-food, but it’s not so mono that you get into a massive deficit that makes the diet unsustainable (like potatoes did for me).
On my first week of Potato I was doing only boiled potatoes sans everything, and I couldn’t get down more than 600kcal per day. I’d force myself to go to the fridge, grab a boiled potato, take a bite. It’s not even that the bit tasted bad – but after 1 bite, I was almost gagging. I just couldn’t take a second bite.
So clearly too self-limiting to be sustainable. 200ml of heavy cream has almost 700kcal just on its own and you don’t have to boil it, doesn’t come with all the bloating fiber, digests super easily. Plus you can put instant coffee in it 🙂
SMTM: This isn’t our sense of how the potato diet works in general, since it seems like the tato makes you LESS INTERESTED in other foods.
This seems especially clear in people who have tried half-tato diets. They let themselves eat other foods, but eating a big chunk of potatoes on a regular basis seems to lower your appetite for everything else. For example see M’s experience on the half-tato diet. He says, “maybe two or three weeks in, for the first time in a really long time, I did not have the urge to finish off leftover food at dinner.” Or Joey No Floors Freshwater, who said, “The difference is now I get full and stop eating. I leave food on the plate, which is new for me. I leave texmex on the plate y’all. Its wild.” So the potato diet doesn’t seem to work on just the self-limiting aspects of potatoes because people are less interested in eating other foods too.
That might be one more reason to do a larger half-tato diet study, to see if this generalizes.
Exfatloss: Hm, that sure wasn’t my experience. For me, it was just an inefficient fast plus the worst bloat in years.
I only did full-tater, maybe half-tater would’ve worked better for me? Not sure why it would work so awesome for some and so badly for me.
One theory I have for that is the goldilocks satiety idea. If you eat a mono food and it’s not satiating enough, you’ll overeat and gain weight. If it’s too satiating, you won’t be able to eat enough to meet energy expenditure and you’ll begin getting caloric deprivation symptoms and will eventually land in caloric bankruptcy (see my post).
Not sure why exactly potatoes don’t hit goldilocks zone for me but do for others. Maybe I have a higher energy expenditure or do worse on potatoes?
Re-reading the section of those people who had potato-success, I do think there’s something to “fix satiety.” Maybe the common thread is that these diets somehow fix satiety in people whose satiety signals are broken.
Of course that just moves the question to “how did the satiety signals break and what fixes them?”
SMTM: To us this looks like evidence against both palatability and variability in your case, and some evidence against them in general, especially if it turns out that ex150 works for other people.
Exfatloss: As those hypotheses are commonly understood, yea. But maybe the Goldilocks Palatability thing? 🤷
I.e. it’s not that “lowest palatability/variety” is optimal, but “modest palatability/variety?”
SMTM: Some other theoretical explanations do come to mind. You’re probably eating close to zero calories from seed oils, so while we don’t find seed oils to be a very plausible theory of obesity, we want to at least note that this result is very consistent with that theory.
Exfatloss: Yea, I’ve actually kind of added that as a new hypothesis. I found this insane s/saturatedfat subreddit after posting my article. People there were like “Duh, of COURSE you would lose tons of fat by eating saturated fat!” There’s this guy Fire in a Bottle (twitter/youtube) who has this whole theory how modern meat (even beef) is full of TCCD (I forget what it stands for but it’s BAD cause CHEMICALS) and PUFAs etc. and that’s what’s making us fat.
I will say I did Paleo for 3+ years before Keto, and Keto for 7 years before this, so it’s not like I was chugging seed oils. But I was eating TONS of US commercial grown beef. So if it’s in that..
It would be cool to design experiments to kind of disentangle the various hypotheses, although I’m not sure exactly how. I suppose a month of 2lbs/day of grass-fed beef? 🤷 Maybe ask the gurus who recommend those theories to design an experiment? They’d know.
SMTM: We also notice that “lots of pure fat” does sound kind of like the Shangri-La Diet, so there might be some connection there. A chemical engineer we work with has repeatedly emphasized that while lithium probably accumulates in many foods, it shouldn’t end up in oils because it’s not fat-soluble. Maybe this is connected to why high-fat diets sometimes work? This isn’t limited to lithium, it’s just generally a note that if obesity is caused by a contaminant, there’s some reason to think that the contaminant doesn’t accumulate in fats.
Exfatloss: Interesting, yea. I remember reading about Shangri La years ago. It does seem very similar. Question is why, I guess: is it “appetite suppression” and what does that even mean – ensuring energy balance is met or some psychological thing?
Have you sent a bunch of meat/milk/cream/potatoes to the lithium lab yet? That would shine some light on it, I imagine.
SMTM: We’re working on it! 😉
Potato Diet
SMTM: The fact that you didn’t lose any weight on the potato diet and “HATED how bland it was” seems really interesting, especially given that most people on the potato diet said they loved it and many talked about how delicious they found the potatoes, even after 30 days. And for the most part, obese participants had the most success on the potato diet, so it’s interesting that you found it boring.
It kind of suggests there might be at least two kinds of obesity, one that responds to the potato diet and one that responds to ex150. If something like that were the case, it would be pretty easy to demonstrate experimentally.
Exfatloss: I’ve long suspected that obesity is a “slightly complicated problem.” My analogy is a broken down car.
You drive by a car broken down by the side of the road.
You say: “Have you tried putting gas in the tank?”
“Yes, still doesn’t drive.” says the guy
“I’m pretty sure putting gas in cars works, my friend broke down once and he put gas in the tank and then it worked again.”
“Doesn’t work for me,” says the guy in the car.
“I think you’re just not putting enough gas in the tank,” say you.
That’s basically the state of our discourse on obesity, when even much simpler things like cars can break down for a handful of reasons. Maybe spark plugs. Flat tire. Crankshaft. Hell, I’ve had a cylinder blow up on me because the timing belt skipped a beat and one of the cylinders fired out of order.
If there were 4 causes of obesity and 4 different diets to fix them, we would currently conclude that there is no solution and we don’t know and nothing works better than anything else, because we insist on averaging everything out.
On average, putting gas in broken down cars’ tanks doesn’t work. But sometimes it does. When lack of gas is the problem.
SMTM: Yes! We’ve been working on a post about this. People spend a lot of time saying obesity is a disease when clearly it is a symptom that can be caused by all kinds of things. So while there could be just one epidemic, there could equally be several.
There could even be several epidemics for just one reason. If you roll a bunch of cars over a cliff, many of them will break when they hit the bottom and won’t be able to start. But they might all end up broken in different ways, even if the ultimate cause is “was rolled off of a cliff”.
Exfatloss: Yea “disease” has always seemed wrong to me. I get that people want to take the moral stigma out of it, but “disease” sounds like your immune system will clear it out after 2 weeks or it’s a viral infection or something.
If anything, I’d call it a “condition.”
SMTM: Your experience actually seems like some evidence against the contamination hypothesis and in favor of some kind of deficiency hypothesis. Let’s say that obesity is caused by a deficiency in either X or Y. Potatoes contain X and heavy cream contains Y. If you are X-deficient but have good Y levels, then the potato diet will cure your obesity but cream will taste gross because your body is trying to avoid overloading on Y. If you are Y-deficient but have good X levels, then ex150 will cure your obesity but potatoes will taste gross because your body is trying to avoid overloading on X.
Exfatloss: I don’t know if I agree, it could easily be consistent with contamination. Maybe potatoes and fats are both very low in contaminants, but some people do super well on fiber and starch whereas others do better on fat. I’m sure people with dairy intolerance will hate my diet, but I used to chug a quart of milk for breakfast as a kid and I can dairy all day. Others apparently love potatoes all day. Personally I do best on “close to zero but not quite zero” fiber.
I think the “feels good on X/Y diet” and “contamination” theories can exist side by side and explain this.
SMTM: Would you be at all interested in running an ex150 community trial, maybe recruiting specifically from people who also found the potato diet bland/difficult? You could start by just getting a couple of other people to try it as case studies, since there’s a rather blurry line between “2-3 case studies” and “community trial of 10-20 people”. If the effect is as strong for other people as it is for you, you wouldn’t need a very big sample size to produce convincing results.
Exfatloss: Yea, definitely. In fact I’m trying to recruit some of my friends 🙂 One insisted on switching to the diet at the same time as doing CrossFit for the first time, because apparently isolating variables is for losers…
If you pointed a couple people my way I’d be happy to set up some kind of study. People can contact me on twitter or the blog, or can email me at hello@exfatloss.com
SMTM: Absolutely! People will see it in the blog post and we’ll share about it on twitter, we’ll encourage people to email you there.
Exfatloss: Sounds good!
If it’s just a handful of people I think I’d be more comfortable managing it. I’m not sure I’d be up for hundreds of people like you had on Potato because I’ve never done that type of thing before. That seems to require infrastructure.
SMTM: Yes, and it’s good to start with more case studies before scaling it up to dozens of people. Better to make sure it generalizes and we can re-create it so we don’t waste everyone’s time.
Exfatloss: Yea for sure. Maybe I’m just somehow a crazy sat fat outlier who can’t deal with potatoes 🙂
Boundary Conditions
SMTM: You mention,
For example, could you make the diet work eating only at common fast food restaurants? Using only prepared deli meats? What about cheese? Is it really just about the amount of protein, or does it matter what kind of protein? Eggs?
Does the diet even need to be ketogenic? What happens when you reach a healthy weight, can you back off the diet? Do you cycle it? Is there a maintenance version?
These seem like the most important questions to us. If you switched to 150g eggs + different vegetables + as much olive oil as you want, would it persist? What about other formulations?
What if you stick with the original formulation but slowly add rice until you are no longer in ketosis? You wouldn’t necessarily need to go out of ketosis if you could show a correlation between the rate of weight loss and your ketone levels (though obviously dropping out of ketosis without it affecting the weight loss would be most convincing).
Exfatloss: I’m actually currently on day 5 of ex150deli, which substitutes supermarket deli meat cuts (salami, turkey breast, roast beef..) for the ground beef. I kept the vegetables/sauce the same for science’s sake and let me tell you, they do NOT go well together with sliced deli meats lol. [SMTM note: since finished with success, see here]
Agreed that this would be awesome. It seems there’s gotta be a whole lot of alpha out there in fat loss, and we’re probably nowhere near the efficient frontier. So we should explore the boundaries. What do we actually have to give up to be successful? Why give up more.
SMTM: We also noticed that you say,
What piqued my interest though was that the super-low-protein carnivore diet, while it still kicked me out of ketosis, made me rapidly lose weight, about 10lbs in the 12 days until I ended the experiment early (because I was out of ketosis already, proving the hypothesis).
This story suggests that such a thing is possible.
Exfatloss: See my 2/17/2023 update on the post on the fiber/ketosis issue, several carnivore people claim I’m wrong on this and I concede it’s possible.
SMTM: It also seems like this could just be a cream-maximalist diet, right? Do you know about how many calories you’re getting per day, and how many of them are from cream? Seems like it’s over 50% right?
Exfatloss: 50%? Ha. It’s 85% before I add the cream in the coffee 🙂 I have a macro estimation in this blog post.
SMTM: There would be a darkly comic element if obesity was cured by high doses of cream, but it would also make some sense. What is the one treatment for obesity that no one would ever think to try? “Drink as much heavy cream as you can stand, every day.” We’re confident that most people would never try this (ok maybe some people would on keto), so it would make sense if everyone missed it…
Exfatloss: Ha you should see the r/saturatedfat people.. as I understand it, the claim is literally that eating saturated fat will increase your metabolic rate by insane levels and thus create a massive bottom-up deficit.
SMTM: In general, is there a principle of “if you’ve been looking for a long time and tried everything you can think of and nothing works, the real answer must be something that seems really stupid”? Reminds us of Sherlock Holmes’ “when you have eliminated the impossible, whatever remains, however improbable, must be the truth.”
Exfatloss: I will confess to having read a lot of Sherlock Holmes.
SMTM: Us too!
Superstition and ABA
SMTM: Generally we are concerned about the “superstition” element of self-experiments. If spontaneous remission is a possibility, and you try a long enough list of things, you might randomly spontaneously remiss and it would look like the thing you were trying at the time is the cause:
Let’s say that Mary develops chronic fatigue syndrome (CFS). She is proactive and wants to solve the problem, so she comes up with a plan of 26 different treatments, which we’ll call A, B, C, D, and so on. Maybe A is “cut out dairy”, B is “walk 20 minutes every day”, etc. but the specific plans don’t really matter. She starts implementing each plan for two weeks, first plan A, then plan B, etc.
But the cadmium is slowly being cleared from her system by natural means at the same time as she works her way through the 26 treatments. What happens is this: Mary reaches treatment L (“take omega-3 supplements”) just as the cadmium in her system drops below critical levels, and Mary is immediately “cured”.
Since her symptoms stop almost immediately after starting treatment L, Mary assumes that the omega-3 supplements are what cured her, and continues taking them indefinitely.
This is basically what happened when you moved back to the US from China.
So we REALLY like how you took a 14-day break from ex150 right in the middle of your self-experiment. If you were randomly losing weight for some other reason, then you should have kept on losing weight during this break. The fact that you gained weight back, and that it closely corresponds to the break (modulo pemmican), seems like strong evidence that, as you say, “it wasn’t some other random factor in the environment causing the fat loss.”
We see the same thing in a smaller way in two other short breaks you take.
This looks a lot like an ABA design, or since you have four experimental periods, an ABABABAB design.
Usually we would say that ABA-type designs don’t really provide enough evidence to draw clear conclusions. Even with an ABABABAB, that’s still only a sample size of 8 intervals. But in this case, the effect seems so distinct and so the effect size so huge we’re not sure. What do you think?
Exfatloss: Definitely agreed that it doesn’t prove “what did it” or even anything.
But it disproved a bunch of really likely environmental factors like a) city (walkability? air quality?) b) weather/temperature c) drinking water d) cancer haha.
I think it’s a really easy and pretty good thing to do. If you really know why the light turns on and off, you shouldn’t be afraid to hit the switch a couple of times and see if it works as you thought. That’s kind of the least you can do. If you never turn the light off because you’re afraid it won’t come on again, does that really sound like you understand why it’s on in the first place?
Set Point
SMTM: In your Q&A section you give this exchange:
Q: You’re just going for walks now.
A: No, fat loss started 2 months before that and the rate hasn’t changed. But yes, I feel so energetic many days on this diet that I started spontaneously wanting to go outside and take long walks. One time I even fell into a light jog! In my experience this is a result of effective fat loss, having “unlocked” the key to utilizing my body fat, not the cause of fat loss. 1,150kcal/day (0.3lb of body fat) would be a long walk to take every day.
This is interesting to us because it suggests your set point is falling faster than your weight is. Compare this experience to how you mentioned that running as exercise just makes you hungrier to compensate for the extra calories you burn. So that suggests that something about this diet changes your set point very quickly, which seems interesting.
Exfatloss: I kind of believe that we’re thinking about “set points” slightly wrong. This is inspired by my understanding of circadian rhythms.
All humans have a “genetically predetermined circadian rhythm.” But it’s not that somewhere in your genes it says “8am EST” or anything. The best analogy I’ve read is that what’s basically encoded is a spring weight. Imagine your circadian clock is powered by a spring, and sunshine pushes down on the spring. Different people have different spring weights. Most people’s weight is such that if they get even a little bit of sunlight during a normal day, their spring is fully compressed and ready to go again. Some people have a very stiff spring, and they need enormous amounts of sun exposure to get it compressed during one day.
If you move even normal people to the north pole or something, even their springs will never compress (in the constant dark) or always be overcompressed (in the constant sunlight). If you put people in a cave, the spring mechanism just completely stops working.
My point being, what if it’s not that we have a “set point” that says “He shall be 210lbs” but instead, the rate of how “calories in” is split up? Similar to the P ratio. This ratio could be influenced by various factors like macro composition, chemicals in the food, sunlight, sleep quality.. some people have a ratio in such a way that pretty much no matter what they do, the calories they eat will be sent to the furnace. Other people will have ratios that require them to take super extreme measures to prevent gaining fat. If you put healthy people on a PUFA-sugar-juice diet and sleep deprive them and feed them tons of lithium, even they will probably gain fat.
For example, maybe I’m just an insulin hyper-responder, and what normal people consider “normal” amounts of carbs or protein makes me obese. And suddenly my ratio has swung from one end of the scale (->90% of calories in go to fat) to the other (->90% calories are sent to the furnace and you will fricking go for a walk every day even in freezing rain just cause you can’t stand sitting still).
Maybe it’s not that this ratio per se is encoded. Point is it could easily be encoded as a flow rate, not as an absolute “set point == 210lbs” value. And you just reach a different equilibrium with your current environment depending on the flow rate/spring rate. Just as you’ll reach a certain “waking set point” in the winter, and a different one in the summer, depending on factors like sun exposure.
SMTM: This is a good argument, but the difference between circadian rhythm and metabolic set point is that while the body doesn’t have access to a direct measure of time (it uses external cues like sunlight), it does have access to internal metrics about obesity. This seems to involve signals like leptin, literal compressive weight on your bones, blood sugar, stomach fullness, etc.
Exfatloss: But those metrics aren’t an objective, comprehensive obesity score like body fat %. It’s different chemical signals. Those signaling pathways can be disrupted or conflated or confused.
In a computer analogy, there isn’t one program in your body that can read the total fat storage value and set the heater/AC accordingly. It’s a bunch of distributed systems sending each other messages in various ways. If something goes wrong with some of the packages, unspecified behavior can set in. The TCP port could be blocked. The pipe could be broken. Your packages might get misrouted by a rogue/broken system in the middle. There might be backpressure in the signaling system that changes the frequency/density of the packages arriving.
Might also be personal. For example, my sensitivity to physical stomach fullness is practically zero. I always assumed that people meant this figuratively. I have literally eaten until I was painfully full and felt zero satiation. I wanted to continue, I just couldn’t, from the pain.
Pro-tip: never go to an all-you-can eat pizza place.
The potato diet wasn’t quite that bad, but it was also really bad.
On the other hand, the whipped cream satiety hits me like a cement truck. One bite fine, second bite good, third bite NO WAY I’M FULL. (These are the last 3 bites, not the first 3 bites, of a whipped heavy cream meal.)
SMTM: How about the hairpin turns when you try going off the diet and back on again? Whatever this diet is doing, your weight seems really responsive! That’s weird, but it kind of matches the results on the potato diet, which also seems to cause abrupt changes in most people’s weight.
Exfatloss: A lot of the hairpin is water retention. I’ve seen as much as +6lbs the day (!) after ending my second ex150 month, and -4lbs after the first day of pemmican.
One confounder with potato for me is actually that I was pretty low-fiber before it, because I hate fiber. So I went from a low-fiber to an all-fiber diet, which would jack up my water retention. So given the above numbers, even if I lost 6lbs on potato, the very first day of increased water retention could negate it.
Btw these water retention effects are plateau effects, which was my criticism of your recent potassium study. But if you do switchbacks, it creates these insane hairpin turns.
I basically disregard the first, really steep weight loss when I go on the diet. Usually it takes at most 5 days to finish the plateau effect and for the “real” fat loss rate to show.
Metascience
SMTM: We agree that the real point is the meta-framework of experiments, so we’re really interested to hear more about these other things you tried that you list near the beginning of your post (cold showers, no online news, carnivore diet), what can you tell us about those?
To emphasize: the real point is the meta-framework of experiments. Formulate a hypothesis, design a 30-day experiment, test it. I’ve probably done dozens of these over the years.
Here are some examples from the last few years:
30 days of cold showers
90 days of no online news (I thought stress might contribute)
90 days of the carnivore diet
30 days of eating only at In’n’out burger
Doing Starting Strength, a beginner’s powerlifting program
Doing Simple & Sinister, a kettlebell training program
30 days of drinking only distilled water (including for coffee)
Eating only pemmican, a raw meat paste invented by Native Americans
Exfatloss: Ha I’m planning to eventually write a longer post where I detail some of these experiences. [SMTM note: this post has since been written, see here]
Some highlights: cold showers did nothing. No online news (suggested by a friend) showed me that I consume news as entertainment, but that I just replace it with movies/video games when I stop consuming the news. Carnivore diet was super bland and boring (YES steak gets boring!) and I didn’t lose any weight. In’n’out was the best, I love that place! My first low-protein trial was entirely done at In’n’out, as was the low-fiber one. Starting Strength made me fatter. Pemmican was even more unpalatable than potatoes lol, I chewed every bite for 2 minutes. It just tastes like I imagine cow manure tastes like. Ugh. Sad because I really wanted to like it.
SMTM: A lot of science criticism seems really facile. In particular, it seems like lots of people don’t understand measurement, they think that measuring things is both objective and easy. It makes us wonder if these people have just never tried to measure anything for themselves so they don’t realize what is involved (compare: Reality has a surprising amount of detail). So our sense is that trying a lot of failed diets is part of what has made you a careful experimenter. What was your experience of this? Does this have practical implications for training, or for people who want to get into research / self-experimentation? You seem very virtuous to us. What advice would you give to other people who wanted to do self-experiments like this?
Exfatloss: Hm, not sure. I just like experimenting and trying new stuff, I’d probably keep doing it even if I reach my goal weight. Just for fun.
Most experiments have no effect or almost no effect. “It makes no difference” seems the default result.
SMTM: Good insight.
Exfatloss: All diet experiments that somehow rely on you eating less or burning more energy seem to fail very quickly because caloric deficit symptoms set in. I call these diets “inefficient fasts” because you could’ve saved yourself 15 days and gotten too hungry to continue by water fasting, instead of getting too hungry to continue on day 18 of your diet.
Even when you’re really, absolutely, positively sure you identified The Thing, you can be completely wrong. This was my experience after “knowing” through experiment that keto is what made me lose 100lbs. I had literally already written the book 🙂
Lesson in humility. One of the reasons why I’m couching my terms more this time and mostly going off of my experience so far. One of my broader claims this time was the zero-fiber/ketosis thing, and apparently I’ve already been proven wrong. Zing!
I am very critical of Science(tm) as an institution, especially in fat loss and nutrition. It seems that a lot of scientists hide behind mouse models and sophisticated studies so they don’t have to face the fact that nobody actually fricking knows how to lose weight.
Saw a meta-analysis recently that concluded “all diets work well to reduce weight.” Really? Must’ve not heard about this obesity epidemic.
That’s why I love the citizen scientist stuff so much. I think modern ethics boards literally make it illegal to do meaningful diet research.
SMTM: Preach!
Exfatloss: Try getting a 85% calories from heavy cream study approved.
Final Thoughts
SMTM: Finally, can we publish your responses to these questions (and responses to any followup questions) as an interview on our blog? If that sounds good, we’ll produce a version of this email thread, edited for clarity and flow, and go over it with you before publishing.
Exfatloss: Yea, that sounds great! Please edit it to make me sound smart and funny lol. Exfatloss is good as a name. You can mention that I’m a guy just for clarity, as that can make a big difference in fat loss/metabolism I think.
SMTM: How should our readers reach you if they have questions? Comments on your Substack? Email?
And thank you for inspiring me to try this shit again, I had given up until I read the Lithium series.
4 jeans sizes is already so worth it. You wouldn’t believe the quality of life difference 40lbs makes. Literally wouldn’t believe it. If I never lost another pound, this would still be a huge success.
Most diets are not nearly this effective. The potato diet seems unusually good at causing weight loss. Could it also be unusually good at maintaining weight loss after people stop eating potatoes?
There are some signs that it might. The potato diet was partially inspired by several case studies, and the case studies suggest that the weight you lose on the potato diet stays off, at least for a while. We focus on three case studies in particular:
Chris Voigt lost 21 lbs on a 60-day potato diet back in 2010. It’s not clear if he gained that back or not — this article from 2018 doesn’t mention it either way. He looks pretty lean in photos, but then again, he was pretty lean to begin with.
Andrew Taylor did an all-potato diet for a full year and lost 117 pounds. This was 7 years ago and he seems to have kept most of the weight off since then. Of course, Andrew did the potato diet for a full year, and was pretty strict about it, so his experience might not generalize to people who did the potato diet for only four weeks.
And of course, Penn Jillette, of Penn & Teller fame, lost over 100 lbs on a diet that started with a two-week period of nothing but potatoes. This was way back in 2014, and despite only doing potatoes for two weeks, he seems to have kept most of the weight off as well.
In these cases, especially the last two, it seems like the potatoes have somehow reset these people’s lipostats, the system in the brain that keeps you at a particular weight. Their lipostats used to be really high for some reason; then they did a potato diet; now their lipostat seems to be defending a set point about 100 pounds lower.
The good news is that we now have a larger sample to work with, so maybe we can finally get at some of these questions. It has been about 6 months since the close of the SMTM Potato Diet Community Trial, and this is the 6-month followup analysis.
Method
We sent an email on January 1st, 2023 to everyone who had participated in the Potato Diet Community Trial, asking people to fill out a short 6-month followup survey.
In this survey, we asked them for:
Their potato diet participant ID, so we could connect their responses to the original results
We gave people approximately two weeks to fill out this survey. Then on January 14th, we downloaded the data.
There were a total of 53 responses by this point.
The majority (51 of them) were people who we analyzed in the original trial.
Of these, 32 were people who made it the full 4 weeks in the original trial. This happens to be exactly half of the 64 who originally made it to 4 weeks.
When we did the original analysis of the potato diet, there were still a few people who were in the middle of their four weeks of the diet, so we didn’t analyze their data at the time. Two of those people responded to this followup survey. They were not in the original analysis, but they did both complete four weeks, so we are going to include them in this analysis.
So in total we have 34 people who completed 4 weeks on the potato diet and then reported back at the 6-month check-in. This is our main group of interest.
One person (participant 24235303) reported being 136.4 lbs at the 6-month followup, but he was 222.2 lbs at the end of the potato diet, so this would mean he had lost 85.8 more pounds over the intervening 6 months. Because this seems unlikely, and because his comment was, “my weight drifted back up over a few months”, we assumed this was a typo. We followed up by email and he confirmed that he meant to type 236.4 lbs, so we corrected this number for the analysis.
Participant 63746180 reported being pregnant (congratulations!) so we are excluding her data from this analysis as her weight may not be representative.
Participant 65402765 mentioned that they “started semaglutide around the same time as potato diet”. Semaglutide (sold under brand names like Ozempic and Wegovy) is an anti-obesity medication, so while this participant did lose 13.4 lbs in this 6-month period, we also excluded their data from the analysis.
Because of these exclusions, the final sample size for the rest of the post is 32 people.
All new data and materials are available on the OSF.
Results
On average, people gained back most of the weight they lost. This subset of people lost an average of 11.1 pounds from Day 1 to Day 28, and from Day 28 to the 6-month followup there was on average 10.3 lbs of weight re-gain.
People are on average down 0.71 lbs from their starting weight on Day 1 of the original study, but this is not significantly different from zero. On average, people are pretty much back to baseline.
In aggregate, it looks like a pretty strict reversion to the mean — people lost a little more than 10 lbs over 4 weeks on the potato diet, and gained back almost all of that weight over the next 6 months.
This is still a relatively successful weight loss intervention — you do a diet for just one month and it takes about 6 months to gain back the weight you lost. This suggests that if you were willing to do a week or two of potato diet every 3 months, you could probably keep your weight down indefinitely.
But just looking at the averages conceals a pretty drastic spread. When we plot the results, we can see that 6 months later, most people are back near baseline, maybe slightly under baseline on average. But some people are down almost 20 or 30 lbs, some people are up more than 10 lbs, and one person is up almost 30 lbs!
That central cluster is what gives us the average. Most people gained weight in the 6 months after the end of the potato diet, and ended up on average slightly under baseline.
Four people kept losing weight (one of them isn’t obvious in the plot, they were near the top of the pack at Day 28 and are near the bottom of the pack at the 6-month check-in), and three of those people ended up down more than 15 lbs over 6 months. Those three are the clear outliers below the main group at 6 months.
Five people gained back way more (10+ lbs) than they lost. These are the five dots way above the main group at 6 months, including that one dot that is up at nearly 30+ lbs.
It may be hopeless to try to figure out what is different about these eight or so people, given the small sample size, but let’s try.
Outliers
Since there are so few outliers, let’s start by looking at them one-by-one.
Participants 99065049, 82575860, 66459072, 10157137, and 77742719 all ended up more than 10 lbs heavier than their baseline on Day 1 of the potato diet.
Participant 99065049 is the outlier, having lost 6.3 lbs in the trial and gained back 34.5 lbs since then, for a total gain of 28.2 lbs since Day 1. We wanted to double-check this result, so we reached out to this participant over email and he confirmed that it was not a typo.
This group didn’t say much about themselves in the comments. Only two of them left responses at all. Participant 10157137 said:
After the potato diet my cholesterol had improved, but post diet it shot back up again 😔
Participant 82575860 said:
Would appreciate a follow up post on the best potato-based recipes that were sent in
Participants 20943794, 19289471, and 35182564 lost the most weight. All of them lost more than 5 lbs on the potato diet, and kept losing weight after that. Their total weight loss by 6 months was 19.3 lbs, 23.2 lbs, and 28.7 lbs, respectively.
Participant 35182564, who lost the most weight, said:
Weight is incredibly stable, although I eat normal, just like before the potato diet. This was a great success.
Participant 20943794 offered the most detail, saying:
After the potato diet ended, I started a pretty traditional CICO diet using the Noom app. Roughly speaking, I lost 10 lbs on the potato diet, and another 10 on the CICO diet.
Before the potato diet, I tried calorie counting and various high-protein, low carbohydrate diets, and have never had this kind of sustained success. (E.g., I’ve lost 20 – 30 lbs before, but I didn’t maintain that weight for more than a month or so).
In addition to the potato diet, there are some other confounding factors:
1. Whey protein has figured heavily in all my previous diet regimens, but I obviously didn’t take any during the potato diet, and even after it ended, I drastically cut back how much protein powder I consumed (because of the lithium hypothesis)
2. Because of covid and it’s after-effects, I eat out far less frequently than I ever did before. Since January 2020, I’ve eaten restaurant food (whether dine-in or take-out) only about a dozen times (most of that was on a business trip in October 2022). Before that, I’d say I ate restaurant food on average once per week
Moving on from the comments, we can see if any of the other variables offer us insight.
The potato diet included people from all weight brackets, and maybe that’s what is causing this confusing pattern. For example, maybe all the outliers who gained weight over baseline are people who were slightly underweight when they started the potato diet, and who have gone up to a healthy weight 6 months later. Maybe all the outliers who lost extra weight were very heavy people whose lipostats were easier to reset.
But when we plot the results by BMI bracket, we see basically no pattern:
Another possibility is that this reflects whether or not people kept eating potatoes after the trial was over. After all, you can eat potatoes without being on the potato diet, and many people do. Perhaps the people who kept losing weight are the people who stuck with the potato diet, even if only casually, for the long-term. And maybe the people who gained extra weight grew disgusted with potatoes and stopped eating them entirely.
The good news is that we collected this very variable. But again, when we plot it, we see no such thing:
The person who lost the most weight ate “way less potatoes than [they] used to”. The people who gained the most weight are all in the middle. No clear pattern here.
That said, if you plot this variable WITHOUT the outliers, you see basically what we would expect — people who kept eating more potatoes are mostly still below their original weight, people who didn’t change their potato intake are back to baseline, and people who are eating way less potato than they used to are slightly above baseline.
Finally, here’s a breakdown by country. Most participants are Americans but take a look:
American Holidays
Most of our participants are Americans, and in the span between the start of July and the end of December there’s a major American holiday period that famously involves a lot of eating: the period from Thanksgiving to New Year’s.
Obligatory Rockwell
As a result, at the 6-month followup our participants were asked to weigh themselves just after a period of especially serious and far-ranging eating. Quite possibly they were being asked to weigh themselves at the heaviest they would be all year.
So in some ways, the particular timing of how this all worked out is a rather conservative test of the potato diet. The weight loss from the potato diet does not seem to survive the holiday period, but it might last somewhat better across any other 6-month span.
A number of our participants commented on this as well. Let’s take a look:
(57875769) For about the first month after doing the trial my weight continued to trend downward although much more slowly. Then it slowly started creeping back up. Most of the weight came back during the holidays (it’s a little unfortunate that the six month follow up landed right after Thanksgiving, Christmas, and New Years!).
(89852176) After ending the full potato diet about 10 pounds below my typical weight, I returned rather quickly to my baseline (spurred on by eating at family vacation) and stayed there for several months. I ended the year roughly 5 pounds higher than baseline, all of which were gained in the second half of December with “typical” USA holiday (over-)eating.
(63187175) Gained about 5 pounds over the holidays, I was closer to 235 at the beginning of December
(50913144) I stayed at the lower weight for a few months, it only started creeping back up at pre-potato-trial rates in the last 6 weeks or so. I am probably going to do another round of potato intervention, i don’t like the potassium and it doesn’t seem to help me much.
(15106191) This measurement is being taken just after the holidays. This is higher than my pre-potato weight but I don’t blame the potatoes, its normal for me to weigh about this much more in January than I did in June
If we expand our plot using her data, we can see that some people were down quite a bit more in late October / early November than they were at our 6-month check in.
Some people, however, mentioned gaining the weight back more quickly:
(25547207) It took about a two months to gain all my weight back. My strength training had to cease 2 weeks in for the remainder of the study, and my large lifts dropped about 10%. It took about 1 month to recover my original strength and I was making gains before fully recovering my weight.
(72706884) I gained back all the weight within 3 months
Conclusions
The potato diet causes very consistent weight loss. But whatever makes the potato diet work doesn’t permanently change your set point. The first thing we see is that most people gain back the weight they lost over time, and on average, it looks like they are back close to their original weight about six months later.
Unless it did permanently change the lipostat for those three people for some reason. Because the second thing we see is striking individual differences. A small number of people ended up weighing 10+ pounds more or less than they did when they signed up for the trial, and it’s not clear why.
Maybe they had unusual life circumstances that happened to make them lose or gain more weight over those six months. Maybe they are just random outliers. Or maybe they are more/less sensitive to potatoes for some reason, more sensitive to whatever the active ingredients are. Something something cybernetic attractor states.
There’s a chance that the outliers who kept losing weight are just noise, or that they would have lost weight anyways for some other reason and just happened to sign up for the potato diet at the right time. But there’s also the chance that there is something different about these four participants. If we could figure out what that difference is, maybe we could create lasting weight loss for everyone. For example, are these four people the only four vegans in this sample? We didn’t think to ask this question, but if they were, that would be very interesting. A potential extension then would be to do a much larger potato diet study (1000+ participants) and keep special track of the people who kept losing weight after the trial ended.
Still, the potato diet is a relatively successful weight loss intervention, since one month of dieting gives consistent results that tend to stick around for about six months. And given the significant individual differences we see, it seems that for some people the effects are more lasting. While we don’t know why this happens for some people and not for others, there’s a small chance that you’ll end up being one of these outliers, and you’ll keep losing weight after the potato diet is over.
We will probably still do the 1-year followup to keep up with these outlier participants, and to see if overall average weight remains below the original baseline or not. But in general, it seems like the conclusion is that 4 weeks of potato diet will make you lose weight, and six months later most people will be back around baseline.
That’s not much weight loss, but it’s also not a very big supplemental dose of potassium, and the weight loss is significantly different from zero. People who took higher doses of potassium lost more weight, as did people who weighed more to begin with.
But what about past that first span of 29 days? Some people kept going with the protocol, taking potassium up to 60 days. Today we report their data.
30+ Days Results
We took a snapshot of all participants’ data on January 5, 2023. This was more than a month after we collected the data from the first 29 days, so everyone had the opportunity to reach 60 days by this point if they wanted to. This new snapshot is available on the OSF.
All the sample sizes in this case are too small to be statistically significant with the potential effect sizes involved, so we don’t report any statistical tests in this post.
We cleaned these raw data and are going to look at the data from Day 1 on the protocol to Day 60. Some people may have kept going past Day 60, but we aren’t going to look at that right now.
Here are the overall trajectories for the people who reported at least one day’s weight beyond day 29. The vertical red line indicates day 29, so all data points beyond that are past the span of the original trial.
Overall the trend seems to continue. One person ended up down more than 15 lbs, but that’s not at all representative.
People lost weight on average, but we already knew that. In this case we are most interested in whether they kept losing weight past the official end of the trial, so here are those same data zeroed from their weight on Day 29:
We see that in this span, people also lost weight on average, though the average weight loss was not very large. The average weight change past day 29 is negative, -0.37 lbs with all data.
See that spike up to more than 10 lbs? As you may have guessed, those are the days immediately following Thanksgiving. The participant reported that this was their “heaviest weight in 9 years”, but as you can see they lost all that excess weight very quickly.
These plots can make it hard to see what has happened for each individual, so let’s now break things down and just show their last reported weights, again relative to their weight on Day 29.
Here’s a plot of each person’s last reported day, and their reported weight change as of that day.
You can see that there are roughly two groups — most people either made it just a few days past Day 29, or made it up to very close to day 60.
We can take a special look at that second group, people who made it to Day 60 or nearly did so. Here’s everyone who made it past 50 days, broken out by just the landmark measurements — their weight on Day 1, on Day 29 at the official end of the trial, and on the last day they reported.
And here are those same data as a table:
On average, these people lost a decent bit (2.7 lbs) in the first span of the trial, and less in the second span (1.0 lbs). But this obscures a lot of individual stories that are more extreme in one way or another, like participant 42293886, who gained 3 lbs in the first leg but lost 4.6 lbs going to day 60, for a total change of 1.6 lbs. (This participant told us, “Not going to go off potassium any time soon I suspect. Making a little effort to lose weight, and it’s showing a small amount of success.”)
Also notable is that the only two people who had net weight gain by 50+ days are people who had already gained weight by day 29.
Summary
Probably the people who kept going past Day 29 were the ones who were most motivated, or who had seen the best results up to that point, so there may be some selection bias.
While none of this is super compelling, people who kept going did on average keep losing weight. They didn’t stick right where they were on Day 29 and they didn’t regress back to the mean. It’s a small amount more evidence in favor of the idea that supplemental potassium might cause weight loss, another tiny pebble on the scale.
In a practical sense, we still recommend that anyone who wants to lose weight should go on the potato or half-tato diet. It’s much more reliable, and more delicious.


 which form a peak in the middle and fall off at the sides. The yellow line is highest around the peak, the green one is lower, blue even lower and purple the lowest.")