
I.
One of the mysterious aspects of obesity is that it is correlated with altitude. People tend to be leaner at high altitudes and fatter near sea level. Colorado is the highest-altitude US state and also the leanest, with an obesity rate of only 22%. In contrast, low-altitude Louisiana has an obesity rate of about 36%. This is pretty well documented in the literature, and isn’t just limited to the United States. We see the same thing in countries around the world, from Spain to Tibet.
A popular explanation for this phenomenon is the idea that hypoxia, or lack of oxygen, leads to weight loss. The story goes that because the atmosphere is thinner at higher altitudes, the body gets less oxygen, and this ends up making people leaner.
One paper claims to offer final evidence in favor of this theory: Hypobaric Hypoxia Causes Body Weight Reduction in Obese Subjects by Lippl, Neubauer, Schipfer, Lichter, Tufman, Otto, & Fischer in 2010. Actually, the webpage says 2012, but the PDF and all other sources say 2010, so whatever.
This paper isn’t terribly famous, but as of this writing it’s been cited 171 times, and it was covered by WIRED magazine in 2010, so let’s take a look.
This study focused on twenty middle-aged obese German men (mean age 55.7, mean BMI 33.7), all of whom normally lived at a low altitude — 571 ± 29 meters above sea level. Participants were first given a medical exam in Munich, Germany (530 meters above sea level) to establish baseline values for all measures. A week later, all twenty of the obese German men, as well as (presumably) the researchers, traveled to “the air‐conditioned Environmental Research Station Schneefernerhaus (UFS, Zugspitze, Germany)”, a former hotel in the Bavarian Alps (2,650 meters above sea level). The hotel/research station “was effortlessly reached by cogwheel train and cable car during the afternoon of day 6.”
Patients stayed in the Schneefernerhaus research station for a week, where they “ate and drank without restriction, as they would have at home.” Exercise was “restricted to slow walks throughout the station: more vigorous activity was not permitted.” They note that there was slightly less activity at the research station than there was at low altitudes, “probably due to the limited walking space in the high‐altitude research station.” Sounds cozy.
During this week-long period at high altitude, the researchers continued collecting measurements of the participants’ health. After the week was through, everyone returned to Munich (530 meters above sea level). At this point the researchers waited four weeks (it’s not clear why) before conducting the final health examinations, at which point the study concluded. We’re not sure what to say about this study design, except that it’s clear the film adaptation should be directed by Wes Anderson.

II.
While this design is amusing, the results are uninspiring.
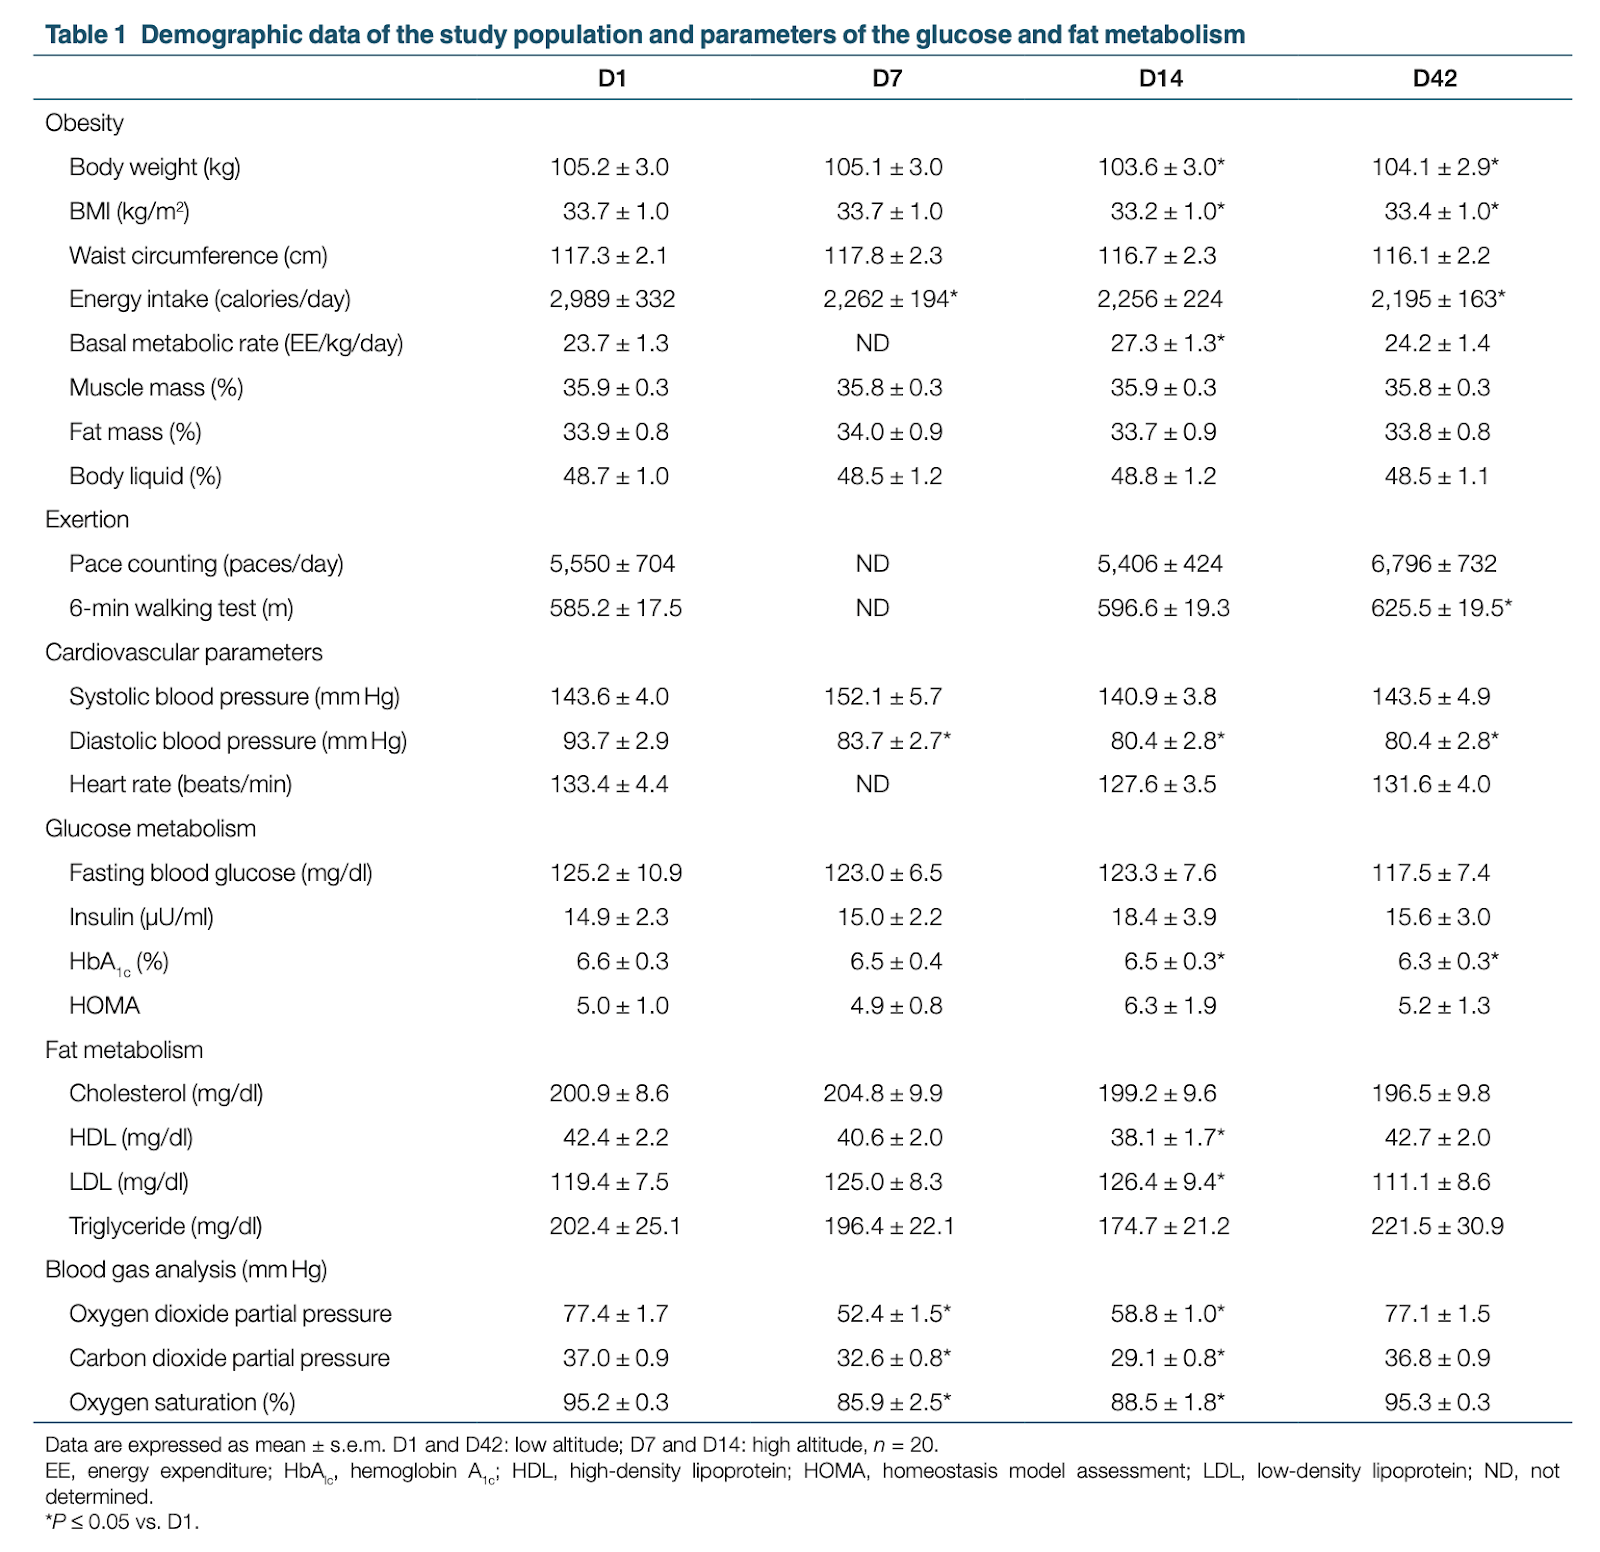
To begin with, the weight loss was minimal. During the week they spent at 2,650 meters, patients lost an average of 3 pounds (1.5 kg). They were an average of 232 lbs (105.1 kg) to begin with, so this is only about 1% of their body weight. Going from 232 lbs (105.1 kg) to 229 lbs (103.6 kg) doesn’t seem clinically relevant, or even all that noticeable. The authors, surprisingly, agree: “the absolute amount of weight loss was so small.”
More importantly, we’re not convinced that this tiny weight loss result is real, because the paper suffers from serious multiple comparison problems. Also known as p-hacking or “questionable research practices”, multiple comparisons are a problem because they can make it very likely to get a false positive. If you run one statistical test, there’s a small chance you will get a false positive, but as you run more tests, false positives get more and more likely. If you run enough tests, you are virtually guaranteed to get a false positive, or many false positives. If you try running many different tests, or try running the same test many different ways, and only report the best one, it’s possible to make pure noise look like a strong finding.
We see evidence of multiple comparisons in the paper. They collect a lot of measures and run a lot of tests. The authors report eight measures of obesity alone, as well many other measures of health.
The week the patients spent at 2,650 meters — Day 7 to Day 14 — is clearly the interval of interest here, but they mostly report comparisons of Day 1 to the other days, and they tend to report all three pairs (D1 to D7, D1 to D14, and D1 to D42), which makes for three times the number of comparisons. It’s also confusing that there are no measures for D21, D28, and D35. Did they not collect data those days, or just not report it? We think they just didn’t collect data, but it’s not clear.
The authors also use a very unusual form of statistical analysis — for each test, first they conducted a nonparametric Friedmann procedure. Then, if that showed a significant rank difference, they did a Wilcoxon signed‐rank method test. It’s pretty strange to run one test conditional on another like this, especially for such a simple comparison. It’s also not clear what role the Friedmann procedure is playing in this analysis. Presumably they are referring to the Friedman test (we assume they don’t mean this procedure for biodiesel analysis) and this is a simple typo, but it’s not clear why they want to rank the means. In addition, the Wilcoxon signed‐rank test seems like a slightly strange choice. The more standard analysis here would be the humble paired t-test.
Even if this really were best practice, there’s no way to know that they didn’t start by running paired t-tests, throwing those results out when they found that they were only trending in the right direction. And in fact, we noticed that if we compare body weight at D7 to D14 using a paired t-test, we find a p-value of .0506, instead of the p < .001 they report when comparing D1 to D14 with a Wilcoxon test. We think that this is the more appropriate analysis, and as you can see, it’s not statistically significant.
Regardless, the whole analysis is called into question by the number of tests they ran. By our count they conducted at least 74 tests in this paper, which is a form of p-hacking and makes the results very hard to interpret. It’s also possible that they conducted even more tests that weren’t reported in the paper. This isn’t really their fault — p-hacking wasn’t described until 2011 (and the term itself wasn’t invented until a few years later), so like most people they were almost certainly unfamiliar with issues of multiple comparisons when they did their analysis. While we don’t accuse the authors of acting in bad faith, we do think this seriously undermines our ability to interpret their results. When we ran the single test that we think was most appropriate, we found that it was not significant.
And of course, the sample size was only 20 people, though perhaps there wasn’t room for many more people in the research station. On one hand this is pretty standard for intensive studies like this, but it reduces the statistical power.
III.
The authors claim to show that hypoxia causes weight loss, but this is overstating their case. They report that people brought to 2,650 meters lost a small amount of weight and had lower blood oxygen saturation [1], but we think the former result is noise and the latter result is unsurprising. Obviously if you bring people to 2,650 meters they will have lower blood oxygen, and there’s no evidence linking that to the reported weight loss.
Even more concerning is the fact that there’s no control group, which means that this study isn’t even an experiment. Without a control group, there can be no random assignment, and with no random assignment, a study isn’t an experiment. As a result, the strong causal claim the authors draw from their results is pretty unsubstantiated.
There isn’t an obvious fix for this problem. A control group that stayed in Munich wouldn’t be appropriate, because oxygen is confounded with everything else about altitude. If there were a difference between the Munich group and the Schneefernerhaus group, there would be no way to tell if that was due to the amount of oxygen or any of the other thousand differences between the two locations. A better approach would be to bring a control group to the same altitude, and give that control group extra oxygen, though that might introduce its own confounds — for example, the supplemental-oxygen group would all be wearing masks and carrying canisters. I guess the best way to do this would be to bring both groups to the Alps, give both of them canisters and masks, but put real oxygen in the canisters for one group and placebo oxygen (nitrogen?) in the canisters for the other groups.
We’re sympathetic to inferring causal relationships from correlational data, but the authors don’t report a correlation between blood oxygen saturation and weight loss, even though that would be the relevant test given the data that they have. Probably they don’t report it because it’s not significant. They do report, “We could not find a significant correlation between oxygen saturation or oxygen partial pressure, and either ghrelin or leptin.” These are tests that we might expect to be significant if hypoxia caused weight loss — which suggests that it does not.
Unfortunately, the authors report no evidence for their mechanism and probably don’t have an effect to explain in the first place. This is too bad — the study asks an interesting question, and the design looks good at first. It’s only on reflection that you see that there are serious problems.
Thanks to Nick Brown for reading a draft of this post.
[1] One thing that Nick Brown noticed when he read the first draft of this post is that the oxygen saturation percentages reported for D7 and D14 seem to be dangerously low. We’ve all become more familiar with oxygen saturation measures because of COVID, so you may already know that a normal range is 95-100%. Guidelines generally suggest that levels below 90% are dangerous, and should be cause to seek medical attention, so it’s a little surprising that the average for these 20 men was in the mid-80’s during their week at high altitude. We found this confusing so we looked into it, and it turns out that this is probably not a issue. Not only are lower oxygen saturation levels normal at higher altitudes, the levels can apparently be very low by sea-level standards without becoming dangerous. For example, in this study of residents of El Alto in Bolivia (an elevation of 4018 m), the mean oxygen saturation percentages were in the range of 85-88%. So while this is definitely striking, it’s probably not anything to worry about.

I’m a high altitude climber. Altitude definitely suppresses hunger. For me, the effect isn’t significant until I get to about 15,000 feet and steadily gets worse as I go higher than that. Around 24,000 feet, it’s hard to eat more than 200 or 300 calories at a time. Like, you might be able to eat one candy bar or half a dehydrated meal.
Low pulse ox. at altitude is normal. I’ve been at 80% for weeks at a time, living at 18,000 feet. I’ve measured my saturation around 65%, camping at 22,000 feet. I’ve never tried a reading higher than that.
All these thresholds vary from person to person, depending on fitness and other factors. I’d imagine that all these effects are more pronounced in the average obese person. They might feel some of the same effects when visiting 8,600 feet in the alps. I doubt it’s big issue for people living long term in Denver, though, at only 5,000 feet.
Anecdotally, I know a ton of people in Colorado that moved there for hiking in the mountains. And I know a number who took up hiking because Colorado’s mountains are great. So you’d have to factor out selection bias and activity levels before really concluding anything about obesity in Colorado.
I also know a few obese people that moved to Colorado for jobs and didn’t adjust diet and exercise. None of them got any thinner. And people I know that moved from Colorado to lower elevations generally have stayed the same weight as well.
LikeLike