
[PART I – MYSTERIES]
[PART II – CURRENT THEORIES OF OBESITY ARE INADEQUATE]
[PART III – ENVIRONMENTAL CONTAMINANTS]
[INTERLUDE A – CICO KILLER, QU’EST-CE QUE C’EST?]
[PART IV – CRITERIA]
[PART V – LIVESTOCK ANTIBIOTICS]
[INTERLUDE B – THE NUTRIENT SLUDGE DIET]
Per- and polyfluoroalkyl substances (PFAS) are a group of synthetic chemicals that are used to make a wide variety of everyday products, including food packaging, carpets, rugs, upholstered furniture, nonstick cookware, water-repellant outdoor gear like tents and jackets, firefighting foams, ski wax, clothing, and cleaning products. Many are also used in industrial, aerospace, construction, automotive, and electronic applications.
The PFAS family is enormous, containing over 5,000 different compounds. But only a couple of these compounds are well-studied. The rest remain rather mysterious. Perfluorooctanoic acid (PFOA) and perfluorooctane sulfonate (PFOS) are two of the original PFAS, are especially widespread in the environment, and we tend to have the most information on them.
PFAS are practically indestructible. They repel oil and water and are heat-resistant, which is part of why they have so many applications, but these features also ensure that they degrade very slowly in the environment, if they degrade at all. Short-chain PFAS have half-lives of 1-2 years, but longer-chain equivalents like PFOS are stable enough that we haven’t been able to determine their half-life. As a result, they stick around in the environment for a very long time, and soon make their way into soil and groundwater. The full picture is complicated, but there’s evidence that they accumulate in rivers as they flow towards the ocean.
They not only stick around for a long time in the environment, they stick around for a long time in your body. If you’re reading this, there’s probably PFAS in your blood. A CDC report from 2015 found PFAS in the blood of 97% of Americans, and a 2019 NRDC report found that the half-life of PFAS in the human body is on the order of years. They estimate 2.3 – 3.8 years for PFOA, 5.4 years for PFOS, 8.5 years for PFHxS, and 2.5 – 4.3 years for PFNA. “PFOS, PFNA, PFHxS, and related PFAS,” they write, “are known to bioaccumulate in the bodies of people of all ages, even before birth.”
How do these chemicals get into our bodies? Every route imaginable. “People are concurrently exposed to dozens of PFAS chemicals daily,” the NRDC report explains, “through their drinking water, food, air, indoor dust, carpets, furniture, personal care products, and clothing. As a result, PFAS are now present throughout our environment and in the bodies of virtually all Americans.” Looking at one map of PFAS measurements, we see that PFAS has been detected at military sites in 49 states (no measurements given for Hawaii) and in drinking water in Utqiagvik, Alaska, the northernmost incorporated place in the United States. Unfortunately, only a few states have done comprehensive testing.
This exposure isn’t just limited to humans. There’s bioaccumulation in the remote lichen-caribou-wolf food chain in northern Canada, and in part of the Arctic Ocean, with animals higher in the food chain showing higher concentrations of PFAS in their bodies.
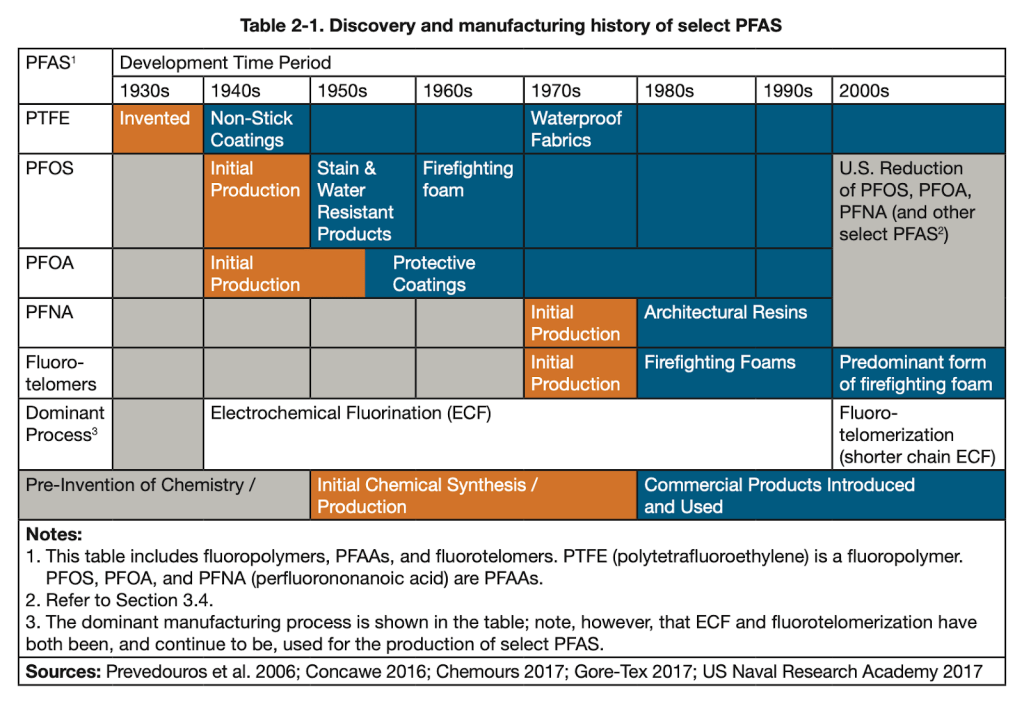
If we look at the history of PFAS (below), we see that the timeline for PFAS introduction lines up pretty well with the timeline for the obesity epidemic. PFAS were invented in the 1930s, 40s, and 50s, and were rolled out over the next couple decades. This gave them some time to build up in people’s bodies and in the environment. By the 1980’s many types, including some new compounds, were in circulation. In the 2000s, some of them began to be banned, but many of them are still widely used. After all, there are more than 5,000 of them, so it’s hard to keep track.
A study from the Red Cross worked with blood donor data and measured serum levels in samples from 2000-2001 and plasma levels in samples from 2006, 2010, and 2015. In general, they found serious declines in serum levels of the PFAS they examined. For example, the average PFOS concentrations went from 35.1 ng/mL to 4.3 ng/mL, a decline of 88%, and PFNA concentrations went from 0.6 ng/mL to 0.4 ng/mL, a decline of 33%. The National Health and Nutrition Examination Survey (NHANES) data from the same period matches these trends pretty closely.
These studies show that levels of PFAS in American blood are declining, but they’re only looking at the PFAS that we already know are declining. Many of these PFAS are no longer in production. PFOS and PFOA, among other compounds, were phased out in the US between 2006 and 2015. But new compounds with similar structures were brought in to replace them. The companies that make these compounds say that the new PFAS are safer, but unsurprisingly this is very controversial.
Notably absent from both the Red Cross and the NHANES data is PTFE. This is somewhat surprising given that it is the original PFAS, and it is still in production. Granted, many sources claim that PTFE is extremely inert — including the paper Polytetrafluoroethylene Ingestion as a Way to Increase Food Volume and Hence Satiety Without Increasing Calorie Content, which goes on to argue that we should replace 25% of our food with Teflon (PTFE) powder so that we feel more full while eating fewer calories, which they say will help us make “the leap into the realm of zero calorie foods.” Personally, we’d stick to celery.
Maybe PTFE really is that inert. (We find it a little hard to believe. “Word was that the compounds were inert,” said one scientist of his choice not to study PFOA and PFOS in 2000.) Either way, the safety research on these substances is pretty ridiculous. Usually the exposure period is very short and the dose is extremely high. This may be relevant to exposure for industrial workers, but it doesn’t tell us much about the long-term effects of relatively low doses on the rest of us.

In one study they gave monkeys various amounts of PFOS for 182 days, and found “significant adverse effects” only in the 0.75 mg/kg/day dose group. Effects in this group included “mortality in 2 of 6 male monkeys, decreased body weights, increased liver weights, lowered serum total cholesterol, lowered triiodothyronine concentrations (without evidence of hypothyroidism), and lowered estradiol levels.”
This is interesting, but there are some problems. First of all, 0.75 mg/kg/day is an insanely high dose. Serum concentrations in the 0.15 mg/kg/day dosage group were 82,600 ng/mL for males and 66,800 ng/mL for females. The comparable rate in human blood samples is about 20-30 ng/mL. Second, 182 days is not a very long or realistic exposure period for most humans.
At these extremely high, short-term doses, weight loss is actually a relatively common side effect. This is the opposite of obesity, of course, but it does suggest that PFAS can affect body weight.
The type of exposure might make the difference. Mice have very different developmental trajectories than we do, but mice exposed to low doses of PFOA in-utero had higher body weights at low exposures, while mice exposed to high doses as adults lost weight. ”Exposure during adulthood was not associated with later-life body weight effects,” they write, “whereas low-dose developmental exposure led to greater weight in adulthood and increased serum leptin and insulin levels. Animals exposed to higher doses of PFOA, on the other hand, had decreased weight.” Note also that while half-life of PFOA in humans is about 3.8 years, in mice it is around 18 days.
A study of 665 pregnant Danish women, recruited in 1988–1989 with the researchers following up with the children 20 years later, found that in-utero PFOA exposure was related to greater BMI and waist circumference in female but not in male children. There are some issues with multiple comparisons — they measured more than one PFAS and they subdivided by gender, both of which are degrees of freedom — but the effects are strong enough to survive reasonable corrections for multiple comparisons, and are consistent with the results from mice, so let’s mark this one down as “suggestive”.
Other studies have found small but reliable effects where male babies, but not female babies, were a few grams lighter at birth when their mothers had higher serum PFOS levels. Again this study suffers from multiple comparison issues, but again it is relatively consistent with animal research.
It doesn’t seem likely that the effect in humans can be exclusively prenatal, however, because we know that people often gain weight when they move to a more obese country. There’s pretty good evidence that different environments are exposing you to different levels of contamination, and that it makes a difference.
Your drinking water is not the only way to be exposed. Many foods are contaminated with PFAS. PFAS are also found in clothes, carpets, and upholstered furniture, so you could be exposed even if there’s no PFAS in your diet. If your favorite beer or pasta sauce is bottled at a factory where the water source is high in PFAS, you’ll be exposed even if your own drinking water is uncontaminated. And since most major brands are bottled in more than one location, there wouldn’t even be a reliable by-brand effect—you’d need to track it by factory.
A better way to do this comparison might be between countries. In fact, we see what appears to be a pattern: There’s more PFAS in tapwater in the United States than there is in tapwater in China, and there’s more PFAS in tapwater in China than there is in tapwater in Japan. The pattern isn’t perfect, however: There’s even more PFAS in tapwater in France than in the United States, and more in Japan than in Thailand.
Occupational Hazard
One place you might get a lot of reliable exposure, though, is at your job. Looking at the uses of PFAS, we see that they’re common in:
- Firefighting foams
- Cookware and food packaging
- Paints and varnishes
- Cleaning products
- Automotive applications, including components in the engine, fuel systems, and brake systems, as well as automotive interiors like stain-resistant carpets and seats
- Healthcare applications, both in medical devices like pacemakers and in medical garments, drapes, and curtains
This suggests that if PFAS are linked to obesity, we should expect to see disproportionate levels of obesity in:
- Firefighters
- Food workers (especially cooks)
- Construction workers
- Professional cleaners
- Auto mechanics and others who work closely with vehicles
- Medical professionals who work closely with medical devices and garments / drapes / curtains, though probably not medical desk jobs.
In the 2000’s, the Washington State Department of Labor and Industries surveyed more than 37,000 workers. They found that on average 24.6% of their sample was obese, which we can use as our baseline. The rate of obesity in “protective services”, which includes police, firefighters and emergency responders, was 33.3%. Among cleaning and building services workers, 29.5% were obese. Truck drivers were the most obese group of all, at 38.6%, and mechanics were #5 at 28.9% obese. Health service workers (excluding doctors and nurses) were 28.8% obese. On the other hand, only 20.1% of food preparation workers were obese, and only 19.9% of construction workers:

We can also look at national data from US workers in general. Looking at data between 2004 and 2011, we see that the average rate of obesity went from 23.5% in 2004 to 27.6% in 2011, and was 26.2% on average in that range. Unfortunately they break these numbers down by race, so we have to look at each race separately.
When we look at the occupations of interest for non-hispanic white adults, we see that 30.4% of firefighters, 32.0% of cooks, 35.1% of food processing workers, 29.7% of building cleaning workers (and for some reason a whopping 37.3% of cleaning supervisors), 39.2% of motor vehicle operators, 27.7% of vehicle mechanics, 36.3% of people working in healthcare support, and 29.8% of health technicians were obese (see Table 2 below). Some construction occupations were slightly less obese than average (“Construction trades workers” at 25.0%), and some were much more obese than average (“Helpers, construction trades” and “Other construction and related workers” at 31.2% and 38.6%, respectively).

For non-hispanic white adults, individuals with the highest age-adjusted prevalence of obesity were motor vehicle operators, “other construction and related workers”, law enforcement workers, and nursing, psychiatric, and home health aides. It’s not clear why law enforcement workers are in there, but it’s pretty remarkable that the PFAS explanation can predict the other three.
Patterns are largely similar for the other racial groups. Among black female workers, the occupations with the highest age-adjusted prevalence of obesity were health care support (49.2%), transportation and material moving (46.6%), protective service (45.8%), personal care and service (45.9%), community and social services (44.7%), food preparation and serving (44.1%), and health care practitioners and technicians (40.2%). Some of these don’t seem to fit — why is “transportation and material moving” in there? — until you realize that “transportation and material moving” includes air traffic controllers, pilots, and other transportation workers, and you remember that PFAS-based firefighting foams are still widely used at airports.
Overall when we look at professions we would expect to have high exposure to PFAS, we see that workers in those professions are more obese than average. When you look at the professions with the highest rates of obesity, we see that most of them are related to mechanical work, healthcare, cleaning, or firefighting, all professions that have disproportionate exposure to PFAS on the job.
If on-the-job PFAS exposure really does lead to obesity, we should also see higher levels of obesity in people who work with PFAS directly. This is exactly what we find.
In 1993 and 1995, 3M conducted an internal study of PFOA exposure in a group of production workers. In the mid 90s, about 20-25% of the population was obese. About 40% of these workers were obese in 1993, and about 48% were obese in 1995.
Looking closer, they found that the group with the highest amount of PFOA contamination also had the highest BMI. The authors even take a moment to draw attention to this point. “It should be noted,” they say, “that all five employees in 1995 with serum PFOA levels [30,000 ng/mL] had BMIs 28.” BMI was slightly correlated with PFOA contamination (r = .11), though with only 111 people, the correlation was not significant. The authors seem unaware of the implications of this, however, and treat BMI as a confounder for other analyses.
Of course, this was not a normal group. They had insanely high serum PFOA levels, up to 115,000 ng/mL, though a few people had no PFAS in their blood.
A later 3M paper published in 2003 looked at serum levels of both PFOA and PFOS. In these data, there is a very clear relationship between PFOS levels and BMI. Men in the lowest quartile of PFOS exposure (mean 270 ng/mL) have an average BMI of 25.8, while men in the highest quartile of PFOS exposure (mean 2,690 ng/mL) have an average BMI of 27.2. The effect is even more pronounced for female employees. Women in the lowest quartile of PFOS exposure (mean 70 ng/mL) have an average BMI of 22.8, while women in the highest quartile of PFOS exposure (mean 1,510 ng/mL) have an average BMI of 28.7. They don’t report a correlation, but they do say, “the fourth quartile had significantly higher mean values than the first quartile for … BMI.”
Dose-Dependent Relationships in the Population
This is somewhat confusing, however, because PFAS serum levels aren’t all that correlated with BMI in the general population. This paper on 2003-2004 NHANES data (a large sample intended to be nationally representative) looked at PFAS concentrations in a final sample of 640 (down from 2,368) people and found only weak evidence of PFAS having an influence on body weight. The strongest relationship they report is for PFOS levels among male participants over 60. Some analyses even report significant negative relationships between PFAS levels and BMI.
Both of these approaches, however, are looking at coefficients in regression equations where they have included many covariates. While in principle this technique can be used to adjust for confounders, in practice the resulting estimates are difficult to interpret. Without a strong model of the causal structure involved, it’s hard to know what the relationship between two variables means when it is adjusted by 20 other variables. Including covariates in an unprincipled way can even cause estimates of an effect to reverse direction. It’s not a panacea, and in fact it can be misleading.
The NHANES data is publicly available, so we decided to check for ourselves. Sure enough, PFOS levels aren’t correlated with BMI — though they are correlated with both weight and height individually.
There’s an issue with looking at simple correlations of PFAS levels, of course, because they are highly correlated with one another. If you have high serum levels of one PFAS, you probably also have high serum levels of another. This means that they may interact or mask one another’s effects in potentially complicated ways.
For example, let’s look at PFHS. A quick correlation shows that serum PFHS levels are negatively correlated with BMI. As far as we can tell, no one has ever reported this, but it’s right there in the NHANES data. In the 2003-2004 data, the correlation is r = -0.090, p < .000045. This effect is small but extremely robust — people exposed to more PFHS are slightly skinnier.
PFHS levels are also correlated with PFOS (r = .29). When we look at the relationship between PFOS and BMI controlling for PFHS, the relationship between PFOS and BMI becomes significant, p = .035, showing that people with higher PFOS exposure are more obese.
“Just wait a minute,” you say, “that’s barely significant at all! How many relationships did you look at before you found that, anyways? This sounds a lot like p-hacking.” We had the same concern, which is why it’s great that we have NHANES data from many different years that we can use to validate this result.
We can go backwards to the 1999-2000 data (we can’t use the 2001-2002 data because the PFAS data for that year are missing ID numbers) where we find a significant relationship between PFOS and BMI controlling for PFHS, p = .008. We can also go forwards to the 2005-2006 data, where we also find a significant relationship between PFOS and BMI controlling for PFHS, p = .007. It seems to be pretty reliable. Now, it’s not a huge effect — the influence of PFOS is only about a half a point of BMI for the average person. But that’s a lot more than nothing.
This isn’t the place for doing a full analysis of the relationships between the different PFAS and how they interact. The NHANES doesn’t even measure every kind of PFAS, so we wouldn’t be able to find every relationship. The point is simply that the influence on BMI may be more complicated than a simple association, and this is proof that at least one of these surprises is hiding in publicly available data.
Why is the association so apparent in the 3M workers but harder to detect in the general population? It has to do with the issues with dose-dependence that we identified earlier. The 3M studies are the sort of samples where we should be able to detect a dose-dependent effect, if one exists. The NHANES data, however, is the sort of sample where it should be hard to detect a dose-dependent effect, even if a strong one exists.
The NHANES data is intended to be nationally representative, while the 3M data is looking at a few hundred people at a couple factories. As a result, the 3M sample is much less diverse than the NHANES sample, which means that it will also be less genetically diverse. Since there’s less genetic diversity, genetics will have less influence on people’s body weight. With less variation coming from people’s genetics, there’s less noise for the dose-dependent signal to be lost in, and it will be easier to detect. Looking at other populations that are not so diverse — like pregnant Danish women between 1996 and 2002 or newborn deliveries at the Johns Hopkins Hospital in Baltimore, MD — we also find that PFAS levels are related to BMI. Similarly, a study from 2021 found a dose-dependent relationship between PFOA — but not PFOS — and obesity in children living in the United States.
The 3M studies are also looking at a much wider range of dosages than are observed in the general population. In the 2003-2004 NHANES data, the range of serum PFOA levels was 0.1 to 77 ng/mL, and the range of serum PFOS levels was 0.3 to 435 ng/mL. In comparison, the range of serum PFOA levels in the 1993 and 1995 3M study was 0 to 115,000 ng/mL. In the 2003 3M study, the range of serum PFOA levels was 10 to 12,700 ng/mL and the range of serum PFOS levels was 40 to 10,060 ng/mL. Analyzing a less restricted range makes the correlation more accurate, which is what we see in the 3M data.
In the 3M sample, some employees participated in both 1993 and in 1995, and PFOA serum levels were highly correlated among the 68 employees who appeared in both samples (r = .91, p = 0.0001). This means that levels of exposure were extremely consistent across the two years between the measurements, possibly because people’s level of exposure was related to the role they had in the production process. Normally, it takes a while for someone’s weight to catch up to the dose of a compound that influences their weight — this is clear from studies of weight gain in people taking antipsychotics. But the 3M employees had serum levels that had been stable for many years. We should expect this to reduce noise and make the correlation between serum levels and BMI more accurate, and it appears to have done just that.
Other Considerations
Dose-dependence is strong evidence that PFAS are a contributor to the obesity epidemic. Is there any other lingering evidence?
One paper looking at a dieting study from 2003 found that PFAS concentration wasn’t related to body weight or weight lost during dieting. However, it was associated with greater weight regain over the months following the diet. People with the highest plasma concentrations of PFAS gained back about 8.8 lbs (4 kg), while people with the lowest plasma concentrations of PFAS gained back only about 4.4 lbs (2 kg). This is a relatively minor but statistically significant difference, and it is consistent with an account where these compounds don’t simply cause weight gain, but damage the lipostat and lead people to defend a higher body weight.
West Virginia is usually an obesity outlier. It’s the #1 or #2 most obese state (depending on your source), and it’s been one of the most obese states for as long as we’ve been keeping statewide records for this sort of thing. But it’s also high in elevation (19th highest after Washington state and Texas) and pretty far upriver. Most of the neighboring states — Ohio (#11), Pennsylvania (#24), Maryland (#26) and Virginia (#28) — are not nearly so obese.
DuPont built the very first Teflon (PTFE) plant in Parkersburg, West Virginia. By 1948, the plant was manufacturing 2 million pounds of PTFE per year. Some sources claim that they were using PFOA as part of the manufacturing process by 1951. Unfortunately we don’t have obesity data for West Virginia in 1948 or 1951, or the years immediately following. But we can note that many years later, West Virginia was at the center of the first legal action surrounding PFAS.
This kind of legal action has come about because PFAS have been linked to a variety of harmful health effects, including cancer, thyroid hormone disorder, and immune system effects. As a result, governments have begun to regulate and sometimes ban these compounds. New York, Maine, and Washington state have all banned or restricted PFAS in various ways, and in 2021, Vermont and Connecticut both passed legislation to remove PFAS from firefighting foams, food packaging, and other consumer products. There’s even some international regulation — PFOS have been regulated under the international Stockholm Convention since 2009, which was expanded to include PFOA and PFOA-related compounds in 2019. There was also a movie about PFAS bans, starring Mark Ruffalo.
Some people are hopeful that these bans will form a sort of natural experiment that can allow us to see what happens when PFAS are removed from the environment. Unfortunately, we’re less optimistic. First off, these compounds are very durable, so even if we ban them, huge doses will still be in the environment. Second, statewide bans won’t keep these substances from entering the state in food or goods produced elsewhere.
Finally, these bans restrict only a tiny percentage of all PFAS. As a recent report from the European Commission notes, “The ban of widely used long-chain PFAS has led to their substitution with a large number of shorter chain PFAS. Several of these alternatives are now under regulatory scrutiny in the REACH Regulation because of the concern they pose for the environment and for human health.” Efforts to limit exposure to PFAS are a great idea, but the continued use of short-chain PFAS limits the usefulness of bans as natural experiments to determine the role of PFAS in obesity.
[Next Time: SUSPECT NUMBER THREE]

How would would go about getting a PFAS-blood-concentration test for themselves?
LikeLike
Minnesota, land of 10,000 PFAS-polluted lakes, has a decent document on this:
Click to access indbltest.pdf
LikeLiked by 1 person
I tried disabling any extension here and yet I only see a large blank space
LikeLike
thanks!
LikeLike
Well, this makes me very suspicious. I put on 15-20 pounds in the past year or two. I was going to blame Covid-19, but at the same time I started getting into 3D printing, mostly using PTFE filaments. It makes one wonder. . .
LikeLike
Ouch…..seems like a harder problem to get rid of than fat itself
LikeLike
This sequence continues to be excellent – thank yinz for writing it!
That said, I’m starting to have a harder time following along, and I found this post especially difficult. Of course the research is most important, but if I may make two suggestions for improving readability:
1) This post would really benefit from inclusion of more graphs and charts. For example, the paragraph beginning “A later 3M paper …” could be accompanied (or even replaced) by a bar chart of BMI by quartile of PFOS exposure and gender. The same comment goes for many other paragraphs in this post — many of them summarize statistics that could be better presenting as a graph. (Of course, I know yous guys have limited time and energy to allocate to each post and that manually copying data presented in a pdf can be mind-numbing. But still, on the margin more graphs would help a lot.)
2) (This is less important) More section divisions would be helpful, e.g. I was a bit disoriented by the sudden switch to talking about West Virginia. Y’all’s earlier posts were much better about this.
Anyway, keep up the excellent work!
LikeLike
Thank you!
You’re correct on both points. We will see what we can do to add more graphs and charts and more section headings in the upcoming posts, and will come back to this and add them if we get a chance. We appreciate it!
LikeLike
I was surprised you didn’t mention class/income as a possible confounder when looking at obesity rates by profession- would it make sense to include other categories with similar average income but lower expected exposure?
LikeLike
We’ve looked at that and it doesn’t look like class and income are a good alternative explanation, but you’re right, we should have discussed that in the post. We may write an interlude on class / income to cover this and related issues.
LikeLike
I noticed that some proposed artificial blood substitutes appear to use PFCs:
https://www.phlbi.org/divisions/blood-disorders/artificial-blood/
One, Fluosol, even made it to market but was discontinued due to side effects (not sure what, don’t have paper access). Might be worth investigating? Literally replacing your blood with PFCs might be a bit too extreme to show weight gain effects though?
LikeLike
Interesting series. The PFAS entry reminds me of this paper: “Persistent organic pollutants in adipose tissue should be considered in obesity research” https://doi.org/10.1111/obr.12481
Thanks for the posts!
LikeLiked by 1 person
You mention ski wax in the article. Ski techs are known to have heroic blood concentrations of PFAs. Seems like they would be a good population to investigate to validate the altitude/groundwater hypothesis.
https://www.scientificamerican.com/article/ski-wax-chemicals-buildup-blood/
LikeLike
Oh good point. Thanks!
LikeLike
Have you looked into microplastics? It certainly overlaps with what you’re discussing here — many (but not all) microplastics contain PFAs. I was just looking at Kannan and Vimalkumar (Front. Endocrinol., 2021), and if I’m understanding them correctly there are many other types of microplastics that have higher concentrations in the environment than PFAs alone, and as with PFAs their production is increasing in time, they have become pervasive in the environment, they bioaccumulate, and they disrupt the endocrine system. In particular, synthetic fibers released from washing/drying clothes are a huge source of contamination. There’s lots of microplastics in household dust and we are ingesting it all the time (I saw one estimate of 5g/day (!)). Would love to hear your thoughts.
LikeLike
We briefly considered microplastics but didn’t find them immediately all that likely. In particular, a lot of the countries that seem likely to be exposed to more microplastics than average aren’t especially obese. But like you mention, “microplastics” could refer to a wide variety of different contaminants, so the picture could be more complicated than all that. The dust angle is pretty interesting. In particular, if there were exposure to more or different microplastics in automotive interiors, that would match the fact that professions that spend a lot of time in vehicles are especially obese.
Right now lithium and PFAS seem especially promising, so we’re pursuing those, but if we need to go back to the drawing board, microplastics will definitely be on our list!
LikeLike
Are you saying lithium and PFAS are the 2 most likely of the original suspects you mentioned?
LikeLike