
[PART I – MYSTERIES]
[PART II – CURRENT THEORIES OF OBESITY ARE INADEQUATE]
[PART III – ENVIRONMENTAL CONTAMINANTS]
[INTERLUDE A – CICO KILLER, QU’EST-CE QUE C’EST?]
[PART IV – CRITERIA]
[PART V – LIVESTOCK ANTIBIOTICS]
[INTERLUDE B – THE NUTRIENT SLUDGE DIET]
[PART VI – PFAS]
[PART VII – LITHIUM]
[INTERLUDE C – HIGHLIGHTS FROM THE REDDIT COMMENTS]
[INTERLUDE D – GLYPHOSATE (AKA THE ACTIVE INGREDIENT IN ROUNDUP)]
[INTERLUDE E – BAD SEEDS]
[PART VIII – PARADOXICAL REACTIONS]
[PART IX – ANOREXIA IN ANIMALS]
[INTERLUDE F – DEMOGRAPHICS]
Let’s talk about some of the new stuff we’ve learned about lithium.
Lithium Grease
Our first post on lithium mentioned lithium grease, which is used on all kinds of heavy machinery. We found this interesting because professions that work closely with cars, trucks, planes, and trains tend to be more obese than average, and if lithium causes weight gain, lithium grease might be able to explain this pattern.
We knew that lithium grease was a modern invention, but we recently found out that the timeline for lithium greases matches the timeline of the obesity epidemic even better than we realized — it was introduced in the 1940s, but only started seeing serious use in the 1980s. Here’s the story per The Society of Tribologists and Lubrication Engineers:
Greases made with simple lithium soap thickeners first appeared in the 1940s, starting with Clarence Earle’s 1942 patent (U.S. 2,274,675). Users found that these greases resisted water better than greases made with sodium soaps, and they performed better at high temperatures than calcium soap greases did. Lithium soap greases resist shearing, and they exhibit good pumpability properties, although they require the addition of antioxidants. This combination of advantages outweighed the extra manufacturing expense compared with calcium and sodium thickeners, and lithium soap greases (notably lithium 12-hydroxystearate formulations) quickly claimed a large share of the market (9).
Lester McClennan patented the first lithium complex grease in 1947 (U.S. 2,417,428), but lithium complex greases did not become popular commercially until the early 1980s (9). For the past 20-30 years, manufacturers have been shifting away from thickeners based on simple lithium soaps to lithium complex thickeners because of the latter’s better performance at high temperatures, Waynick says.
With this in mind, you can imagine our reaction when we saw an email drop into our inbox with the subject line, “Repeatedly eating lithium grease”. This email turned out to be from reader Emily Conn, sharing the following anecdote about a guy she used to work with:
I used to work in HVAC repair with a guy named A—, and he was sort of famous in our company for eating lithium grease. The reason he did this was so that he could identify the sort of grease that had been used somewhere and then apply the same type. He could even taste differences between brands. We all touched the stuff, which I thought at the time was safe, but he was the only one who ever ate it.
Well, all the other health problems the guys in the company had, he had 10 times over. Not only was he extremely fat, he was also frequently out for medical issues, although I never knew what they were.
Another note for the story – I’ve never seen anyone else care about matching brands of lithium grease, not sure why A— thought it was important. Also, I never validated his claim that he could taste the difference between brands – that was what he said he could do but none of us ever checked.
This is just an anecdote and only a sample size of one, and may not be representative of all cases. Nevertheless, we strongly recommend that you avoid eating lithium grease.
What about the Middle East?
In our first post about lithium, we speculated that many Middle Eastern countries have high rates of obesity because they get a lot of their drinking water from desalination. Desalination removes all trace elements from seawater, but because distilled water is bad for pipes and trace elements are important for your health, the desalinated water is remineralized by blending it with some of the original sea water.

Seawater has more than a bit of lithium in it, and lithium levels in the Persian Gulf are on the high end for seawater. Based on measurements of seawater in the gulf, we calculated that desalinated seawater in the Middle East could end up carrying a pretty big dose of lithium, somewhere in the range of 10-100 ng/mL.
(Also notable is that desalination produces lots of toxic brine, which is itself a problem.)
It’s true that 100 ng/mL is a pretty high level of lithium to find in your drinking water, but it’s not a total outlier — we see lithium levels this high or higher in places like Texas, some Greek Islands, and some parts of Austria. So 100 ng/mL is concerning, but it’s still surprising that Middle Eastern countries ended up so obese when there are other places that get similar doses.
Some Reddit comments recently introduced us to the Pima people of the Gila River Valley, who had very high levels of obesity way before the obesity epidemic started for the rest of the world, as high as 40% obese in 1970. In the course of looking into this, we learned that the Pima were exposed to very high levels of lithium in their food and water quite early on, because “in the Gila River Valley, deep petroleum exploration boreholes were drilled during the early 1900’s through the thick layers of gypsum and salty clay found throughout the valley. Although oil was not found, salt brines are now discharging to the land surface through improperly sealed abandoned boreholes, and the local water quality has been degraded.” Fun!
This led us to the literature on oil-field brines, which tend to contain huge amounts of lithium. How huge? Well first we need some comparisons. In drinking water, a low level of lithium is about 0.5 ng/mL, and high levels are 100 or 200 ng/mL. In some parts of Chile, however, drinking water can have up to 700 ng/mL, and in Argentina, up to 1000 ng/mL. In seawater, lithium concentrations are usually in the range of 100 to 1000 ng/mL. The highest concentrations of all are found in extreme locations like the Dead Sea, with 14,000 ng/mL of lithium, and 24,880 ng/mL in the headwaters of one river in Chile.
All of these are dwarfed by the levels possible in oil-field brines. Here’s a quick review from a USGS paper released in May 2021:
Produced water from oil and gas wells can have extremely high concentrations of lithium (Dresel and Rose, 2010; Blondes et al., 2018). For example, waters from shale gas wells in the U.S. had reported lithium concentrations ranging from 10 to 634,000 [ng/mL] (median 25,000 [ng/mL]) and those from conventional oil and gas wells had concentrations ranging from <10 to 1,730,000 [ng/mL] (median 5000 [ng/mL]) (Blondes et al., 2018). Lithium and associated components of such brines may be accidentally or intentionally released to the surface or groundwater in certain locations (Tasker et al., 2018; McDevitt et al., 2019).
Another point of comparison is this report from 2019 on recovering lithium from “oil and gas produced water”. This includes a number of interesting observations, including that Smackover brines from the Smackover Formation, which extends from Texas to Florida, contain between 50,000 ng/mL and 572,000 ng/mL of lithium. This source is currently being considered for exploration by the Arkansas Smackover Lithium Project.
Some of these levels are very very extremely high indeed. The highest number we reported in our original post was 24,880 ng/mL in parts of Chile. In comparison, the MEDIAN concentration in waters from shale gas wells is 25,000 ng/mL. Many of these brines have lithium concentrations in the range of 100,000 ng/mL, and some contain more than 1,000,000 ng/mL!
The USGS report also mentions that lithium concentrations are higher in arid regions. All together, this seems pretty interesting because the Middle East is especially famous for 1) being very arid and 2) having lots and lots of oil wells.
In theory, these wells should all be sealed and/or the brines should be injected deep underground where they can never contaminate anything humans come into contact with. This is important because these brines are not only as salty as hell, but also radioactive. Fortunately, the oil and natural gas industry doesn’t make mistakes.
It seems quite clear that the Pima were exposed to lithium from brines leaking out of improperly sealed boreholes, so there is at least one example of accidental exposure. And the USGS report we quoted above acknowledges that “such brines may be accidentally or intentionally released to the surface or groundwater”. Is it possible that the Middle East is especially obese because of lithium leaking in from petroleum mining, rather than (or in addition to) lithium exposure from desalination?
If this were true, one thing we might see would be especially high rates of obesity in oil field workers. There are some indications that this is the case. One paper looked at Kuwait Oil Company employees in 1999-2000, and found that 28.8% of field workers were obese, compared to only 25.1% of office workers. Still, both of these groups were less obese than Kuwait in general at the time (about 29% obese). There are also reports like this one, this one, and this one, that suggest that obesity is a particular issue for oil and gas workers, though the reports are frustratingly short on details.
We’ll also note that some of these reports focus on offshore oil workers in particular, and it seems that offshore oil rigs get much of their water from desalination (e.g. see here, here).
“The mining industry,” says a paper from 2017 suggested by a reader, “has the highest proportion (76%) of overweight and obese employees in Australia.” This is in comparison to 62.8% of Australian adults in general. Tsai et al. (2008) looked at “4153 Shell Oil Company employees from three refineries, one each in Texas, Louisiana, California” in the years between 1994 and 2003. “For study subjects actively employed in 1994,” they report, “the most current examination data before 1994 were used. For employees hired after 1994, data were derived from the preemployment exams.” They found that 44.6% of employees were overweight, and an additional 29.0% were obese. For comparison, the general rate of obesity in the US was about 21% in 1994 and about 28% in 2003. (Though note that all these samples are majority male, often about 80% male, which increases the mean somewhat.)
It’s easy to see how this could be a problem in the Middle East, where there’s so much oil drilling. But is it a problem elsewhere? Is it a problem in the US? And could these brines really be getting into the average person’s groundwater?
The first thing to keep in mind is that the United States is one of the top three oil producing countries in the world, and as of this writing holds the #1 spot for most oil produced per day. We produce a lot of oil, and that means we also produce a lot of brine.
The second thing to keep in mind is that we seem to be pretty bad at not spilling our brine everywhere. You’ll recall that the USGS report we quoted above said, “lithium and associated components of such brines may be accidentally or intentionally released to the surface or groundwater in certain locations.” This sounds bad enough, but the bird’s-eye view really obscures some of the horrible details. So let’s look at some sources for these horrible details. In no particular order:
This report from North Dakota State University, which mentions that “the average well in North Dakota produces 18 barrels of brine per barrel of oil and three barrels of brine per barrel of gas,” and goes into some detail about “commonly used methods” for responding to brine spills.
This report “characteriz[ing] the major and trace element chemistry and isotopic ratios … of surface waters (n = 29) in areas impacted by oil and gas wastewater spills in the Bakken region of North Dakota”, which is full of interesting tidbits. For example, we can see that there appear to be more leaks pretty much every year, and we can see that in this sample 46.7% of the brine leakage by volume came from pipeline leaks. We even have lithium measurements — we can see that in “Type A Spills” (whatever those are), the first sample contained 3,244 ng/mL lithium, the second sample contained 3,490 ng/mL, the third sample contained 478 ng/mL… you get the idea.
This report of an ACME Environmental response to an event where “500 barrels of produced water and 50 barrels of oil spilled into a drainage gully which directly flowed into a creek” in Central Oklahoma. The spill was vacuumed up and then the area was flushed with freshwater until “the salinity levels reached an acceptable level.”
This article from certifiedcropadviser.org, that tries to sound optimistic, but includes a number of concerning statistics. “North Dakota’s oil boom can have a salty side-effect,” it begins. “Wastewater from oil drilling and hydraulic fracturing – or fracking – is often laden with salts and can spill, contaminating soils. In 2014, for example, 42 such brine spills per week, on average, were recorded in North Dakota.” They discuss a new method for cleaning up such spills, but the method appears to remove less than half of the salts. “Other methods,” they tell us, “attempt to push the salts below the level plant roots can reach.”
This article from Rolling Stone, which documents some cases of brine trucks crashing and spilling thousands of gallons of brine into drinking water, discusses a case where a hauling company had been dumping brine into abandoned mine shafts for six years, and mentions that “brine has even been used in commercial products sold at hardware stores and is spread on local roads as a de-icer.” If they’re spreading it on the roads, that would uh, that would be a clear reason why it’s ended up everywhere:
Radioactive oil-and-gas waste is purposely spread on roadways around the country. The industry pawns off brine — offering it for free — on rural townships that use the salty solution as a winter de-icer and, in the summertime, as a dust tamper on unpaved roads. … In 2016 alone, 11 million gallons of oil-field brine were spread on roads in Pennsylvania … Much of the brine is spread for dust control in summer, when contractors pick up the waste directly at the wellhead, says Lawson, then head to Farmington to douse roads. On a single day in August 2017, 15,300 gallons of brine were reportedly spread.
This article from the Dallas Morning News, which documents some seriously concerning spills. Really this one is just worth quoting directly. Here are some choice excerpts:
Five years ago, a broken pipe soaked the land with as much as 420,000 gallons of wastewater, a salty drilling byproduct that killed the shrubs and grass. It was among dozens of spills that have damaged the Johnsons’ grazing lands and made them worry about their groundwater.
…
An Associated Press analysis of data from leading oil- and gas-producing states found more than 180 million gallons of wastewater spilled from 2009 to 2014 in incidents involving ruptured pipes, overflowing storage tanks and even deliberate dumping. There were at least 21,651 individual spills. The numbers are incomplete because many releases go unreported.
Though oil spills get more attention, wastewater spills can be more damaging. Microbes in soil eventually degrade spilled oil. Not so with wastewater — also known as brine, produced water or saltwater. Unless thoroughly cleansed, salt-saturated land dries up. Trees die. Crops cannot take root.“Oil spills may look bad, but we know how to clean them up,” said Kerry Sublette, a University of Tulsa environmental engineer. “Brine spills are much more difficult.”
…
The AP obtained data from Texas, North Dakota, California, Alaska, Colorado, New Mexico, Oklahoma, Wyoming, Kansas, Utah and Montana — states that account for more than 90 percent of U.S. onshore oil production. In 2009, there were 2,470 reported spills in the 11 states; by 2014, the total was 4,643. The amount spilled doubled from 21.1 million gallons in 2009 to 43 million in 2013.
…
The spills usually occur as oil and gas are channeled to metal tanks for separation from the wastewater, and the water is delivered to a disposal site — usually an injection well that pumps it back underground. Pipelines, tank trucks and pits are involved.
Equipment malfunctions or human error cause most spills, according to state reports reviewed by the AP. Though no full accounting of damage exists, the scope is sketched out in a sampling of incidents:
•In North Dakota, a spill of nearly 1 million gallons in 2006 caused a massive die-off of fish and plants in the Yellowstone River and a tributary. Cleanup costs approached $2 million. Two larger spills since then scoured vegetation along an almost 2-mile stretch.
•Wastewater from pits seeped beneath a 6,000-acre cotton and nut farm near Bakersfield, Calif., and contaminated groundwater. Oil giant Aera Energy was ordered in 2009 to pay $9 million to grower Fred Starrh, who had to remove 2,000 acres from production.
•Brine leaks exceeding 40 million gallons on the Fort Peck Indian Reservation in Montana polluted a river, private wells and the municipal water system in Poplar. “It was undrinkable,” said resident Donna Whitmer. “If you shook it up, it’d look all orange.” Under a 2012 settlement, oil companies agreed to monitor the town’s water supply and pay $320,000 for improvements, including new wells.
•In Fort Stockton in West Texas, officials in February accused Bugington Energy of illegally dumping 3 million gallons of wastewater in pastures. The Middle Pecos Groundwater Conservation District levied a $130,000 fine, alleging a threat to groundwater, but the company hasn’t paid, contending the district overstepped its authority.
•A pipeline joint failure caused flooding on Don Stoker’s ranch near Snyder in West Texas in November 2012, turning his hackberry shade trees into skeletons. Vacuum trucks sucked up some saltwater and the oil company paid damages, but Stoker said his operation was in turmoil. “I had to stay out there three days and watch them while they were getting the saltwater out, to make sure they didn’t totally destroy the whole area.”
So yeah, maybe these brines are sometimes ending up in the groundwater.
No one is drinking these brines directly. For one thing, doing so would almost certainly kill you. But the lithium concentrations in these brines are so high that even a small amount leaching into your drinking water could have big consequences.
Let’s imagine that a groundwater source containing no lithium mixes with a brine that contains 100,000 ng/mL lithium. If the brine mixes at 1%, the water source ends up containing 1,000 ng/mL lithium, higher than pretty much any lithium levels we’ve seen in drinking water. If the brine mixes at 0.1%, the water source still ends up containing about 100 ng/mL lithium, which is pretty high. But we see about 100 ng/mL in the data for the Pima (coming up below), and that’s probably from a leak from an old well, so 100 ng/mL looks pretty plausible for a brine leak. Even if it were only mixing at 0.05%, that would still be 50 ng/mL in your drinking water, which is quite a bit.
Return to Gila River Valley
A while ago, we looked at the case of the Pima people of the Gila River Valley. During our investigation, we became interested in a paper by Sievers & Cannon (1973). Sources suggested that this paper contained a lot of detail about lithium contamination in the Gila River Valley in the early ‘70s, but we weren’t able to track it down.
But in recent developments, commenter Ralph Waldo Porcupine found the original paper and sent us a copy. Thanks Ralph!
This paper is short, but contains a number of interesting details, so let’s jump right in. To begin with, the obvious pull quote is:
It is tempting to postulate that the lithium intake of Pimas may relate 1) to apparent tranquility and rarity of duodenal ulcer and 2) to relative physical inactivity and high rates of obesity and diabetes mellitus.
Native Americans have higher rates of obesity and diabetes than Caucasians, so we should expect relatively high rates among the Pima either way. However, the paper makes it clear that the rates of both diseases among the Pima are “extraordinary”, even for Native American populations at the time, “the highest ever reported”. For full context:
Most southwestern tribes greatly exceed whites in prevalence of diabetes mellitus. Observations at the PIMC reveal that the Pima tribe has the highest diabetic rate—45% of adults (12). Population studies by Bennett confirm an extraordinary frequency of diabetes mellitus in Pima Indians—the highest ever reported and 10 to 15 times that for the general population (2).
…
Most American Indian tribes have a very high prevalence of obesity. … The Pima tribe has an especially high rate of marked obesity.
The obvious question is, how much lithium was in their water back in the 1970s? The paper doesn’t name a specific number, but judging from Figure 1, the median lithium level in their drinking water was around 100 ng/mL. You’ll recall that this is pretty high even compared to the modern water sources we reviewed in our first post on lithium.

This figure is a little hard to read, so let’s orient you. Each “chemical constituent” is a vertical bar showing the range of concentrations in 77 samples, and a small triangle indicates the median value. We can see that the triangle for lithium is hovering around 10-1 ppm, which works out to 100 ng/mL.
The diagonal line cutting through the figure indicates the median for each constituent in municipal waters, and the horizontal location of each of the bars tells you how much of each constituent is normally in “municipal waters”. This may actually be the most important aspect of the figure, because it answers a longstanding question: back in the day, how much lithium was in the average water supply? We know that in the early 1970s the Pima were getting about 100 ng/mL, but how much was everyone else getting?
Figure 1 suggests that back in the early 1970s, the average concentration of lithium in “municipal waters” was just slightly more than 1 ng/mL. This seems like a pretty big deal — the Pima were not just being exposed to a pretty high dose in their water, their dose was 50-100x higher than the median dose in American municipal water sources at the time!
But we can actually do one better, because Sievers & Cannon cite their source for this diagonal line, a 1964 paper called Public water supplies of the 100 largest cities in the United States by Durfor & Becker. This whole paper is available on Google Books where you can also download a copy for yourself as a PDF.
Just like the title says, this paper looks at the public water supplies of the 100 largest cities in the United States in 1964, and looks at what was in their water. Unlike most modern sources, lithium was on their list — so amazingly, we have pretty good records of how much lithium was in American drinking water all the way back in 1964.
The records are quite clear. The median level of lithium in their samples was only 2.0 ng/mL, 50 times less than the median for the Pima and quite low compared to modern sources.
The minimum level detected was “not detected at all”, and perusing the numbers from individual cities, this makes a lot of sense. As you flip through the 100 cities, you see that lithium levels are generally quite low — often around 1 ng/mL, but sometimes no lithium at all.
Occasionally lithium levels are higher, especially for cities in arid locations like Arizona and Texas. The maximum level detected was 170 ng/mL (in Texas), which is a lot — but this makes sense given what we see with the Pima. We already knew that some water supplies were contaminated with lithium that far back, and it’s no surprise that these water supplies are in Arizona and Texas! In fact, while it’s hard to read from Figure 1, it looks like the maximum value recorded in the Gila River Valley was more than 170 ng/mL, probably closer to 250 ng/mL. But notably, not all water supplies from arid locations had high concentrations of lithium, not even in Texas.
This also matches the other historical sources we’ve been able to find, though most of them have a much more limited scope.
Municipal Drinking Water and Cardiovascular Death Rates from 1966 looked at water from 88 cities. They don’t give much detail, but suggest that the lithium levels in city drinking water were somewhere in the range of 16.8 ng/mL to 5.3 ng/mL. This may seem maddeningly vague to you — it also seems vague to us, so we’re more inclined to trust the 100-cities paper from above, since it is much clearer and provides more detail.
This paper from 1970 looks at lithium levels in the drinking water of 27 Texas communities in summer and fall 1968. They found that lithium was present in measurable amounts in the drinking water of 22 of the 27 communities, and found levels above 11 ng/mL in 15 of the 27. Matching what we saw in the 100-cities paper, some sources were found to contain as much as 160 ng/mL. Texas wasn’t universally contaminated back then, but like Arizona, it had some extreme cases.
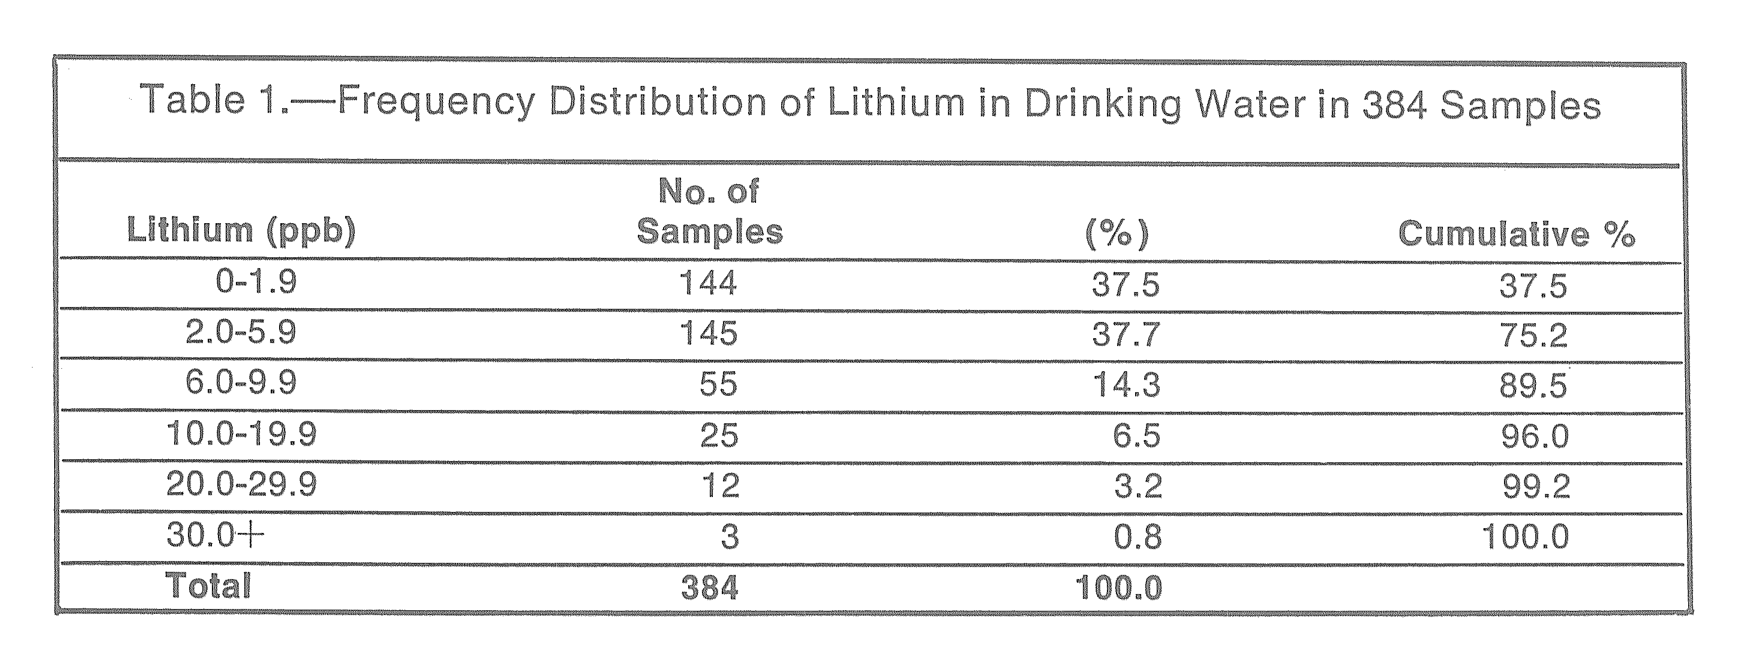
Mood and Lithium in Drinking Water from 1976 looked at 384 drinking water samples from Washington County, Maryland. They found that 37.5% of the samples had lithium levels below 1.9 ng/mL and 75.2% had lithium levels below 5.9 ng/mL. About 90% of samples contained less than 10 ng/mL, and the highest recorded level was a mere 32 ng/mL.
Wolfberries
Sievers & Cannon also found that trace elements in the groundwater accumulate in some plants but not in others. Lithium in particular seems to concentrate in specific plants to an incredible degree:
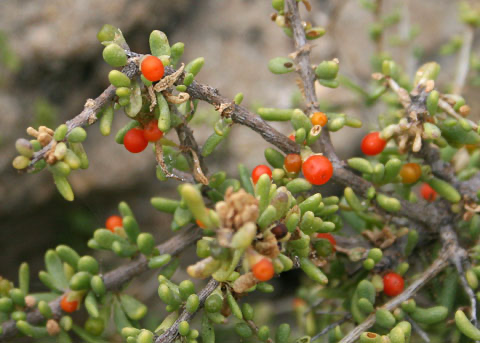
Vegetation is low in most trace elements but some food plants concentrate particular ones. Mesquite beans accumulate strontium; cabbage accumulates sulfate; beans concentrate molybdenum and wolfberry contains an extraordinary 1120 ppm lithium in the dry weight.
…
Figure 2 shows the chemical content of produce and plants that grow on the sandy alluvium of the Gila River. This vegetation has low concentrations of most trace metals but has high levels of lithium. The median level of lithium for Pima Reservation plants is 1.4 ppm (general average elsewhere, 1.0 ppm) but the mean is much higher due to abnormal accumulation by the wolfberry (or squawberry; Lycium californium).
High concentrations of particular elements in certain vegetations become important to human health if the plants are consumed in quantity. Some unusual accumulations in edible plants are shown in Table I. The wolfberry, with an extraordinary lithium content of 1120 ppm, is used occasionally for jelly.
They’re not kidding when they say “extraordinary” — 1,120 ppm is equivalent to 1,120,000 ng/mL!
Let’s unpack this a little. Elsewhere in the paper they say, “Pima Indians drink about 1.6 liters per day (9) of hard water.” Since the level of lithium in the water seems to have been around 100 ng/mL, which is the same as 100 µg/L, this suggests that they got about 160 µg of lithium per day from their drinking water.
In comparison, they say that the wolfberry is “occasionally” used for jelly. Let’s say that this means an average of one tablespoon of wolfberry jelly per day, and let’s assume that the dose is the same in the jelly as it is in the wolfberry itself. A tablespoon is about 14 milliliters, so with a lithium concentration of 1,120,000 ng/mL, they would be getting 15,680,000 ng or 15,680 µg of lithium from the jelly. If these numbers are anywhere near correct, then the Pima were getting around 100 times more lithium from wolfberry jelly than directly from their drinking water.
This might help us square the fact that lithium seems to be associated with weight gain, but the trace amounts in water are so much smaller than the therapeutic doses given by psychiatrists. By the calculations we did in our first post on lithium, the “minimum efficacious” therapeutic dose is about 600,000 µg per day, which would take about 40 tablespoons of wolfberry jelly (2 ½ cups, or slightly more than one jar of jelly). Alternatively, 3,750 liters of Gila River Valley water. It would be hard to drink that much water, but you could definitely get a therapeutic dose if you ate enough jelly. We don’t know what dose of lithium you need before the weight gain starts kicking in, but whatever it is, you can get there a lot faster if lithium is concentrating in the plants you eat.
Let’s imagine that corn accumulates lithium similarly to the wolfberry. (Just to be clear, this is purely a hypothetical — we have no reason to suspect corn in particular.) If your corn is irrigated with pure water containing no lithium, then the corn also contains no lithium. But if the corn is irrigated with water containing 100 ng/mL lithium, like the water in the Gila River Valley, then the corn accumulates a lot of lithium, maybe as much as 1,120 ppm / 1,120,000 ng/mL like the wolfberry does. Certain corn products might contain even more, if they concentrate the lithium further. If the corn is irrigated with water somewhere in between those two doses, then the corn ends up containing some lithium, but probably not as much.
This is complicated even further by the fact that (again just picking on corn as an example, this is true of most crops) there are many different varieties of corn. We treat them all as simply “corn”, but there can be important differences between different varieties, and some varieties might end up concentrating more lithium than others. This means that it’s impossible or sort of even meaningless to ask a question like, “how much lithium is in corn?” Well, what kind of corn? Where is it from? How much lithium was the irrigation water when it was being grown?
So in the future, we need to keep an eye out for plants that might be concentrating lithium. Even if they are only exposed to trace amounts in their water, they could end up concentrating levels around 10,000 times higher! We grow a lot of crops — corn, soybeans, wheat, grapes, rice, almonds, peanuts, apples, etc. — which of these concentrate lithium from their water? Which are commonly exposed?
This complicates things somewhat, but the good news is that if this is the case, we wouldn’t have to worry too much about lithium in our actual drinking water. Instead, we would want to make sure that the water we use to irrigate crops is as low in lithium as possible, which seems much more manageable.
[Next Time: WELL WELL WELL]

Re: lithium in sea-water (and in particular in sea-water in the Middle East).
I thought you might find this article of interest: https://www.mining.com/scientists-develop-cheap-and-easy-method-to-extract-lithium-from-seawater/
The series is fascinating and makes a good case. I’m particularly pleased that you slammed “calories in, calories out,” and in particular the pernicious (and condescending) advice, invariably from some lean individual, “Eat less, move more,” delivered with the smug assurance that he has solved the problem of obesity. I have little doubt that he then moves on to solve the problem of poverty (“spend less than you earn”) and clinical depression (“look on the bright side” or “count your blessings” or (with less specificity) “snap out of it”). Simple solutions from simple minds.
Michael Ham Victoria BC https://leisureguy.wordpress.com https://leisureguy.medium.com
>
LikeLiked by 1 person
So then, we should be looking for wild animals in the Gila River Valley, specifically those that eat wolfberries, to see if they also show higher levels of obesity than those in lower exposure areas?
LikeLiked by 2 people
Thank you for the extremely interesting series!
What are the most low-hanging pieces of evidence we should be looking for? For the general theory of environmental contamination we should e.g. find that people moving from Arabic areas or Texas/Arizona to lower BMI countries lose some weight just like the Chinese moving to USA gain some? (https://bmcnutr.biomedcentral.com/articles/10.1186/s40795-021-00453-z seems to be a study partly addressing this but they were only looking for Arab refugees coming to Germany, who had lost weight during journey and then gained it back, excluding everyone who had been in Germany for more than 5 years).
Another more personal question – I just bought a pack of sea salt (Finnish Merisuola), which is favored over regular table salt by the “health-minded” population; now I’m thinking it may contain a lot of lithium compared to the regular salt, which is cleared from most trace elements.
LikeLiked by 1 person
Thank you for reading!
Any information on people moving to or away from the Middle East would be pretty interesting, and would help clear up if that is a genetic or environmental difference.
This is a good question. We don’t really know, and it’s hard to find records of lithium levels in sea salt. We did find the page below, which suggests that Himalayan pink salt contains 0.40 g/kg lithium, or 400 μg/g. https://themeadow.com/pages/minerals-in-himalayan-pink-salt-spectral-analysis
There’s also this page, which suggests only 0.74 ppm in “Ancient Sea Salt With Natural Trace Minerals”. These are very different numbers so hard to say! We’ll keep looking into it.
Click to access Redmond10Analysis.pdf
LikeLiked by 1 person
Lycium californicum is related to two Asian species, Lycium barbarum and Lycium chinense – these are sold as Goji berries.
LikeLiked by 1 person
What is your opinion on meat?
LikeLike
Pollutants generally concentrate by about an order of magnitude every trophic level you go up. If our plants are contaminated with something, we would expect livestock to be roughly ten times as contaminated.
LikeLiked by 1 person
It seems to me that if lithium causes our obesity, and most lithium comes via bioconcentrators rather than directly from water, there should be sharp variation between different populations (geographical or cultural, or even the same person from year to year) based on their dietary variations. But in fact, it seems the variation in obesity appears much more gradual. Maybe this is evidence that water consumption is the main culprit?
LikeLiked by 1 person
My first thought when reading this was, “well, can we extract the lithium from brine?” Lithium is a valuable resource, so a cheap enough extraction method could pay for itself. Take the lithium out of our food and water and put it in our batteries.
It seems like the standard method for extracting lithium from water is to let it evaporate. Clearly, that’s not going to scale. But it does seem like there’s been some work towards better methods: https://www.nsenergybusiness.com/features/lithium-brine-extraction-research/
I’m reminded of leaded gasoline. Lead exposure during development messes up your brain. It lowers your IQ and makes you impulsive and short-tempered. And we were dosing every kid with it for multiple generations because we used it to make our cars move. And there’s a body of research showing a link between lead and crime.
Is lithium the next lead? Except instead of making you a low-IQ criminal, it makes you obese? Entirely plausible.
LikeLiked by 1 person
Is it at all plausible that lithium could be skin absorbed? I tried to answer this question myself, but I’m not a chemist or a biologist and most of this is way beyond me;
https://echa.europa.eu/registration-dossier/-/registered-dossier/14178/7/2/2
The ECHA dossier thinks it’s not a problem, but their concern is acute toxicity and they based their study off of spas with lithium hypochlorite (hydroxyl?) while industrial pollutants would seem to be lithium carbonate.
https://en.wikipedia.org/wiki/Lithium_carbonate
It seems vaguely plausible that some forms of lithium could be absorbed, since apparently some lithium is used as a topical skin creme:
https://en.wikipedia.org/wiki/Lithium_succinate
(Which would mean some of it has to get through the skin, right?)
https://dermnetnz.org/topics/lithium
Also of note is that apparently lithium can cause skin effects, which makes me wonder whether there’s an uptick in skin issues over the years.
LikeLike
This is a good question, and something we’re also concerned about. Trace levels in water are so much lower than therapeutic doses that it would be kinda weird if trace doses caused obesity — unless lithium is absorbed through the skin and has a different effect when it’s absorbed this way. Or if lithium is absorbed through the lungs when you inhale water vapor, in which case showering might be the main delivery method. There are also lithium compounds used in air conditioning systems — are we breathing those in? Are there other lithium compounds in the air? Is that a problem? https://en.wikipedia.org/wiki/Lithium_bromide
We’re not really sure how to investigate this further. (Try to find out if people who stop washing themselves lose weight? Do a study on showering in distilled water?) If anyone has any ideas we’d be interested to hear them!
LikeLike
Do the locals in Samos drink tap water? IIRC tourists often avoid it.
Why not just try taking some lithium supplements for a while and see if it does anything to your weight?
LikeLike
7up had Lithium in it from 1929 to 1950. In the fourties it was the third best selling soda in the world. I don’t think Lithium is your culprit, at least not imbibed lithium by itself.
LikeLike
Just to add a little quasi-information here, the guys at StackExchange had a go at estimating the Lithium concentration in 7-Up at https://chemistry.stackexchange.com/questions/48344/what-was-the-lithium-concentration-in-1940s-7-up
They put an upper bound at around 200 mg/L of Lithium Citrate (with many caveats applying). This would be, what, around 200 ng/mL, to keep things in the units used in this SMTM article.
That’s…pretty high, although probably not as high as the concentration in Bub-L-Pep. (Shout out to my HPLHS friends!)
LikeLike
Lithium causing obesity is a very interesting hypothesis. Since it’s a psychoactive substance, it fits with the current paradigm of the central nervous system being at the crux of the problem.
As with all hypotheses, it is most useful to try to falsify it – in this case, if there is a very lean population despite massive lithium exposure (massive obesity despite no apparent exposure is confounded by hidden sources), especially where it’s possible to measure tissue levels. What’s the lithium exposure of, say, Hadza?
LikeLike
I take a 10 mg Lithium supplement daily. My BMI is ideal
LikeLike
I’m enjoying the series, but one thing sticks out to me – early on you discuss the weight-gain effects of a bunch of psychiatric drugs. Given the massive rise in prescribing, do you think there might be a wider impact than just the (increasing) population of patients? How much lithium is excreted by the average patient? How much of other drugs?
LikeLike
The NSF certify the safety of lubricants for different levels of proximity to food (H1, H2, H3) in US manufacturing processes. It would be very interesting to see to what degree lithium greases are present in those categories.
https://info.nsf.org/usda/psnclistings.asp
LikeLiked by 1 person
“We can see that the triangle for lithium is hovering around 10-1 ppm, which works out to 100 ng/mL.”
Are you sure it’s not 100 pL/mL? Which, given lithium’s (surprisingly low) density of 0.534, would come out “only” 53.4 ng/mL.
LikeLike