The current model of nutrition science is that nutrition is a struggle of mind over body. You just need to find the discipline to completely ignore your instincts, to avoid what you enjoy and restrict all the stuff you like. The more you like it, the more you should probably restrict it. You should ignore and suppress the signals your body is sending you and do exactly the opposite instead.
What if we flip that on its head, and assume that your mind is silly while your body is wise? Notice what feels good, things you enjoy and respond well to, then ramp up those?
This seems to have worked well for both Elizabeth Van Nostrand and ExFatLoss (and his participants so far). Elizabeth eats all the watermelon she wants, and in her own words, her health is “obviously doing much better” than before. ExFatLoss loves cream, eats almost nothing but cream, and is currently down more than 50lbs.
Our potato diet came from a similar place. Seeing all the case studies where people lost a ton of weight did pique our interest. But we also just love potatoes, and we were kind of curious if we could eat nothing but potatoes and never get tired of them. Turns out, we pretty much can. Even after months of dedication, we still love potatoes. And so do many of our participants:
(16832193) I was quite surprised that I didn’t get tired of potatoes. I still love them, maybe even more so than usual?!
(57875769) My wife and I went out to eat with a friend and I expected to use today as a cheat day, but honestly potatoes sounded like the best thing on the menu so I ordered hash browns and french fries. The hash browns were very filling on their own so I didn’t eat many of the fries.
There are lots of different methods you can use to estimate the lithium in a sample of food. This usually involves some kind of chemical liquefication (“digestion” in the parlance) paired with a tool for elemental analysis. You need digestion to analyze food samples, because some analysis techniques can only be performed on liquids, and as you may know, many foods are solids or gels. Mmmmm, gels. *HOMER SIMPSON NOISES*
Most modern studies use ICP-MS for analysis of metals like lithium, combined with digestion by nitric acid (HNO3). ICP-MS is preferred because it can analyze many elements at once and it is considered to be especially sensitive. HNO3 is preferred because it is fast and cheap compared to alternatives.
Studies that use HNO3 digestion with ICP-MS tend to find no more than trace levels of lithium in their food samples — only about 0.1 mg/kg lithium in most foods, and no foods above 0.5 mg/kg. Examples of these studies include Ysart et al. (1999), which surveyed 30 elements in a wide variety of UK foods and found no more than 0.06 mg/kg lithium in any food; Saribal (2019), which measured the levels of 19 elements in cow’s milk samples from supermarkets in Istanbul, and found less than 0.04 mg/L lithium in all samples; and Noël et al (2006) which surveyed the levels of 9 elements in “1319 samples of foods typically consumed by the French population”, finding 0.154 mg/kg or less lithium in all foods (though they reported slightly higher amounts in water).
But as we’ve reviewed in previous posts, the literature as a whole is split. Studies that use other analysis techniques like ICP-OES or AAS, and/or use different acids like H2SO4 or HCl for their digestion, often find more than 1 mg/kg in various foods, with some foods breaking 10 mg/kg. Examples include studies like Ammari et al. (2011), which found 4.6 mg/kg lithium in spinach grown in the Jordan Valley; Anke, Arnhold, Schäfer, and Müller (1995) which found more than 1 mg/kg lithium in many German foods, including 7.3 mg/kg lithium in eggs; and in particular we want to mention again Sievers & Cannon (1973), which found up to 1,120 mg/kg lithium in wolfberries (a type of goji berry) growing in the Gila River Valley.
1.1 State of the Art Isn’t Great
From the existing literature alone, it’s hard to say what concentrations are present in today’s food. Different papers give very different answers, and often seem to contradict each other. It’s hard to get oriented.
We don’t want to give the impression that there’s a consensus to be boldly defied, or that there are two opposing camps. It’s more like this: hardly anyone has even tried to do a decent job of even looking for lithium in food or taking it seriously, and we are here to smack them and tell them to pay attention to something that has been ignored. This is not a well-studied question. It is a subject that has been the topic of few papers and even fewer authors. It is a small literature and very confused.
Hardly anyone can even be bothered to look for lithium. When it does appear in a study, half the time it feels just tacked on to a list of things that the authors actually care about (like in the France study above). Many of these studies are really looking for toxic metals like lead and cadmium, which are obviously important things to check for in our food. But this makes lithium an afterthought. And when authors don’t care, fundamental issues of analysis can easily be overlooked. The assumption seems to be that you can just throw everything into the same machine and get a good measurement for every element without any extra effort. But as we’ll see in a moment, that may not be the case.
As we hinted at above, the analytical methods may be the root of the problem. Studies that use HNO3 digestion with ICP-MS report minor trace levels of lithium in food. Studies that use other forms of digestion or other analytical techniques report much higher levels, often above 1 mg/kg. This makes us think that the different analyses are the reason why these papers get such different estimates. However, we couldn’t find any head-to-head comparisons in the literature, and it isn’t clear if the problem lies with ICP-MS, HNO3 digestion, or both.
1.2 Effects of Lithium
This is more than a purely academic question: lithium is psychoactive, and exposure through our food could have real health effects.
Clinical doses, which usually range between 56 mg and 336 mg elemental lithium per day, act as a mood stabilizer and sedative. These doses also cause all kinds of nonspecific adverse effects, including confusion, constipation, headache, nausea, weakness, and dry mouth.
Even the trace amounts of lithium in our drinking water (< 1 mg/L) may have some effects. A epidemiological literature with roots dating back to the 1970s (meta-analysis, meta-analysis, meta-analysis) suggests that long-term exposure to trace levels of lithium in drinking water decreases crime, reduces suicide rates, reduces rates of dementia, and decreases mental hospital admissions, and this is supported by at least one RCT. The EPA is even concerned about exposure to levels as low as 0.01 mg/L and 0.06 mg/L, describing them as “concentrations of lithium that could present a potential human-health risk”, though they don’t say why.
1.3 Measurement
Trusting your methods is the basis of all empirical work. The disagreement in the existing literature is important because we don’t have a good sense of how much lithium is in our food. It’s concerning because it suggests we might not know how to measure lithium in our food even when we try! This looks like a crisis of methods either way.
High enough levels of lithium in our foods would be dangerous, so we should know how to take a piece of food and figure out how much lithium is inside it. But there isn’t much research on this topic, and it looks like different methods may give very different answers — if this is true, then we don’t know how to accurately test foods for lithium. And it’s likely that lithium levels in the environment are increasing due to both lithium production and fossil fuel prospecting — see Appendix B for more.
As an analogy, we should know how to measure mercury levels in fish in case it’s ever a problem — our chemists should be able to check fish samples periodically and get a good estimate of the mercury levels, an estimate we feel we can rely on. Because if we can’t measure it, then we don’t know if it’s a problem. High levels could slip by undetected if our methods aren’t right for the job.
1.4 Head-to-Head
Before we can really figure out how much lithium there is in food, we need to find analytical methods that have our full confidence. And the simplest way to test our methods is a head-to-head comparison.
This seemed easy enough, so we set up a project with research nonprofit Whylome to put a set of foods through different digestions and put the resulting slurries in different machines, and see if they give different answers. By comparing different digestions and analytical methods on a standard set of food samples, we should be able to see if different techniques lead to systematically different results.
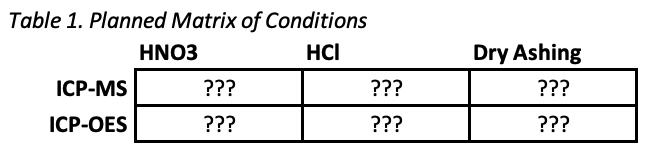
Based on the patterns we saw in the literature, we decided to compare two analysis techniques (ICP-MS and ICP-OES) and three methods of digestion (nitric acid, hydrochloric acid, and dry ashing). Details about these techniques are in the technical report, and in the methods section below.
We originally wanted to compare more analysis techniques (AAS, flame photometry, and flame emission methods) but weren’t able to find a lab that offered these techniques – they are somewhat oldschool and not in common use today. More on this below.
It turned out that the type of analysis didn’t make much difference, but the way in which samples were digested for analysis was surprisingly impactful. And the technique that’s most commonly used today seems to underestimate lithium, at least compared to alternatives.
This project was funded by a generous donation to Whylome from an individual who has asked to remain anonymous. General support for Whylome in this period was provided by the Centre For Effective Altruism and the Survival and Flourishing Fund.
Special thanks to all the funders, Sarah C. Jantzi at the Plasma Chemistry Laboratory at the Center for Applied Isotope Studies UGA for analytical support, and to Whylome for providing general support.
The technical report is here, the raw data are here, and the analysis script is here. Those documents give all the technical details. For a more narrative look at the project, read on.
2. Methods
The basic idea is to test a couple different analytic approaches on a short list of diverse foods.
Most modern analyses use either ICP-MS or ICP-OES. Some of these papers find low concentrations of lithium in food; some of them find high concentrations. We wanted to compare these two techniques to see if they might be the cause of the differences in measurements.
Based on what we had seen in the literature, we decided to compare two analysis techniques (ICP-MS and ICP-OES) and three methods of digestion (nitric acid, hydrochloric acid, and dry ashing), fully crossed, for a total of six conditions.
2.1 Food
As this is our first round of testing, we wanted a diverse set of foods that could give us some sense of the American food environment in general. Therefore we were looking for a mix of foods that were animal-based and plant-based, highly-processed and unprocessed, a mix of fruits, vegetables, dairy, carbs, and meats. We also made sure to include some foods that previous literature had suggested could be extremely high in lithium (like eggs and goji berries), to see if we could confirm those results. Twinkies made the cut because they’re highly processed and highly funny.
In the end, we settled on the following list:
Milk
Carrots
Eggs
Ketchup
Spinach
Corn syrup
Goji berries
Twinkies
Ground beef
Whey powder
All foods were purchased in August of 2022 at grocery stores around Golden, Colorado. Foods were immediately dried, blended, and divided into tubes for further processing, with weight measurements taken at each step of the process.
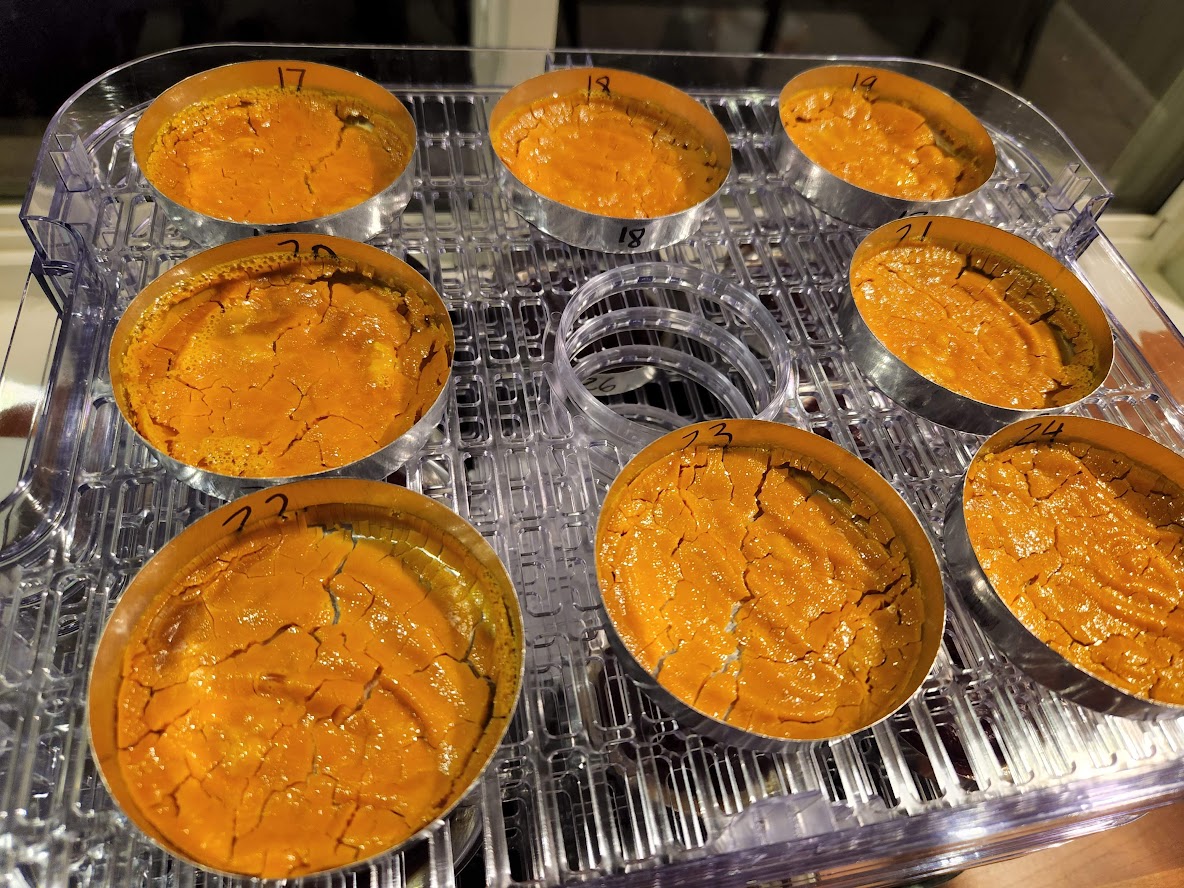
For example, this is how we prepared the eggs. A carton of twelve eggs were cracked into a stick blender, and blended until well-mixed. A subset of the resulting egg blend was then dehydrated, enough to produce all of the needed material with some to spare. The dried egg (more like flakes at this point) was crushed and mixed well. All samples were taken from this egg powder. Three samples each were submitted to every method of analysis, so every result is an estimate of the concentration of the target element averaged across the whole carton. Put another way, our sample size was one (1) carton of eggs, not 12 eggs separately. As the egg blend was well-mixed, all samples should in principle have the same concentration of elements, suggesting that any variation between samples is the result of analytic noise rather than variation between different eggs or different cartons.
the aforementioned eggs post-dehydration (but before crushing/powderizing)
The member of the team who prepared the samples had this to say:
Making a “Twinkie puree” out of a bowl of twinkies, and then precisely weighing it out into drying trays and placing it in a dehydrator, is probably the strangest thing I have ever done in the name of science. My trusty stick blender really struggled with twinkies, and I had to take a pause because the overworked motor started to make a burning smell. “Twinkiepuree” has unusual visco-elastic properties which make it worth the effort.
Samples were analyzed in triplicate, and each replicate was done entirely separate (its own digestion and its own analysis of the resulting post-digestion solution). Order was randomized, to minimize the risk of “carry-over” from one analysis to the next.
2.2 Digestion
In the literature, most analyses that found low levels of lithium used digestion by nitric acid. To see if this might be the cause of the differences in results, we decided to compare nitric acid digestion to some other digestion approaches. In the end we settled on two other kinds of digestion: 1) digestion with hydrochloric acid, and 2) “dry ashing”, where samples are burned at high temperatures, then the ash is dissolved in nitric acid.
Dry ashing is a good complement to these acid digestion techniques because while oily foods are very chemically resistant to oxidizers, they are also very flammable. Greasy foods full of hydrocarbon chains that may not perfectly come apart in an acid are likely to be fully broken down by incineration. Incineration causes organic compounds to exit the sample as CO2 gas, but elements like sodium, potassium, magnesium, and lithium are non-volatile and remain behind in the ash.
2.3 Analysis
Both ICP-MS or ICP-OES generate a tiny cloud of high-energy plasma, the “inductively-coupled plasma” of the acronym. And both methods inject a cloud of liquid droplets into that plasma. The difference is that ICP-OES examines the light that is emitted by the plasma as the liquid sample hits it, while ICP-MS examines the actual particles of matter (ions) that are emitted by the plasma as the sample hits it, by directing those ions towards a sensor.
3. Results
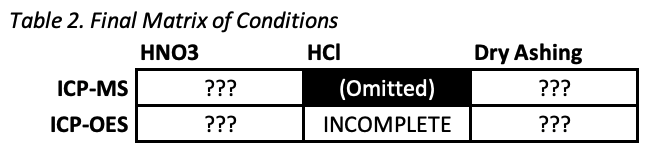
The first surprise was that hydrochloric acid digestion visibly failed to digest 6 of the 10 foods. Digestions were clearly incomplete and significant solid matter was still visible after the procedure. The 6 foods were carrots, ketchup, spinach, corn syrup, goji berries, and twinkies. This is an interesting mix since it includes fibrous, sugary, and oily foods, so there’s no obvious trend as to what worked and what didn’t.
Without complete digestion, the measurements we got from ICP-OES couldn’t be expected to be at all accurate. So while we have these results, they probably aren’t meaningful, and we discontinued hydrochloric acid digestion for all other samples.
The main results are all ten foods in four conditions: ICP-MS after HNO3 digestion, ICP-OES after HNO3 digestion, ICP-MS after dry ashing, and ICP-OES after dry ashing.
Little difference was found between the results given by ICP-MS and ICP-OES, other than the fact that (as expected) ICP-MS is more sensitive to detecting low levels of lithium. However, a large difference was found between the results given by HNO3 digestion and dry ashing.
In samples digested in HNO3, both ICP-MS and ICP-OES analysis mostly reported that concentrations of lithium were below the limit of detection. The highest numbers given by this technique were in spinach, which was found to contain about 0.2-0.3 mg/kg lithium, and goji berries, which ICP-MS found to contain up to 1.2 mg/kg lithium.
In comparison, all dry ashed samples when analyzed by both ICP-MS and ICP-OES were found to contain levels of lithium above the limit of detection. Some of these levels were quite low — for example, carrots were found to contain only about 0.1-0.5 mg/kg lithium. But other levels were found to be relatively high. The four foods with the highest concentrations of lithium, at least per these analysis methods, were ground beef (up to 5.8 mg/kg lithium), corn syrup (up to 8.1 mg/kg lithium), goji berries (up to 14.8 mg/kg lithium), and eggs (up to 15.8 mg/kg lithium).
These results are summarized in greater detail in the technical report, and in this figure:
4. Which technique is more accurate?
We think that dry ashing (which gives the higher estimates for lithium) is probably more accurate, and here are some reasons why.
Reason #1: Many water samples contain some lithium, and some water samples contain a lot of lithium — sometimes more than 1 mg/L, and occasionally a lot more than 1 mg/L. Unlike food samples, water samples require no digestion, so measurements of water samples are probably quite accurate.
Most food is grown using water and contains some water [CITATION NEEDED]. It would be strange if food, which is made out of water (plus some other things) always contained less lithium than the water it is made out of. More likely, there’s something else that can interfere with the analysis when foods aren’t completely digested.
Reason #2: The analysis lab we used has a “buy one element, get one free” deal, so for all of the foods we submitted, we requested sodium analysis (Na+) on top of the lithium (Li+). We figured, why not, it doesn’t cost any extra.
If there were something unusual about the lithium analysis, you’d expect sodium to behave differently. Specifically, you’d expect each analytical method to find similar levels of sodium in every food. So we compiled the sodium data and ran the same analysis as lithium. And sure enough, it does. Here’s a comparison of the results for lithium and sodium:
(Note that the y axes are different scales. There is way less lithium than sodium in these foods, so when analyzing lithium we are much closer to the limits of quantitation.)
If you were validating the equivalence of sample prep procedures based on Na+, you’d say “looks good, great agreement between ashing and HNO3 digestion.” This isn’t at all true for Li+. Why? We have no idea. But it further supports the suspicion that Li+ is more slippery for some reason, an excellent comparison that highlights just how strange the lithium results are.
This also seems to rule out various “operator error” explanations. If someone were dropping vials or putting them in the machine backwards or something, you would see weird patterns for both lithium and sodium results. The fact that the sodium results look totally normal suggests that something weird is happening for lithium in particular.
Reason #3: Imagine taking pictures with a camera. If you point the camera at something dark, the resulting picture comes out dark. If you point it at something bright, the resulting picture comes out bright. This is a good sign that the camera is working as intended, and that you’re operating it correctly. If your pictures always come out dark, something is probably wrong. Maybe you forgot to take off the lens cap.
We see something similar in these data. Dry ashing sometimes gives low measurements, like in milk and carrots, which it always found to contain less than 0.6 mg/kg lithium. Dry ashing sometimes gives high measurements, like in eggs and goji berries. There’s a lot of noise, but we know that it can produce numbers both large and small.
In comparison, HNO3 digestion always gives tiny numbers. Most of the time it finds that lithium levels are below the limit of detection. When it does seem to detect an actual amount of lithium, the levels are always low, never above 1.2 mg/kg. These numbers look less like actual estimates and more like a problem with the instrument. A cheap digital camera can’t take a good picture at night, even when it’s working perfectly well.
Reason #4: Several parts of the literature hint that spectroscopy techniques are a bad way to measure lithium in food. These comments are often vague, but it seems like people already have reason to think that these methods underestimate the amount of lithium.
For example, Drinkall et al. (1969) mention that they chose to use AAS (“the Unicam SP90 Atomic Absorption Spectrophotometer, [with] a propane-air flame”) because of their concern about “spectral interference occasioned by elements other than lithium” in spectroscopy techniques.
Manifred Anke, who did more work on lithium levels in food than maybe anyone else, makes this somewhat cryptic comment in his 2003 paper:
Lithium may be determined in foods and biological samples with the same techniques employed for sodium and potassium. However, the much lower levels of lithium compared with these other alkali metals, mean that techniques such as flame photometry often do not show adequate sensitivity. Flame (standard addition procedure) or electrothermal atomic absorption spectrophotometry are the most widely used techniques after wet or dry ashing of the sample. Corrections may have to be made for background/matrix interferences. Inductively coupled plasma atomic emission spectrometry [another name for ICP-OES] is not very sensitive for this very low-atomic-weight element.
We can also point to this article by environmental testing firm WETLAB which describes several potential problems in lithium analysis. “When Li is in a matrix with a large number of heavier elements,” they say, “it tends to be pushed around and selectively excluded due to its low mass. This provides challenges when using Mass Spectrometry.” They also indicate that “ICP-MS can be an excellent option for some clients, but some of the limitations for lithium analysis are that lithium is very light and can be excluded by heavier atoms, and analysis is typically limited to <0.2% dissolved solids, which means that it is not great for brines.” We’re not looking at brines, but digested food samples will also include many heavier atoms and some dissolved solids, and might face similar problems.
The upshot is that various sources say something like, “when testing foods, you have to do everything right or you’ll underestimate the amount of lithium”. We can’t tell exactly what these sources think is the right way to do this kind of analysis, but everyone talks about interference and underestimation, and no one mentions overestimation. This makes us suspect that the lower HNO3 digestion numbers are an underestimation and the higher dry ashing numbers are more accurate.
ICP techniques can detect all the elements from lithium to uranium, which means that lithium is just on the threshold of what can be detected. It wouldn’t be terribly surprising if lithium were an edge case, since it is on the edge of detection for ICP analysis. Interference might push it over the edge of the threshold. And interference would only lead to mistakenly lower measurements, not mistakenly higher measurements. This suggests the higher measurements are more accurate.
Reason #5: There are a few cases where teams have used HNO3 digestion and still report high concentrations of lithium in food, in particular Voica, Roba, and Iordache (2020).
This suggests that maybe there’s some trick to HNO3 digestion that can make it give higher, more accurate results, numbers that are consistent with dry ashing. Maybe these teams know something we don’t.
𐫱
All of these are reasons to suspect that the higher dry ashing numbers are more accurate. However, the truth is that at this point, nobody knows.
Given this uncertainty, it could be that neither technique is accurate. The true levels of lithium in these foods might be in between, or could be even higher than what was detected by dry ashing.
Using other analysis techniques like AAS or AES or FAES would be a good way to triangulate between these two conflicting methods. Unfortunately we have not been able to find a lab that offers AAS or other alternative methods of chemical analysis. Can anyone help us?
Accuracy aside, one thing that stands out is that none of these techniques are very precise. For three samples of the same well-blended corn syrup, dry ashing with ICP-OES gives estimates of 0.7155 mg/kg, 1.5892 mg/kg, and 8.1207 mg/kg lithium. HNO3 digestion with ICP-OES generally doesn’t report any lithium at all, but for spinach, it gives estimates of 0.3914 mg/kg, 0.2910 mg/kg, and 0.3595 mg/kg. These are for three identical samples of well-blended spinach. In theory they should be the same! But all four techniques appear to have relatively low precision across the board.
5. What does this mean for analytical chemistry?
Two different analytical techniques gave two very different answers when looking at the exact same samples. This seems like an anomaly worth investigating.
These unusual findings may result from the fact that lithium is the third-lightest element and by far the lightest metal. It’s a real weird ion, so this may just be lithium being lithium. But even so, if the nitric acid completely digests a sample and gives a clear, homogeneous solution, it would seem like there is nowhere for Li+ to hide. From first principles, you’d expect this to work.
It’s also possible that this points to a more consistent limitation of common analytical techniques. Certainly it would be a problem if the techniques we used to estimate mercury in fish, or arsenic in rice, consistently underestimated the concentrations of these metals.
It may be smart to run similar studies to compare analytical techniques for estimating other metals in foods, to make sure there aren’t any other hidden surprises like this one. If work along these lines turns up many similar surprises, well, maybe that means we don’t understand analytical chemistry as well as we think.
6. Next Steps
We would like to test a lot more samples, and get a better sense of how much lithium is in all kinds of different foods.
But before we can do that, we have to figure out this mystery around different analytical techniques. It doesn’t make sense to go out and use one method to test a thousand different foods when we don’t know if that method is at all reliable or accurate.
So first off, we will be trying to figure out which technique is most accurate, and if we can, we’ll also try to figure out why these different analytical techniques give such strikingly different results.
There are a few ways we can do this:
We can add known amounts of lithium to food samples in a spike-in study.
We can also spike-in elements that might be interfering with lithium detection.
We can try other kinds of digestion or other analytical techniques (like AAS) as a tiebreaker, and see if they agree more with the HNO3 numbers or the dry ashing numbers.
Or we can study more samples — it’s possible that a food containing 1000 mg/kg would register above the limit of detection for both techniques.
If you have any other clever ideas, please let us know!
In the meantime, here are some ways you can help:
If you have access to the necessary equipment, please replicate our work. We’ve included all the checks we could think of, but it’s still possible that there was some mistake in our procedure, something backwards about the results. Independent labs should confirm that they get similar results when comparing HNO3 digestion to dry ashing in ICP-MS and ICP-OES analysis.
An even bigger favor would be to extend our work. If you are able to replicate the basic finding, it would be jolly good to tack on some new foods or try some new analytical techniques. Do you have access to AAS for some reason? Wonderful, please throw an egg into the flame for us.
If you’re not an analytical chemist but you are a person of means who is both curious and skeptical, you could conceivably hire a lab to replicate or replicate and extend our work. If you’re interested in doing this, we would be happy to advise.
Thanks again to our anonymous donor, to Sarah Jantzi, and to Whylome for supporting this research.
Finally, thank you for reading!
APPENDIX A: Wait what is the background for this study?
Hello, we are SLIME MOLD TIME MOLD, your friendly neighborhood mad scientists.
We started getting into this question because in our opinion, the evidence suggests that exposure to subclinical doses of lithium is responsible for the obesity epidemic — you can read all about it in Part VII and Interludes C, G, H, and I of our series, A Chemical Hunger.
We also understand that not everyone finds this evidence convincing. That’s ok. Even if you don’t think lithium causes obesity, this project is still important for other reasons: 1) lithium might have other health effects, so 2) we should be able to test food for lithium concentrations so we can know how much we’re consuming and act accordingly. And in general, this looks like it might be a gap in analytical chemistry. We should know how to analyze things; so let’s close that gap.
APPENDIX B: Where is all this lithium coming from?
We’ve already written quite a bit about this, so if you want the full story, you should read those posts: in particular Part VII, Interlude G, Interlude H, and Interlude I of A Chemical Hunger.
But the short version is this. Starting around 1950, people started mining more and more lithium and never looked back, and some of what we mine eventually ends up as contamination. Lithium goes in batteries, which end up in landfills. It also goes in the lithium grease used in cars and other heavy machinery, which ends up in runoff. Deeper aquifers often contain more lithium, so drilling deeper wells may have also increased our exposure.
Graph showing world lithium production from 1900 to 2007, by deposit type and year. The layers of the graph are placed one above the other, forming a cumulative total. Reproduced from USGS.
People frequently ask us why we are anonymous. The answer is that we’re not anonymous, we’re pseudonymous. Both of these approaches are useful ways to conduct your internet science, so here is a quick guide to choosing which one works best for you:
Anonymous
No name attached at all.
Highest level of separation between government identity and the individual.
Can be good for one-off research or theoretical pieces that don’t need to be connected to other things you’ve worked on, or things that might be better for a different audience.
For study participants, the best option to protect their privacy.
Literally you can do infinite anonymous identities.
Naming conventions: numbering is easy, but there’s lots of opportunity to be creative. Or just say “by Anonymous”. Actually Google Docs has a nice approach:
Anonymous NyanCat
Pseudonymous
A pseudonym is like a band name. It’s a name that you will use multiple times, and a name that can develop its own reputation.
A pseudonym may or may not be connected to a legal name — this can also change over time or in different contexts. Lots of people are known by a stage name or a pen name professionally, but you can still find their other names without too much trouble. You may not immediately know Jay Z’s government name, but it’s not hard to find out that he was born Shawn Corey Carter.
Pseudonyms are great for groups! Fighting for first authorship is stupid — just come up with a silly name instead.
You can also have multiple pseudonyms. Generally it makes sense to pick one name for a given project and stay with that for a while, so that people can get to know your style and see what you do as a body of work that should be considered. But using different pseudonyms for different projects, or when you’re working with different groups, is a good approach.
Conclusions: Really it’s a spectrum. There are lots of different options that can work, depending on the project and your specific concerns.
Jon was a participant in our Potato Diet Community Trial. He recently sent us an email with an update on how he’s doing, which is reproduced below with his permission.
I don’t know if you wanted a 1 year followup.
So last year at this time I’d just come off my first potato diet and it seemed like the weight was staying off at least partially out of sheer cussedness and a desire to see my much-touted diet work out as well as I’d hoped. Where am I at a year later?
At the end of that first potato diet I was at 168, having lost about 15 pounds from my start of 183.6. Last time I weighed myself I was at around 172. That’s practically within water-weight of that 168! And that 172 is approximately stable compared to a month ago or whenever I last weighed myself!
In the last year I’ve done a couple more tries at the potato diet, neither of which were as successful as that first one. But I think when it comes down to it the potato diet knocked my basic set-weight down by about 11 pounds! The biggest ongoing change in my diet is having tater tots and sausage for breakfast almost every day, generally replacing cereal in the old regime.
Anyway, absurdly pleased by that result–potato diet wasn’t a magic bullet for me but it halted the inexorable upward slide of my weight, got me down a little bit and has kept me stable for a year.
Even though it never worked as well again (probably lack of accountability from not being part of a study) the potato diet was still life-changing and has improved my health long term! Please let me know if you need any more data, I’m happy to provide it! Thanks,
ExFatLoss publishes a summary of the ex150 trial results. “Just like the proverbial dog chasing an automobile, I realized that I didn’t know what to do next. When I first asked for volunteers to try ex150, I was worried: what if this crazy cream diet doesn’t work for anyone else? What if it only works for me? Spoiler alert: it seems to work for nearly everybody. Young and old, men and women, obese to normal weight, very active to lazy.” We’d quibble a little: it worked for nearly everyone, but also 10 out of 10 participants had previous experience with low-carb/keto/carnivore. It’s not clear if it would work for the average person. Even so, a great start and an interesting finding. We hope to see ExFatLoss continue his research and would be interested to see others replicate this result!
Luck based medicine: angry eldritch sugar gods edition — an n=1 self-experiment, concluding among other things that “1-2 pounds of watermelon/day kills my desire for processed desserts, but it takes several weeks to kick in.” The author also says, “metabolism is highly individual and who knows how much of this applies to anyone else.” And we agree. We will need hundreds or thousands of people doing n=1 studies like this in order to crack nutrition. You go back and look at 19th century astronomy, there were scores of astronomers tracking each new comet and asteroid. A 21st century nutrition science will rely on similarly broad participation. Nutrition may well be more confusing, and maybe more complicated, than the heavens. Fortunately it is easier to eat lots of watermelon than to set up an astronomical observatory.
Cleopatra (1917) is a lost film starring early sex symbol Theda Bara, the original “vamp”. All known copies were lost in a 1937 studio fire, and only tiny fragments remained. Until this month when someone found a fragment included with a toy film projector listed on eBay, and uploaded 41 seconds of footage to YouTube.
I chose to give it away to everyone. If I couldn’t prevent Fables from falling into bad hands, at least this is a way I can arrange that it also falls into many good hands. Since I truly believe there are still more good people in the world than bad ones, I count it as a form of victory.
… In the past decade or so, my thoughts on how to reform the trademark and copyright laws in this country (and others, I suppose) have undergone something of a radical transformation. The current laws are a mishmash of unethical backroom deals to keep trademarks and copyrights in the hands of large corporations, who can largely afford to buy the outcomes they want.
In my template for radical reform of those laws I would like it if any IP is owned by its original creator for up to twenty years from the point of first publication, and then goes into the public domain for any and all to use. However, at any time before that twenty year span bleeds out, you the IP owner can sell it to another person or corporate entity, who can have exclusive use of it for up to a maximum of ten years. That’s it. Then it cannot be resold. It goes into the public domain. So then, at the most, any intellectual property can be kept for exclusive use for up to about thirty years, and no longer, without exception.
Of course, if I’m going to believe such radical ideas, what kind of hypocrite would I be if I didn’t practice them? Fables has been my baby for about twenty years now. It’s time to let it go. This is my first test of this process. If it works, and I see no legal reason why it won’t, look for other properties to follow in the future. Since DC, or any other corporate entity, doesn’t actually own the property, they don’t get a say in this decision.
THIRD PLACE: Have Attention Spans Been Declining? by niplav, writing as Cennfaeladh, who also blogs at niplav.site. Also, honorable mention to niplav for getting by far the most (30,000+) pageviews.
We’ve been in contact with all three winners and will be sending them their awards shortly. Congratulations!
In addition, TripleTaco gave us this proposed explanation to the list of Amish mysteries. For your consideration:
After I formed my own theory of what caused Autism, I looked hard to see if anybody else had come to the same conclusion. After a long time of looking, I finally found one researcher, Max McDowell, who explains what he (and I) believe likely causes autism in this video: https://www.youtube.com/watch?v=BHhAnCTVLG4
If I were naming this, I’d call it “face starvation”. Babies have a crucial window in which they need a certain amount of eye contact and starving them of that causes autism for many children. He goes on in that video to describe many of the same mysteries I described in my mystery post. The theory lines up with the mysteries perfectly.
The video has been out for over 2 years and at this moment it has 114 views. His idea was first published all the way back in 2004, so it’s not new at all. It’s just being utterly ignored, and for very strong reasons:
First of all, he calls himself a “Jungian Psychoanalyst”, which frankly makes him sound kind of woo-woo and makes it harder to take him seriously. Secondly, he’s well outside of the academic circles that have earned the right to talk about autism and its causes. He’s an outsider. Thirdly, it’s a shocking, awful idea, and anybody championing it will be pilloried from all sides. The idea is threatening to the neurodiversity camp who don’t want autism treated like a disorder at all. The idea is threatening to parents who aren’t eager to hear that their own technology habits may have contributed to severe lifelong difficulty in their child. The idea is threatening to existing researchers who are far along other research paths and stand to gain little from such a simple tidy explanation, especially when championing it would get them in all kinds of hot water from every direction. Frankly, this idea is way too controversial to put my own name on, which is why this is an anonymous contribution.
Even if we’re right, I’m not hopeful that people are going to start taking this idea seriously. There are some ideas that are just too controversial to be taken seriously.
You may not think of grantmaking as jet-setting, but Stuart Buck makes it sound like being James Bond. More seriously, a fascinating look at the life and times of the most active “metascience venture capitalist”, who ”funded some of the most prominent metascience entrepreneurs of the past 11 years, and often was an active participant in their work.”
Our experiments consisted of inoculating exponentially growing bacteria into a given medium and following bacterial growth by measuring optical density. Samples were taken every fifteen minutes, and the technicians reported the results. They were so involved that they had identified themselves with the bacteria, or with the growth curves, and they used to say for example: “I am exponential,” or “I am slightly flattened.” Technicians and bacteria were consubstantial.
So negative experiments piled up, until after months and months of despair, it was decided to irradiate the bacteria with ultra-violet light. This was not rational at all, for ultra-violet radiations kill bacteria and bacteriophages, and on a strictly logical basis the idea still looks illogical in retrospect. Anyhow, a suspension of lysogenic bacilli was put under the UV lamp for a few seconds.
…
It was a very hot summer day and the thermometer was unusually high. After irradiation, I collapsed in an armchair, in sweat, despair, and hope. Fifteen minutes later, Evelyne Ritz, my technician, entered the room and said: “Sir, I am growing normally.”
Being a Lizard — a response to Adam Mastroianni’s invitation to a secret society. The author describes the process of setting up a DIY biology lab, including thoughts on location and instructions on how to spend cents on the dollar for your own lab equipment. We only wish there were more detail, maybe even a complete guide to help others set up their own labs, but maybe that will come in a future post.
One biohacker in particular I got in touch with told me to aim to spend 1-2 cents on the dollar against new pricing on the equipment I needed. At first I thought he was being hyperbolic, but then I started looking in some of the places he told me to, and before I knew it, I was finding and buying thousands of dollars worth of equipment for literally hundreds, making the initial cost barrier I’d perceived negligible.
You’re probably wondering why this is the case. Well, because the people that are liquidating these items see it as junk that is taking up rentable space, especially large items like biosafety cabinets and CO2 incubators. If you’re patient, these items can literally be acquired for free. Just last week I bid for a $9,000 incubator for < $50 and a 4 hour drive to Iowa State University.
So why isn’t there more demand for this equipment in the open market? According to the NIH, the average research project grant size is over a half a million dollars. You can spend up to $25,000 on a single piece of equipment under a grant budget without even needing to ask for approval. Academic labs and companies with funding have every incentive to buy the coolest new piece of equipment on the market to do their research, and are under time constraints that don’t warrant cutting costs by searching the secondary market.
Independent biohackers on the other hand are working under the opposite set of constraints. We may have a surplus of time to answer our research question outside of other commitments, but are constrained by resources and expertise to do so.
“Wernicke‐Korsakoff syndrome is the partial destruction of the brain resulting from a lack of thiamine (vitamin B‐1).” This sometimes comes to pass as a result of malnutrition, but it’s more stereotypically associated with severe and long-term alcoholism. Fortunately, treatment and prevention are quite simple — just give people thiamine. So in the 1930s and 1940s, people started to experiment with adding thiamine directly to alcoholic beverages, and found that it was stable in several favorites, including beer, wine, and whiskey. This seems like the ideal public health measure — vitamin fortification in a product that will go directly to people at risk of a terrible disease resulting from a lack of that very vitamin. However, in 1940 this idea ran afoul of our arcane legal system. In Irish mythology, there are magically binding vows called geasa, and the doom of heroes often comes from having multiple geasa that come into conflict. For example, Cú Chulainn has a geas never to eat dog meat, and he has another geas always to eat any food offered to him by a woman. When an old crone offers him dog meat, he’s trapped. Federal rulings have the same problem (modulo dog meat). You have to list all food additives on the label. But you also aren’t allowed to list the vitamin content of alcoholic beverages — that might imply that drinking alcohol is healthy. So we really dropped the ball in 1940 and we should really consider a return to the idea of adding thiamine to alcohol… reports this New York Times article from 1979. Maybe there were good reasons we didn’t, or maybe this is several millions of dollars in public health savings just lying on the sidewalk. You decide! Here’s a 1978 N Engl J Med article on the same idea if you want to learn more.
There are lots of stories where an American goes on vacation for a few weeks, to Europe or Asia or wherever, and loses a significant amount of weight without any special effort.
There are also some stories that are exactly the opposite: someone from Europe or Asia or wherever goes on vacation to America for a few weeks, and GAINS a significant amount of weight without any changes.
Some stories describe what are almost simple ABABA-style experiments, where a person goes back and forth from America to other parts of the world and sees their weight reliably yo-yo as they move from country to country. We shared one such story in Part X of A Chemical Hunger, this account from Julius:
I currently live in Seattle but have moved around a lot. I’ve made 6 separate moves between places where I drank the tap water (mostly USA/UK/Hungary) and places I haven’t (South East Asia, India, Middle East). Whenever I’ve spent significant time in bottled water countries I lost weight (up to 50 lbs), and each time, save one 3 month stretch in Western Europe, I gained it back in tap water countries. I also lost weight for the first time in the States (20 lbs) this year around the time I switched to filtered water.
We can also share this story, from another reader (lightly edited per his request):
I quit my job and moved to northwest Thailand. I lived there for about 1.5 years and lost 100lbs. At the end, I was thinner than I’d ever been as an adult, even in Germany, just under 200lbs (or ~90kg). I didn’t do much if any exercise and I typically ate as much as I wanted.
Then I moved to SF and gained the 100lbs back within 2-3 years. I worked out while I was still thin, but, again, it didn’t stop the gaining and eventually became impractical as I was too fat to run. Peaked around 300lbs once again.
So then I thought, it’s the work stress. So I quit my job once more, and I moved to Las Vegas, where I lived for an ENTIRE YEAR without a job. And didn’t lose any weight.
During these last few years, I would often vacation in Thailand for 1-3 months, and always lose weight without trying. Typically, if I was there for at least 1 month, I’d see some noticeable fat loss on the order of a few pounds, and feel my belt get looser.
Even right now, as I’m visiting with my family back in Germany, I am visibly and belt-feel thinner after only 3 weeks of being outside the US, despite zero exercise and eating a ton of salami and cheeses.
Anecdotes are fun, but so far there hasn’t been any systematic study. If this vacation weight loss effect is real, it seems like it would be good to know. It would give us a powerful tool for causing weight loss (just take a trip to somewhere leaner than where you’re living right now), and it would help us get closer to finding out what causes obesity.
In particular, it would provide more evidence for the contamination hypothesis, since losing weight on vacation is a pretty strong hint that something about the environment is to blame. Most of the anecdotes above seem pretty confident their weight loss has something to do with the “unprocessed” foreign food, but there are reasons to think it might be some other part of the foreign environment. And if we could study vacation weight loss in a systematic way, we might be able to narrow things down.
But this data is not very systematic, and may not be representative. In particular, if you go on vacation to Europe and you lose no weight, you probably don’t post about it on social media, and you probably don’t email us to tell us about the weight you didn’t lose.
We can correct for this by trying to collect data in a more systematic way. We can also try to come up with a design that lets us account for some alternative explanations (more on this in a bit).
We have a few ideas for study designs, but we’re not sure what kind of design would be best. We’ll describe general ideas for designs below, and please, let us know what you think.
If any of the designs seem good, we might run one of these studies at some point. But it’s somewhat of a shame for us to be running so many of these internet studies. No one should have to take our word for these things — it would be better if the work/knowledge/expertise were spread around the community.
So if you want to help run one of these studies, or if you want to take point and run it yourself, let us know and we can talk about collaborating. Or you can just take the design and run with it, we’re not your mom.
Walking
But first: Some people are skeptical that there is something special about vacation. The most common alternative they offer is some form of, “it’s all the extra walking”.
But there are some problems with this response. For starters, it assumes that all these people are walking more, but you don’t always walk more on vacation than you do at home. Some people have very active day jobs, and there’s nothing stopping you from sitting quietly in your hotel room for a week straight.
It ignores the other details people often mention in these stories, like that they also ate much more and ate “worse” than normal on vacation. From a simplistic CICO perspective, this extra food should balance out the extra walking.
And if extra walking on vacation were the cause of vacation weight loss, then extra walking ANYWHERE should cause weight loss. This would mean that slightly more mild cardio is a good treatment for obesity in general. But “slightly more mild cardio” doesn’t work as a treatment for obesity, so it’s clearly not the cause of vacation weight loss.
More importantly, many people who lost (or gained) weight on vacation make it clear that they don’t think it was the extra walking. Yes, they are not totally neutral parties, but no one is a totally neutral party, and they are the only ones with firsthand knowledge of their own cases.
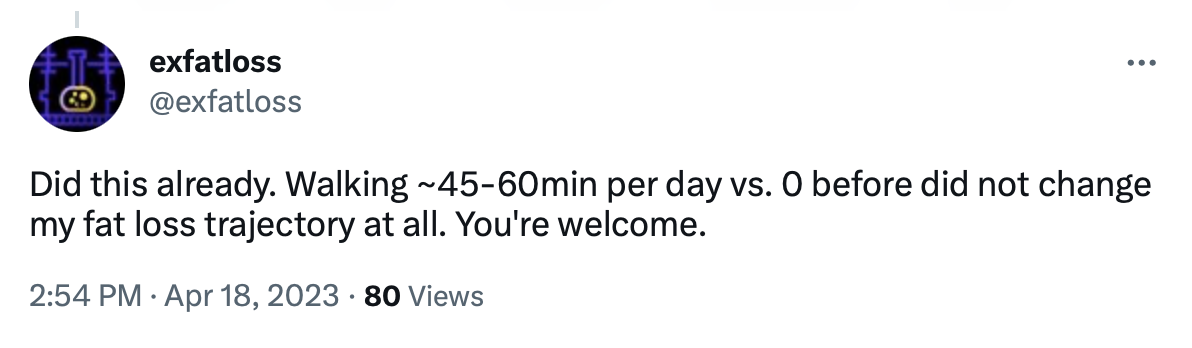
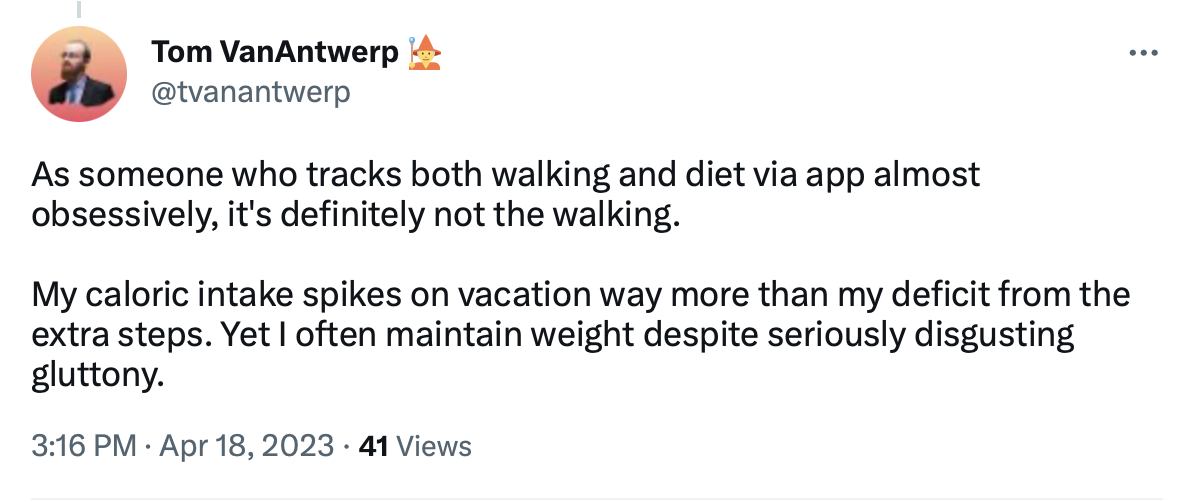
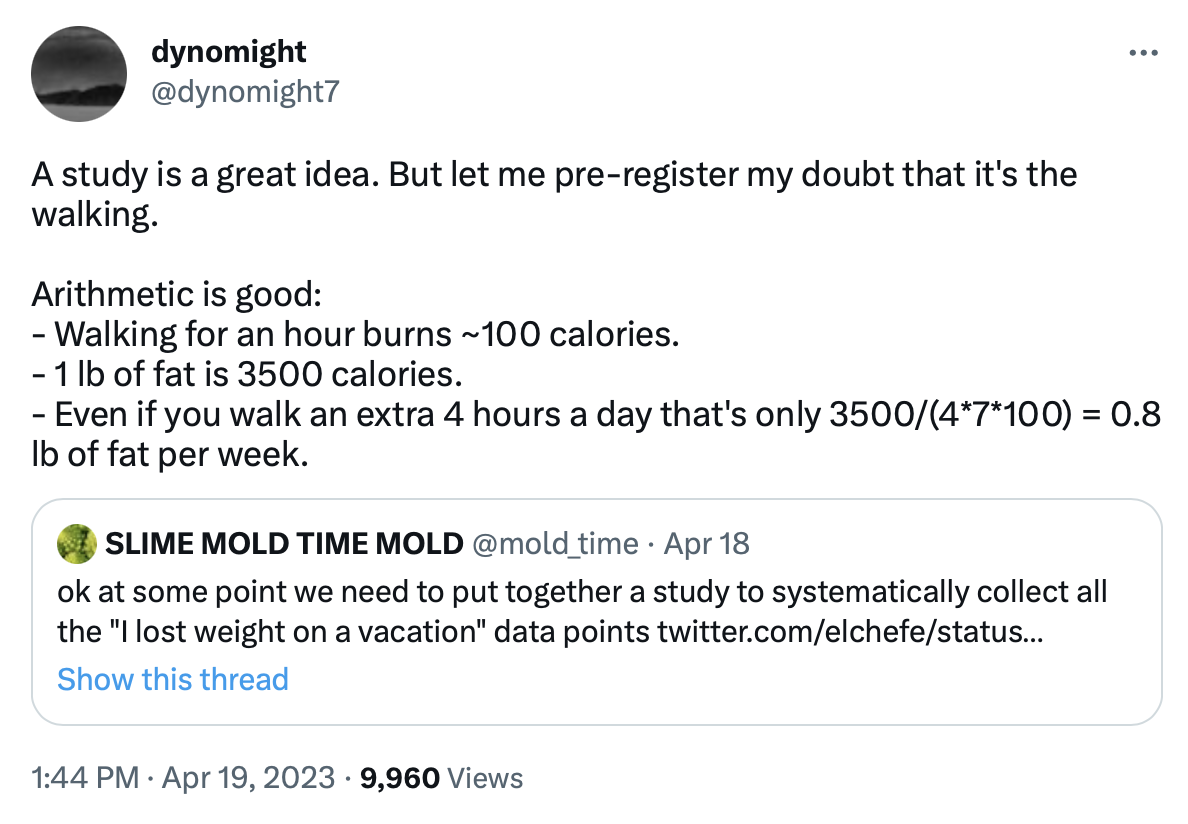
There may be other reasons to doubt that extra walking is to blame. Friend-of-the-blog dynomight is skeptical that the walking explanation survives back-of-the-napkin math:
But all this debate is really for nothing. We can just check.
For starters, it’s easy enough to ask people to count steps. Their phones make estimates automatically. We can see if people are walking more on vacation and if how much extra walking they do is at all related to how much weight they lose.
We can compare Americans who go on vacation to Europe with Europeans who go to vacation in America. Maybe both groups walk more than average while they’re on vacation, but if the Americans lose weight in Europe and the Europeans gain weight in America, that would suggest that the extra walking has little to do with the weight change.
We can also compare between states. Different US states vary widely in their obesity rates, from 25% in Colorado to more than 40% in Kentucky. If it’s something about the environment, then people from Kentucky should lose weight when they vacation in Spain, but people from Colorado might not. Similarly, we can look at people taking vacations in different US states. Europeans might gain weight in Mississippi but might not gain weight in Massachusetts.
We could even do something ludicrous like: “take identical obese twins, send one twin on vacation to Italy and have the other twin stay in America and try to match their walking distance as closely as possible.”
With the right design, it should be relatively easy to tell if walking is to blame. It’s fine if somehow it turns out that extra walking is the real cause of vacation weight loss, but clearly this is somewhat controversial — we should do a study and see.
Design #1: Existing Cohort Study
First, we could use data that someone else has already collected.
Programs like the Fulbright Program and the Peace Corps send young people to different countries around the world. These programs are already doing a controlled study on the vacation weight change effect, they just don’t know it. For example, the Philippine-American Fulbright Commission takes young people from a fat country (America) and sends them to a lean country (the Philippines), and also takes young people from a lean country (the Philippines) and sends them to a fat country (America), in both cases for about a full year.
These programs may already be recording students’ weights before and after their trip abroad, perhaps for medical reasons. If so, all the data we need already exists out there in some database. If not, all that would be required would be convincing the program, or even just some of the students, to start recording their weights before and after the exchange.
This is pretty much the ideal experiment. It’s systematic — we will get information from everyone, whether or not they gain or lose weight. The sample size is huge. And the data may already exist.
The problem is that we don’t know if there’s any way for us to GET this data. We haven’t had any luck trying to get in touch with Fulbright or any of these other programs, and we doubt they would be willing to make this data public.
If anyone thinks they could put us in touch with anyone on the Fulbright Philippines Board of Directors, or anyone at a similar organization (the American armed forces might have similar data), we would love to do this analysis. But barring that, we’ll have to come up with ways to collect our own data.
Design #2: Retrospective Vacation Study
Second, we could collect vacation information that already exists.
People have gone on many vacations over the course of human history [citation needed]. So for this design, we would systematically collect all the existing vacation stories we can.
This could be as simple as setting up a google form and asking people to submit stories about their past vacations (or other international trips, like exchange programs or briefly being an expat). The form would include just a few simple questions — how long the trip was, how much they weighed before, how much they weighed after, where they went, etc. Then we could look at this data to see if there’s any support for the vacation effect.
You might want to limit this (and the designs we talk about below) to trips that are at least two weeks long, because one week probably wouldn’t be enough to get a clear signal.
The upside of this design is that you might be able to get a lot of data pretty quickly. But there are some downsides.
First off, people may not remember how much they lost, how long they were gone, or other details of the trip. In short, the measurements will be noisy.
Second, you can’t ask people to collect specific data, or ask them to collect it in specific ways, because the vacation has already happened. If people happen to have measurements of how much they walked on their vacation, that would be great, but most people won’t have collected that data.
Finally, there’s bound to be a selection effect. People who lost weight on vacation are probably more likely to respond than people who gained weight. This isn’t totally damning since we can still see things like 1) whether people lost more weight on longer vacations, 2) whether people lost more weight when they traveled to leaner countries, or 3) whether younger people lost more weight than older people. But it is a limitation.
So it would be easy to run this study, and maybe informative if we got enough responses, but there are some problems with this kind of design.
Design #3: Prospective Vacation Study
Third, we could collect vacation data as it’s being created.
People continue to go on vacations today; in fact, many people are planning vacations right now. So another option would be to ask people to sign up to report on any vacations they’re about to take, and provide us a little data about the before and after.
The design would be pretty simple: first a pre-vacation survey, where people tell us about the vacation they’re about to go on, where they’re coming from, where they’re going, how long it will be, and how much they weigh right now. We’d also ask them to give us some measure of their average activity, maybe their average steps per day over the last three months — something easy that should already be captured by their phone.
Then when they get back, there’d be a post-vacation survey, where people could tell us what their weight was after the vacation. We’d also ask them for their average steps per day while on vacation, so we could get a sense of if they are walking more or less than normal. We could also ask them to report subjectively on measures like whether they exercised more or less than usual, and whether they ate more or less than usual.
This would help keep selection effects somewhat in check. No one knows before a vacation whether they will gain or lose weight — they can’t decide whether or not to sign up for the study based on their weight change, because it hasn’t happened yet.
If we have a high attrition rate, with lots of people filling out the first part but not filling out the second, this could be a sign that people who gain weight don’t come back and report their weight gain. But if the attrition rate is low, that suggests there isn’t much post-hoc selection.
We can also do comparisons just within the people who respond. Maybe the attrition rate is high, but if all the Americans going to Europe report losing weight, and all the Europeans coming to America report gaining weight, we can be fairly sure that’s not just selection.
The downside is that this approach would be pretty slow. There are lots of vacations, but we have to wait for people to come to us one by one as they jet off on their various trips.
This design is also not very controlled. We don’t get to pick the vacations and we don’t get to pick the vacationers. It’s a convenience sample, and while it might still be revealing, there are limitations.
Design #4: Controlled Vacation Experiment
Fourth, we can go out of our way to create the data we want.
It’s within our power to make vacations happen under controlled conditions — recruit some people who are obese and who can spend a month or two abroad (perhaps they have a remote job), and send them to a lean country for a couple weeks to see what happens. As with the other designs, you could have them track their exercise and other confounders if you want.
This is a version of what we have previously called “Slime Mold Time Mold’s Excellent Adventure”.
We were originally concerned that even if things were perfect, weight loss would be pretty slow. Even if you sent people to Japan for a month, they might not lose weight quickly enough for you to reliably detect the change. We thought that you might have to send people abroad for closer to a year, just to pick up on the effect.
But the results of the Potato Diet have convinced us that under the right conditions, quite a lot of weight loss can happen in just a few weeks. So now we think that a vacation study of 2-4 weeks might actually be informative.
And you may not need very many people. It’s still not clear how many people lose weight on vacations, but if the effect is consistent enough, you could find strong evidence with just a few participants (yet another n of small opportunity). If five obese people go to Italy for a month and all of them drop 10 lbs while sitting around and eating spaghetti alla carbonara ad libitum, that would be strong evidence, even with the small sample size.
The ideal countries to send people to would probably be Vietnam (leanest country in the world, about 2% obese), Bangladesh, India, Nepal, Japan, or South Korea (all less than 5% obese). There are many relatively lean countries in South America and Europe, but even Albania is more than 20% obese, so you would probably get a weaker effect.
This wouldn’t be too expensive. It costs around $4,000-$5,000 to send someone to a lean country for a month, so you could likely send around 10 people to one of these countries for a month for less than $50,000. Not pocket change, true, but cheap in the grand scheme of scientific studies. Given that many people enjoy vacations [citation needed], you might even be able to get people to pay for half of their trip.
It might make sense to run one of the other studies first to see if they back up the anecdotes, before spending all this money. But the other study designs aren’t nearly as controlled. If you’d be interested in funding this study, or helping us arrange all the travel details (booking hotels and flights is not our strong suit), please let us know. Or you can ignore us, recruit 10 obese volunteers, and send them to Myanmar all on your own. Just let us know what you find out!
Similarly, anyone who is at all overweight could run this as an N=1 self-experiment, or get a few friends and run it as an N of small. You just need to be in a position to spend a few weeks in one of these lean regions.
The main drawback is that the small sample size would keep you from making interesting comparisons. Sending 10 obese Americans on a one-month trip to a small Asian country could make a strong case for the vacation effect, but it wouldn’t let us answer questions like the following: do young people lose weight faster on vacations than old people? Do other demographics (like ethnicity) have an impact? Do people lose weight faster in Peru (19% obese) than in Spain (27% obese)? Do people with BMI < 25 also lose weight on vacations?
This would be another reason to run multiple studies with different designs. Sending people on a planned vacation gives you a lot of experimental control with the limitation of a small sample size, while other designs can give you a large sample size at the cost of experimental control. Both could tell us a lot, and they’d be stronger together — triangulation is the name of the game.
Final Notes
As far as we know, no one has ever done a vacation study like this, so any study at all would be interesting. It doesn’t have to be perfect — we should start by getting our toes wet.
We’re talking about these designs like they’re all about obesity, but this approach doesn’t have to be used to study obesity. You could also use it to study, say, migraines. Lots of people think they are gluten or lactose intolerant — but are they still gluten or lactose intolerant if they’re eating bread or milk in, say, Italy? Might be interesting to find out.
As always, we are happy to help with designs and methodology. If you want to run one of the studies described above, please contact us!
We will probably keep voting open until the end of the day on August 31 in case you want a chance to go back and re-read your favorites. In case you’ve forgotten, the finalists are:
[This is one of the finalists in the SMTM Mysteries Contest, by a reader writing under the pseudonym Lee S. Pubb. We’ll be posting about one of these a week until we have gotten through all the finalists. At the end, we’ll ask you to vote for a favorite, so remember which ones you liked.]
Background
Element 53, iodine, is a mineral essential to human health largely because it is utilized in the production of thyroid hormones.[1] For much of recorded human history, societies the world over suffered from the iodine deficiency disorder known as goiter–swelling in the neck resulting from an enlarged thyroid gland. It was common in regions where topsoil was regularly eroded (e.g., by flooding), as topsoil is rich in iodine, normally leading to its uptake in food crops. It’s also abundant in foods derived from the ocean, as ocean water contains iodine.
While Chinese doctors are said to have prescribed the consumption of animals’ thyroid glands to treat goiter as early as the 7th century, it was only in the early 20th century that large-scale research was done on iodine supplementation. It was found that sufficient levels of iodine consumption eliminated goiter in the vast majority of cases, and we began iodizing salt soon after. (Which is why I had to give this lengthy background on goiter, instead of just saying “that giant lump in your friend’s neck”.) The FDA recommends that Americans consume 150 mcg of iodine a day, and expect that the vast majority of Americans will achieve this through salt consumption.
(Very likely the reason you don’t have a goiter.)
That said, while the level of iodine supplementation present in modern-day table salt is clearly sufficient to greatly reduce the incidence of goiter, that doesn’t necessarily mean that it’s the ideal level for overall thyroid health.[2] (The FDA’s upper limit is set nearly 8 times higher than the RDA, at 1,100 mcg, suggesting that considerably more than the recommended amount isn’t expected to be deleterious to human health.) The thyroid largely regulates metabolism, and you may be familiar with some mysteries raised about human metabolism over the past century.[3] There are also a number of diseases directly associated with thyroid function, and these are pretty common in the present day (especially among women), with around 20 million patients in the United States estimated to have some kind of thyroid disorder. Thyroid functioning is screened for by doctors via blood tests measuring thyroid hormone concentration. Common disorders include hypothyroidism, in which an abnormally low level of thyroid hormone is produced, and hyperthyroidism, in which too much is produced.
INTERESTING!:
The Blue Zones are regions around the world renowned for their high proportion of centenarians, people living to the age of 100 or later. These are Okinawa, Japan; Sardinia, Italy; Nicoya, Costa Rica; Ikaria, Greece, and Loma Linda, California. These zones are now getting the shit studied out of them by anthropologists, doctors, etc., so we can try and figure out why they live so long and hopefully use it to improve human healthspan elsewhere.
You will not be surprised, given the background I just provided, to find out that iodine appears to be related to the mystery of the blue zones.
In the study Association of endemic goitre and exceptional longevity in Sardinia: evidence from an ecological study, the authors note “The spatial analysis revealed that the goitre rate (p < 0.0001), the proportion of inhabitants involved in pastoralism (p = 0.016), the terrain inclination (p = 0.008), and the distance from the workplace as a proxy for physical activity (p = 0.023) were consistently associated with population longevity at an aggregated level in the 377 municipalities.” Which is to say, a higher goiter rate in a municipality was the measure they studied that was most clearly associated with greater longevity. This association had an extremely–to my mind, an almost outrageously–low p-value.
The study goes on to say that, “from a worldwide perspective, the finding of an epidemiological association between goitre prevalence and longevity does not seem to be limited to Sardinia, but partially shared also by other populations where long-lived subjects are numerous. Most of the Longevity Blue Zones in the past were niches of endemic goitre as well. In Costa Rica, where the Nicoya LBZ was identified in 2007 (Rosero-Bixby 2008), high prevalence of endemic goitre has been reported since the 1950s (Perez et al. 1956) possibly aggravated by a gross excess of calcium ingested with drinking water (Boyle et al. 1966). In another LBZ, Ikaria island, the iodine level in spring water is remarkably low (Pes and Poulain 2014).”
So great, restrict iodine and you’ll live forever, right? AGING SOLVED! WE DID IT, YOU’RE WELCOME, aging is just iodine damage.
…Except.
Another Blue Zone is Okinawa, where most of the population routinely consumes nutritionally large quantities of seaweed–one of the richest natural sources of iodine. How much iodine are they consuming? I don’t have great numbers on Okinawa itself, but mean consumption of iodine in Japan is estimated at around 1-3 milligrams a day–that’s 1,000-3,000 micrograms of iodine. Remember that the FDA puts the RDA of iodine at just 150 micrograms, and the UL at 1,100 micrograms! Apparently, many Japanese people are consuming considerably more than the “tolerable upper intake level” for iodine. Centenarianhood is apparently their reward. Japan has 86,000 centenarians (.06% of their population, the highest percentage in the world), and a life expectancy of 84.62 years, second only to Hong Kong (the population of which, as of 2011, had a high risk of iodine deficiency).
These studies, taken together, suggest that having a moderate iodine intake leads to early death. As the Buddha said, “seek extremes in all things and maybe you can live to be a hundred”.
It is difficult not to propose any explanations for this, but that is the task that has been assigned to me, so, there you have it. Low iodine is correlated with longevity. High iodine is correlated with longevity. The thyroid is truly the most mysterious organ.
[1] If that first sentence surprised you, you’re in good company; iodine is “the heaviest element commonly needed by living organisms.”
[2] Plus, there’s bound to be population variance–I, for one, use kosher salt in my cooking, because Alton Brown told me to, and it’s not iodized. I’m surely exposed to iodized salt via processed foods and restaurant meals, but I do consume those somewhat rarely, at least compared to the number of meals I prepare at home.
[3] Iodine was once used to treat flour, oxidizing it to allow gluten to more easily form bonds and create the texture all us non-celiacs love in bread and pizza. But around the same time we began to study iodine supplementation, we invented potassium bromate, and started brominating flour instead to achieve the same effect–potassium bromate produced a very white flour that rapidly oxidized. Iodine is a necessary mineral, though, and bromine isn’t. So there was likely a point in recent American history where iodine consumption in bread decreased. You’re also really not supposed to consume the potassium bromate, but the thought is that baking temperatures sublimate the bromine–ah fuck I guess you really *shouldn’t* eat raw cookie dough? fuck.