When the Tofurky research division is working on new alternative protein products, they tend to worry about taste. They tend to worry about appearance. And they tend to worry about texture.
If they’re making an alternative (i.e. no-animals-were-harmed) turk’y slice, they want to make it look, smell, and taste like the real thing, and they care about proper distribution of fat globules within the alt-slice.
But here’s a hot take, might even be true: people don’t mainly eat food for the appearance. After all, they would still eat most foods in the dark. They don’t mainly eat foods for the texture, the taste, or even for the distribution of fat globules. People eat food for the nutrition.
Who’s hungry for a hot take?
This is why people don’t eat bowls of sawdust mixed with artificial strawberry flavoring, even though we have invented perfectly good artificial strawberry flavoring. You could eat flavors straight up if you wanted to, but people don’t do that. You want ice cream, not cold dairy flavor #14, and you can tell the difference. This is a revealed preference: people don’t show up for the flavors.
A food has the same taste, smell, texture, retronasal olfaction, and general mouthfeel when you start eating it as when you finish. If you were eating for these features, you would never stop. But people do stop eating — just see how far you can get into a jar of frosting. The first bite may be heavenly, but you won’t get very deep. The gustation features of the frosting — taste, smell, etc. — don’t change. You stop eating because you are satisfied.
Assuming you buy this argument, that the real motivation behind eating food is nutrition, then why do people care about flavor (and appearance, and texture, etc.) at all? We’re so glad you asked:
People can detect some nutrients as soon as they hit the mouth: the obvious one is salt. It’s easy to figure out if a food is high in sodium; you just taste it. As a result, it’s easy to get enough salt. You just eat foods that are obviously salty until you’ve gotten enough.
But other nutrients can’t be detected immediately. If they’re bound up deep within the food and need to be both digested and absorbed, it might take minutes, maybe hours, maybe even longer, before the body registers their presence. To get enough of these nutrients, you need to be able to recognize foods that contain these nutrients, even when you can’t detect them from chewing alone.
This is where food qualities come in. Taste and texture are signs you learn that help you predict what nutrients are coming down the pipeline. Just like how you learn that thud of a candy bar at the bottom of a vending machine predicts incoming sugar. The sight of a halal van predicts greasy food imminently going down your drunk gullet. How you learn that the sight of the Lays bag means that there is something salty inside, even though you can’t detect salt just from looking at it. You also learn that the taste of lentils means that you will have more iron in your system soon, even if you can’t detect the iron from merely putting the lentils in your mouth.
To give context, this is coming from the model of psychology we described in our book, The Mind in the Wheel. In this model, motivation is the result of many different drives, each trying to maintain some kind of homeostasis, and the systems creating the drives are called governors. In eating behavior, different governors track different nutrients and try to make sure you maintain your levels, hit your micros, get enough of each.
There’s still a lot we don’t know about this, but to give one example we’re confident about, there’s probably one governor that makes sure you get enough sodium, which is why you add salt to your food. There’s also at least one governor that keeps track of your fat intake, at least one governor clamoring for sugar, probably a governor for potassium. Who knows.
Governors only care about hitting their goals. Taste and texture are just the signs they use to navigate. And this is where the problem comes in.
Consider that for all its flaws, turkey is really nutritious. Two slices or 84 grams of turkey contains 29% of the Daily Value (DV) for Vitamin B12, 46% of the DV for Selenium, 49% of the DV for Vitamin B6, and 61% of the DV for Niacin (vitamin B3).
Tofurkey is not. As far as we can tell, it doesn’t contain any selenium or B vitamins. Not clear if it contains zinc or phosphorus either. Maybe this is wrong, but at the very least, it doesn’t appear that Tofurkey are trying to nutrition-match. And that may be the key to why these products are still not very popular. If you try to compete with turkey on taste and texture, but people choose foods based on nutrition, you’re gonna have a problem.
This is just one anecdote, but: our favorite alternative protein is Morningstar Farms vegetarian sausage links. And guess what food product contains 25% DV of vitamin B6, 50% DV of niacin, and 130% DV of vitamin B12 per two links? Outstanding in its field.
In the Vegan War Room
We believe this has strategic implications. So please put on your five-star vegan general hat, as we lead you into your new imagined role as commander of the faithful.
General, as you may be aware, the main way our culture attempts to change behavior is by introducing conflict. We attempt to make people skinny by mocking them, which pits the shame governor against the hunger governors. We control children by keeping them inside at recess or making them stay after class, which pits the governors that make them act up in class against the governors that make them want to run around with their friends. Or we control them by saying, no dessert until you eat your brussel sprouts.
This is an unfortunate holdover from the behaviorists, who once dominated the study of psychology. In behaviorism, you get more of what you reward, and less of what you punish. Naturally when they asked themselves “how to get less of a behavior?” the answer they came up with was “punish!” But this is a fundamentally incomplete picture of psychology. Reward and punishment don’t really exist — motivation is all about governors learning what will increase or decrease their errors. While you can decide to pit governors against each other, this approach has serious limitations. It just doesn’t work all that well.
First of all, conflict between governors is experienced as anxiety. So while you can change someone’s behaviour by causing conflict, you’ll also make them seriously anxious. This is fine, we guess, if you hate them and want them to feel terrible all the time. But it’s more than a little antisocial.
Anyone who’s the target of punishment will see what is happening. They don’t want to feel anxious all the time, and they especially don’t want to feel anxious about doing what to them are normal, everyday things. If you try to change their behavior in this way, they will find you annoying and do their best to avoid you, so you can’t create so much conflict inside them. Imagine how much less effective this strategy is, compared to finding a method of convincing that people don’t avoid, or that they might even actively seek out.
On top of this, conflict dies out without constant maintenance. In the short term you can convince people that they will be judged if they have premarital sex, but this lesson will quickly fade, especially if they see people getting busy without consequence. The only way to keep this in check is to run a constant humiliation campaign, where people are reminded that they will be shamed if they ever step out of line. This is expensive, neverending, and, for the obvious reasons, unpopular. Scolding can work in limited ways, but nobody likes a scold.
Many attempts to convince people to become vegan, or even to simply eat less meat, follow this strategy — they try to make people eat less meat by taking the governors that normally vote for meat-eating (several nutritional governors, and perhaps some other governors, like the one for status) and opposing them with some other drive.
You can tell people that they are bad people for eating meat, you can say that they will be judged, shamed, or ostracized. You can tell them that eating meat is bad for their health or bad for the environment. This might even be true. But just because it’s true doesn’t mean it’s motivating. This strategy won’t work all that well. It only causes conflict, because the drives that vote against eating meat will be strenuously opposed by the drives that have always been voting to eat meat to begin with.
But you don’t need to fight your drives. Better to provide a substitute.
No one takes a horse to their dentist appointments anymore. Cars are just vegan carriages; hence “horseless carriage”. We used to kill whales for oil. We don’t do that anymore, and it’s not because people became more compassionate. It’s because whale oil lamps got beat out by better alternatives, like electric lighting. People substitute one good for another when it is either strictly better at satisfying the same need(s), or better in some way — for example, not as good, but much cheaper, or much faster, or much more convenient.
Whale oil lamps burned bright, but with a disagreeable fishy smell. Imagine if in the early days of alternative lighting, they had tried to give whale oil substitutes like kerosene or electric lights the same fishy smell, imagining that this would make it easier to compete with whale oil. No! They just tried to address the need the whale oil was addressing, namely light, without trying to capture any of the incidental features of whale oil. They offered a superior product, or sometimes one that was inferior but cheaper, and that was enough to do the job. We don’t run whale ships off Nantucket any more.
So if you want people to eat less meat, if you want more people to become vegan, you shouldn’t roll out alternative turkey, salami, or anything else. You should provide substitutes, competing superior products, that satisfy the same drives without any reference to the original product. Ta-daaaa.
No one eats yogurt because they have an innate disposition for yogurt. Instead, they eat it because yogurt fulfills some of their needs. If they could get those needs met through a different product, they probably would, especially if the alternative is faster / easier / cheaper.
For the sake of illustration, let’s say that turkey contains just three nutrients, vitamins X, Y, and Z.
If you make an alternative turkey that matches the real thing in taste and texture, but provides none of the same nutrients, then despite the superficial similarity, you’re not even competing in the same product category. It’s like selling cardboard boxes that look like cars but that can’t actually get you to work — however impressive they might look, they don’t meet the need. People will not be inclined to replace their real turkey with your alternative one, at least not without considerable outside motivation. You will be working uphill.
Making a really close match can actually be counterproductive. If an alternative food looks/tastes/smells very similar to an original food, but it doesn’t contain the same nutrition, this is basically the same as gaslighting your governors. And the better the taste match, the more confusing this is.
Think about it from the perspective of the selenium governor. You’re trying to encourage behaviors that keep you in the green zone on your selenium levels, mostly by predicting which foods will lead to more selenium later. But things have recently become really confusing. About half the time you taste turkey flavor and texture, you get more selenium a few hours later. The other half of the time, you encounter turkey flavor and texture, but the selenium never arrives.
By eating alternative proteins that taste like the “real thing”, you end up seriously confusing your governors, with basically no benefit.
We recently tried one of these new vegan boxed eggs. It did have the appearance of scrambled eggs, and it curdled much like scrambled eggs. It even tasted somewhat like scrambled eggs. But the experience of eating it was overall terrible. Not the flavor — the deep sense that this was not truly filling, not a food product. Despite simulating the experience of eggs quite closely, we did not want it. Maybe because it was not truly nutritious.
If you make an alternative turkey that contains vitamins X, Y, and Z, you will at least be providing a real substitute. People will have a natural motivation to eat your alternative turkey. But if you do this, you’re still in direct competition with the original turkey. You’re in its niche, it is an away game for you and a home game for turkey. You have to convince the consumer’s mind that your alt-turkey is worth switching to, and that takes a lot of convincing. People prefer the familiar. Unless the new product is much better in some way, they won’t switch.
If you are trying to replicate turkey, you need to make a matching blob that matches real turkey on all the dimensions people might care about. A product exactly like that is hard to make at all, and forget about doing it while also being cheap, available, and satisfying. This is why it’s an uphill battle, you’re trying to meet turkey exactly.
Those of us who have never tasted tukrey are in ignorance still, our subconscious has no idea that turkey slices would be a great source of vitamin X. We’re not tempted. But people who have tried turkey before have tasted the deli meat of knowledge, and there’s no losing that information once you have it. Vitamin X governor gets what vitamin X governor wants, so these people will always feel called to the best source of vitamin X they’re aware of. You’ll never convince the vitamin X governor that turkey is a bad source of vitamin X; you’ll get more mileage out of giving it a better way to get what it wants!
So instead of shaming, or offering mock meats, the winning strategy might be to just come up with new, original vegan foods that are very good sources of vitamins X, Y, and/or Z. Just make vitamin X drinks, vitamin Y candies, and vitamin Z spread. If you don’t try to mimic turkey, then you’re not in competition with turkey in any way. You don’t need to convince people that it’s better than turkey — you just need to convince them that it’s nutritious and delicious. Why try to copy turkey when you can beat it at its own game?
You don’t need alt-turkey to be all turkey things to all turkey people. As long as people get their needs covered in a way that satisfies, they’ll be happy.
It seems like it would be easier to make a good source of phosphorus, than to make a good source of phosphorus PLUS make it resemble yogurt as much as possible. Alternative proteins that try to mimic existing foods will always be at a disadvantage in terms of quality, taste, and cost, simply because trying to do two things is harder than doing one thing really well. You’ll lose out on a lot of tradeoffs.
If we created new food products that contain all the nutrients that people currently get from meat, except tastier, cheaper, or even just more convenient, people would slowly add these foods to their diet. Over time, these foods would displace turkey and other meats as superior substitutes, just like electric lights replaced gas lamps, or like cell phones eclipsed the telegraph. Without even thinking about it, people will soon be eating much less meat than they did before. And if these new foods are good enough sources of the nutrients we need, then in a generation or two people may not be eating meat at all. After all, meat is a bit of a hassle to produce and to cook. Not like my darling selenium drink.
We see this already in some natural examples. Tofu is much more popular in countries like China, Korea, Japan, where it is simply seen as a food, than it is in the US, where it is treated as a meat substitute. You don’t frame your substitute as being in the same category as your competitors unless you really have to. That’s just basic marketing.
We have a friend whose family is from Cuba. She tells a story about how her grandmother was bemused when avocado toast got really popular in the 2010s. When asked why she found this so strange, her grandmother explained that back in Cuba, the only reason you would put avocado on your toast was if you were so dirt poor you couldn’t afford butter. It was an extremely shameful thing to have to put avocado on your toast, avocados grew on trees in the back yard and were basically free. If you were so very poor as to end up in this situation, you would at least try to hide it.
In Cuba, where avocado was seen as a substitute for butter, it was automatically seen as inferior. But when it appeared in 2010s America in the context of a totally new dish, it was wildly popular. And in terms of food replacement, avocado is a stealth vegan smash hit, way more successful than nearly any other plant-based product. It wasn’t framed that way, but in a practical sense, what did avocado displace? Mostly dairy- and egg-based spreads like butter, cream cheese, and mayonnaise. There may be no other food that has led to such an intense increase in the effective amount of veganism, even if the people switching away from these spreads didn’t see it that way. They just wanted avocado on the merits.
This product space is usually thought of as “alternative proteins”. Which is fine, protein is one thing that everyone needs. But a better perspective might be, “vegan ways to get where you’re going”. And just because some of these targets happen to be bundled together in old-fashioned flesh-and-blood meat, doesn’t mean they need to be bundled together in the same ways in the foods of the future.
Today’s correspondence is from a husband and wife who wish to remain anonymous. This account has been lightly edited for clarity, but what appears below is otherwise the original report as we received it.
The potato diet has mostly been used for weight loss, but it’s also notable for involving mostly one food and being close to nutritionally complete, which means you can use it as an elimination diet to study things like food triggers. We’ve been interested in this idea for a long time, and we find this case study particularly compelling because it’s a rare example of someone doing just that!
Since around 2018, K had been suffering from stomach pain, bloating, gas, and chronic constipation. Chronic constipation worsened after two pregnancies, so K sought medical intervention again in Feb 2025. K was prescribed medication (Linzess) to treat the constipation, which initially improved symptoms but was unreliable and had unpleasant side effects. She had been on that medication for 1 month before starting the potato diet.
Family and friends were bewildered to hear our plan, warning us of muscle loss and blood sugar problems since potatoes are ‘bad’.
Her initial goal was to lose 5-10 pounds from a starting BMI of 23.4 and test out the claims we read online about the diet. K actually joked, “wouldn’t it be funny if this diet fixes my stomach problems?”
We started the diet on 21MAR2025. The first two and a half days were 100% potato for both of us. Morale was suffering by the afternoon of day 3, so we caved and had a potato-heavy dinner with our kids. Afterwards, we agreed to eat only potatoes until dinner so we could still have a normal family meal time. We did make sure potatoes featured heavily in the weekly meal plan.
Within a week, K noticed improved symptoms and regularity without any medication. Initially, she thought she might have a lactose intolerance, so she switched to lactose-free milk and quit the potato diet once we reached the end of our planned testing window.
Back on a regular diet (but still avoiding lactose), K’s symptoms came back worse, with constant stomach aches and bloating. K realized that she had unintentionally been on a low-FODMAP diet while on the potato diet and decided to do intolerance testing.
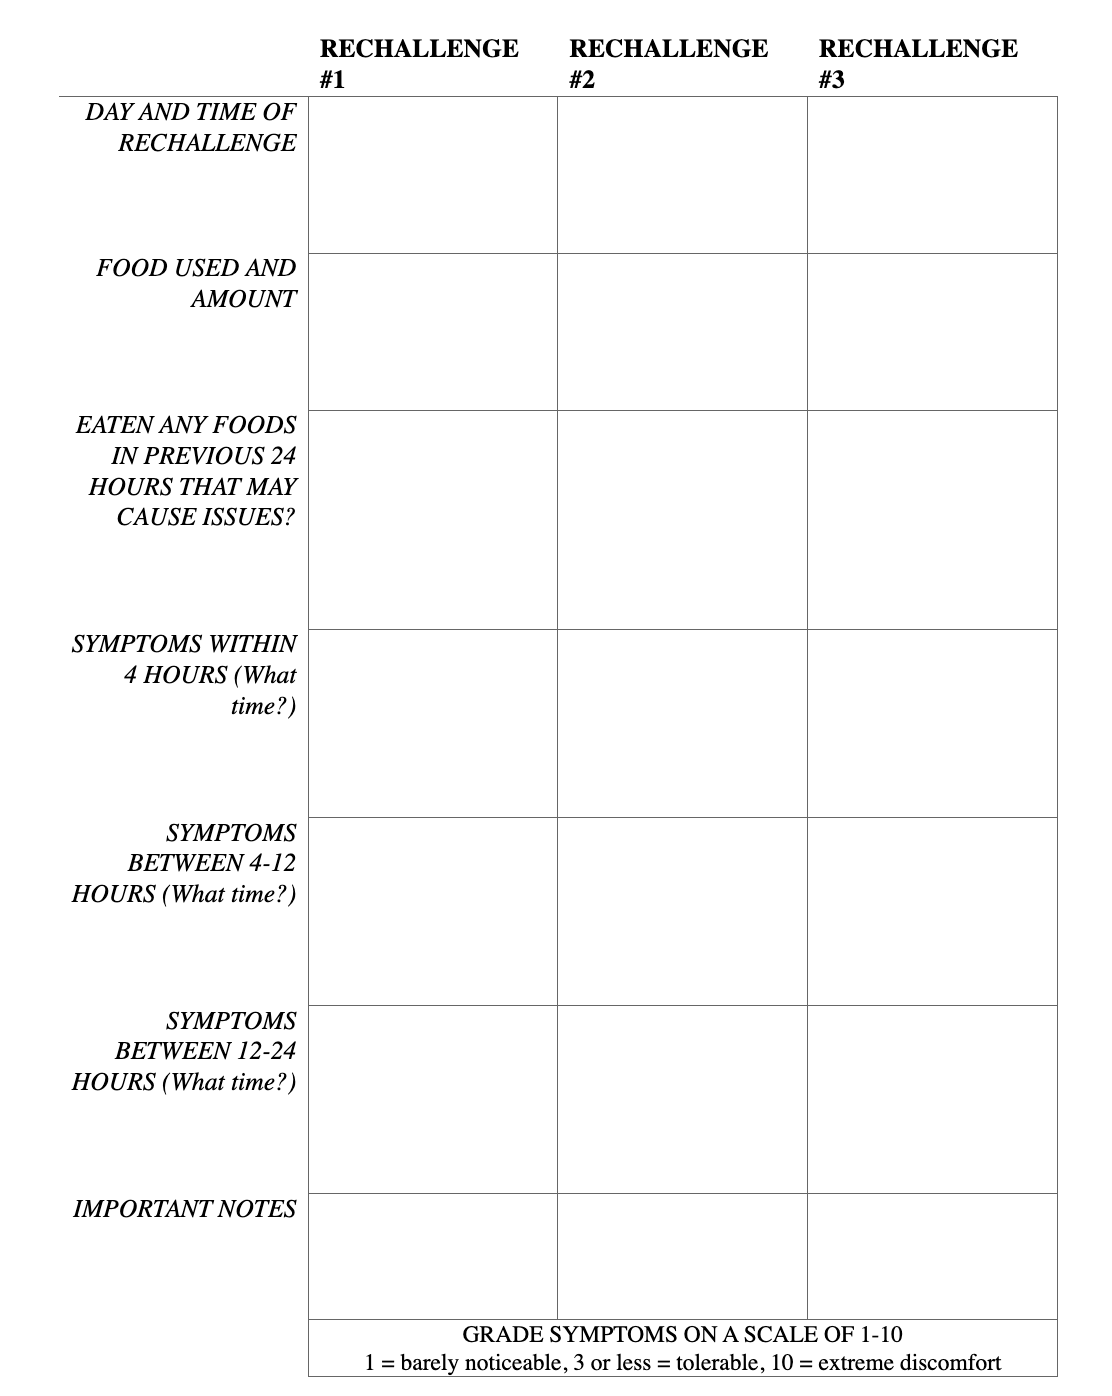
Her methodology for intolerance testing follows:
Ate a high-potato, low FODMAP diet until minimal symptoms were present.
Used NHS FODMAP rechallenging protocol to isolate FODMAP groups (lactose, fructans from wheat, fructans from onions, fructans from garlic, fructans from fruit, fructose, galactooligosaccharides, sorbitol, mannitol, fructose + sorbitol) and identify foods to use for testing each group
Spent 3 days of rechallenging per group: day 1 – small portion, day 2 – med portion, day 3 – large portion of challenge food (ex: 1/4 cup milk, 1/2 cup milk, 1 cup milk)
Kept daily log of symptoms and severity
Allowed 3 days of ‘washout’ after rechallenging
Rechallenged next food group, but did not incorporate challenged foods into diet to avoid multiple FODMAP effects
If symptoms appeared after a food challenge, waited till symptoms subsided and repeated the rechallenge over another 3 days
Incorporating lots of potatoes allowed K to test out food groups while still eating a well-balanced diet. The culprit for K is fructans from wheat, which is why cutting out daily servings of wheat has made her symptoms disappear.
K is finishing FODMAP testing (still a couple more groups to go), but has had reliable relief from all symptoms without any meds. Potatoes are a regular addition to meals these days.
This account has been lightly edited for clarity, but what appears below is otherwise the original report as we received it.
Hi Slimes,
I’ve recently wrapped up a year-long weight loss self-experiment. During this time I lost 50 lbs, most of it on a Potatoes + Dairy version of the potato diet.
This corroborates your recent case studies where Potatoes + Dairy caused just about as much weight loss as the standard potato diet. It certainly worked well for me. I found the diet really enjoyable, my meals were always delicious. I didn’t get tired of the potatoes, they remain one of my favorite foods. And there were a few other interesting findings as well, all described below.
I’m a longtime reader of the blog so this is me sending you my report, which you can publish if you like. Please list me as “Cole” (not my real name). I hope you find it helpful.
Background
First, my demographics. I’m a white male American in my early-mid 30s. I’m about 5 feet 11 inches tall, but I have a large frame. While you should feel free to calculate my BMI at any point, I don’t think it’s a very accurate measure of adiposity in my case.
My first baseline is in mid 2022, when I weighed about 220 lbs. I know this because I tried a version of the potato diet at the time and lost about 10 lbs over about 40 days. I wasn’t seriously concerned with my weight at the time, I was mostly just curious about the potato diet and what it feels like “from the inside”. But this turned out to be relevant later on because it let me know that I’m a potato diet responder.
In mid 2022 I was about to start a new job, one that involved a lot of hard work, stress, and late nights, and also a longer commute / a lot more driving than I am used to (I mention this because I’m sympathetic to the hypothesis that obesity is linked to motor vehicle exposure in some way).
I didn’t notice at first, but after starting this new job, I started to gain weight. Around April 2024, I realized that I weighed almost 250 lbs. This was heavier than I had ever been before, and also quite uncomfortable. For anyone who’s never gained 10+ lbs before, let me tell you, it makes everything in your life just a little more difficult, including things like sleeping, and that sucks.
But this crisis turned into an opportunity: I was about to change jobs again, this time to a job with much more reasonable hours and that required almost no driving. I wanted to lose the weight anyways, so I decided to take this opportunity to run a series of diet experiments and investigate some of the findings you’ve presented on the blog.
The Experiment
I began the study on May 12, 2024, with a starting weight of 247.6 lbs. Per previous potato diet experiments, I weighed myself in my underwear every morning for consistency.
To track my weight and my progress, I used a google sheet based on the one you shared from Krinn’s self-experiment with drinking high doses of potassium. I found her columns tracking 7-day average, personal best, and “ratchet” to be pretty helpful. Would recommend for anyone else trying a weight loss self-experiment.
I didn’t start any new exercise habit, though as I mentioned, I did start a new job and was driving less, I no longer had a weekly commute. So it’s possible that some of the weight loss is from “lifestyle changes” but I don’t think it could be much. According to my phone I’ve averaged about 7,000 steps per day the entire time, while gaining the weight and then while losing it.
The self-experiment can be broken into three main phases: the high-potassium brine phase, the Potatoes + Dairy phase, and a short run-out phase at the end.
For the first 147 days of the experiment, I tried different high-potassium brines, and lost about 12 lbs.
All brines started with a base of two 591 ml blue Gatorades, mixed in a liter bottle with whatever dry electrolytes or other ingredients I was trying. Potassium was always added as KCl in the form of Nu-Salt.
I tried a wide variety of different brine mixtures, using different amounts of KCl as well as NaCl, sodium bicarbonate (baking soda), magnesium malate, iodine (as Lugol’s 2% solution), and glycine powder. But I don’t think these mixtures are worth reporting individually, because I wasn’t able to seriously distinguish between them. Regardless of the mix, I mostly kept losing weight at a very slow pace.
My impression is that magnesium is important, and that brines with added sodium work better than brines without, but I’m the first to admit that the data isn’t strong enough to back this intuition up. The most I can say is that I seemed to lose weight in kind of a sine-wave pattern, which you can see on the graph. These ups and downs roughly lined up with the 14-day cycles where I tried different brine recipes (i.e. I tried most recipes for 2 weeks), but I might have imagined a pattern where in reality there were just natural fluctuations.
While I originally hoped to get around 10,000 mg a day of potassium from my brine, like Krinn did, this wasn’t possible. I found doses above 6,600 mg/day K hard to drink, so I settled at that dosage, reasoning that Krinn lost weight even at lower doses.
In general, the brines made me feel weird. I sometimes became anxious, sometimes fatigued, sometimes got headaches, and sometimes it did weird things to my sense of smell. I did sometimes feel very energetic, and sometimes it seriously reduced my appetite. Some days I ate almost nothing and had almost no appetite. But even with a clear reduction in my appetite, even when I was eating very little, I didn’t lose much weight. (This itself was kind of striking.)
In terms of results, 12 lbs isn’t nothing. But over 147 days, it’s only about 0.08 lbs lost per day. That’s not very much.
I take this as evidence in favor of the hypothesis that high doses of potassium are part of why the potato diet causes weight loss. Even on only 6,600 mg/day K, I experienced many of the effects of the potato diet (reduced appetite, weird anxiety) and I did lose some weight, though not much.
But I also think my results suggest that potassium may not be enough, and that the “potato weight loss effect” really comes from something like high doses of potassium plus something else in potatoes / with potatoes—maybe high doses of magnesium, maybe sufficient sodium to balance the potassium, etc.
Potatoes & Dairy
The brine seemed to work, but my rate of weight loss was really slow. It seemed like it was time to try the potato diet. In addition to hopefully losing more weight, I saw two benefits.
First, I could compare the effect of the brine directly to the effect of the potato diet, to see if I was already losing weight as fast as I could, or if there was something missing from the formula.
Second, I could test out the success of Potatoes + Dairy. The original potato diet was very strict, but by this point you had already reported a few case studies where people had lost a lot of weight on versions of the potato diet where they also ate various kinds of dairy.
My version of Potatoes + Dairy was decadent. Every meal was potatoes, but I always added as much butter, cheese, and sour cream as I wanted, which was usually a lot. For a while I made a lot of scalloped potatoes, but eventually I got lazy and from that point on I mostly ate baked potatoes or turned old baked potatoes into homefries. I didn’t get tired of this because butter is great.
When I didn’t have time to prepare potatoes, I would have cheese, milk, or ice cream as a snack. Yes, I ate as much ice cream as I wanted, and still lost weight (which is in line with the literature).
In case anyone wants to replicate my approach, my mainstays were:
Kerrygold salted butter, or occasionally Cabot salted butter
Cabot sour cream
Cabot cheeses, especially Cabot Seriously Sharp Cheddar Cheese
Ben & Jerry’s Ice Cream, most often Peanut Butter Cup
Despite this decadence, I lost about 40 lbs more over 187 days.
Looking closer, the weight loss really happened over two spans, one before the 2024 December holidays, and one after. I first lost about 16 lbs over 75 days, gained about 8 of that back during late December and January, then lost about 28 lbs over the next 86 days. At the point of greatest descent (early March 2025), I lost 10 lbs in two weeks.
I wasn’t very strict and I did cheat pretty often. My notes mention times and places that I had pizza, candy, or sometimes burritos. Sometimes I had cheat meals where I would go out to lunch or get hot pot with friends. Sometimes I went on dates, where I ate normal food. This mostly didn’t make a difference as long as I also kept up with the potatoes.
You might think that potatoes are a neutral food, and they just help you survive while your body returns to normal, or something. But my sense is that potatoes actively cause the weight loss. On days where I didn’t prepare potatoes, and mostly just snacked on ice cream and cheese, I didn’t seem to gain much weight back, but I didn’t lose it, either.
This leads to another counterintuitive recommendation: the potato diet can really reduce your appetite, sometimes to the point where you don’t want to eat. But I think that you actually lose more weight on days where you eat potatoes than on days where you don’t eat at all. So if your goal is to lose weight, don’t assume that not eating is a good strategy—eat your taters.
I’m pretty confident that the potato diet was causing the weight loss, in part because I started losing weight right when I switched from brine to potatoes. Also, when I cheated for more than just a meal or two, it was obvious on the graph. Halloween, Thanksgiving week, and the December Holidays stand out in particular. Here’s version of the graph with those days singled out:
My holiday weight re-gain continued well into January because I was travelling and helping to organize some professional conferences, and I wasn’t able to keep up with the potatoes very well. As soon as I got back on potatoes around Jan 20, my weight started dropping again, this time faster than before.
I was pretty surprised when I blew past not only 220 lbs, but 210 lbs. I had thought that 220-210 might be the healthy range for me, and expected the diet to stall out there. But instead I blew past those milestones. Turns out that 220 lbs is at least 20 lbs overweight for me. I had no idea, because I felt pretty healthy at 220, but I guess I had forgotten what it was like to be a normal weight.
Run-Out
I first dropped below 200 lbs on March 20, 2025. Soon after that, my weight started to plateau, never falling much below 200 lbs but showing no signs of increasing.
I also noticed that I suddently started craving foods that weren’t potatoes, something that I hadn’t experienced on the previous 170 days. First I started craving fruit, and the next day, I started seriously craving Mexican food. Soon I was craving broccoli and chocolate.
This made me think that I might have reached a plateau, possibly my “natural” weight. According to BMI I am still “overweight” at < 200 lbs, and I am definitely not “lean”. But I do feel trim, and the girl I’ve been dating keeps putting her hands on my chest and talking about how good I look, so I’ll take this as some evidence that “just under 200 lbs” is a reasonable weight for me.
Because I already seemed to have hit a plateau, I decided to spend the last 31 days on a run-out period to see what would happen as I eased off the diet. During this time I still ate potatoes pretty often, but I started bringing in other foods, and I went whole days without eating any potatoes at all. Somewhat surprisingly, I didn’t gain back the weight as I relaxed the diet.
I do kind of wonder if my weight would have fallen even further if I had remained on Potatoes + Dairy, but the fact that I was developing cravings for other food suggests to me that I had encountered a real state change. It might have been possible to force my weight lower, but the magic of the potato diet is that the weight loss happens without any force. If you start forcing things, you’re back in the territory of restriction diets.
I officially ended the experiment on May 12, 2025, 365 days after I started, weighing 198.8 lbs. This was down from an original high of 247.6 lbs, and my all-time low was 194.4 lbs on April 22nd.
I’ll probably keep eating a diet high in potatoes, since even after several months, I still love them very much (and you wouldn’t believe how much I’ve saved in groceries). But I seem to have reached a plateau and a healthy weight, and also, while potatoes are powerful, they come at a terrible cost (mostly joking but read on).
A Few Things People Should Know
Hair Loss
When you lose a lot of weight very quickly, you often lose some hair. I’d never heard of this before but apparently it’s common knowledge among women. Who knew? It’s called “telogen effluvium” and it definitely happened to me. In early January, after my first period of intense Potato + Dairy weight loss, I noticed my hair was seriously thinning on top and in the back.
The good news is that hair lost in this way usually grows back on its own, though it can take a couple of months. That seems to be happening for me too. My hair is clearly thicker now than it was in January. And it’s pretty weird: looking at my scalp, I can see short hairs and even some very short hairs mixed in among the long ones. While my head hasn’t returned to normal yet, the hair is clearly growing back.
So in the end this doesn’t seem to be a serious concern. And it’s not specific to the potato diet, this just happens when you lose weight really fast. Even so, anyone who wants to copy my results should be aware that this might happen, but also that it’s usually temporary.
Emotional Effects
Some people get really intense negative feelings of fear or anxiety while on the potato diet. This also happened to me.
To anyone who wants to do this diet, or is considering it after the benefits I described above: I encourage you to do it, but please be extra cautious that your mental state might be altered and that you are not necessarily in your right mind. The feelings you experience during this diet may not be how you actually feel.
Like I said above, potato diet is fucking weird. I mention this and the above because towards the end of the third week, I found myself crying every day. I was having actual meltdowns… five days in a row.
I am not talking “oh I am so sad, let a single tear roll down my cheek while I stare out of a window on a rainy day” levels of gloom and general depression. I am talking “at one point I couldn’t fold some of my laundry in a way that was acceptable to me, and this made me think I should kill myself, so I started crying”.
Is this a really dark to drop in the middle of a sort of lighthearted post about potato diet? Yes. I am sorry if you are uncomfortable reading it. Personally, I think I have a responsibility to talk about it, because the mentally weird aspect of this diet cannot be stressed enough.
My experience was somewhat different from Birb’s, manifesting more as a sense of overwhelming dread or doom than as a feeling of depression. And unlike Birb, I didn’t start to seriously feel this way until several months into the diet. But I definitely recognize her description.
As far as I could tell, these feelings were somewhat related to how quickly I was losing weight, though maybe not in the way you expect. The faster I was losing weight, the more of an overwhelming sense of doom I felt. Hooray. That said, it wasn’t a very strong relationship. I still felt the doom during times when I was cheating on the diet, and even when I was losing a lot of weight, I sometimes felt ok.
I suspect that these feelings may have something to do with how the body uses epinephrine and norepinephrine to release energy from adipose tissue, which would explain why you feel so crazy anxious and such intense dread when actively losing the most weight, but I’m not a doctor™.
The feelings might also be the result of a vitamin or mineral deficiency. We know that the potato diet is deficient in Vitamin A, and while I wasn’t rigorous about testing this, I found that eating some sweet potatoes (high in vitamin A) often made me feel better. I also found during the run-out period that eating mushrooms (selenium?), broccoli, and spinach (iron?) maybe helped as well. So if you’re having a bad emotional time on the potato diet, think about trying sweet potatoes or one of these other foods.
It’s interesting to me that these feelings of doom got stronger the further along I got in my weight loss. Maybe this is just because I was losing weight faster over time. But another (kind of crazy) possibility is that something is stored in our fat reserves and as I dug deeper into them, I released more of it. Or in general that something is flushed out from somewhere? I don’t know if I believe this but I wanted to mention it.
That’s just my speculation. It could also have been ordinary anxiety from other causes that happened to line up with the weight loss. I’ve got some personal things going on in my life right now, maybe the anxiety is coming from those. Plus, a few friends have recently had similar feelings of dread, and they’re not losing extreme amounts of weight on a highly unusual diet.
Conclusions
My results make me very confident that Potatoes + Dairy works. The potato diet makes you lose weight, and that still works even if you add dairy, including butter and ice cream, no matter if you’re eating as much of it as you want.
While my data can’t speak to how well Potatoes + Dairy will work for anyone else, I hope this ends the idea that the potato diet works because it’s unpalatable. I lost 50 lbs and every meal was delicious. I also hope this finishes the idea that the potato diet works because it’s a “mono diet”. You can’t reasonably call something a mono diet when it includes potatoes, sour cream, and ice cream with tiny peanut butter cups.
I also think this is some evidence for the potassium hypothesis. I lost weight when I was taking high doses of potassium, though not nearly as much as on the potato diet. Maybe this was because I was taking too small of a dose, and a higher dose would have caused a similar amount of weight loss as what I eventually saw on the potato diet.
But I suspect this is because the potato effect doesn’t come from potassium alone, but from an interaction between potassium and something else, possibly other electrolytes like sodium and magnesium.
If you could find the right mixture, maybe you could reproduce the potato effect in a brine. But if so, I wasn’t able to find it. For now, the state of the art is Potatoes + Dairy.
All ten foods were found to contain levels of lithium above the limit of detection, but some foods contained a lot more than others — ground beef contained up to 5.8 mg/kg lithium, corn syrup up to 8.1 mg/kg lithium, and goji berries up to 14.8 mg/kg lithium.
But of the ten foods we looked at, eggs appeared to contain the most, up to 15.8 mg/kg lithium when analyzed with ICP-OES:
The Results of the Previous Study
So for our next study, we decided to look at more eggs.
The first reason to look at more eggs was to confirm the results of our first study, and confirm that these numbers could be replicated.
The second reason to look at more eggs was to start getting a better sense of the diversity of results. Where the first study gave us a small amount of breadth by comparing several foods, the second study would give us a small amount of depth by comparing several eggs.
The third reason to look at more eggs was that we might be able to find an outlier, a sample of food that contains far more than 15 mg/kg lithium. Eggs containing 15 mg/kg lithium are somewhat of a public health concern; how much more concerning would it be to find eggs that contain 50 mg/kg, or 100 mg/kg.
(There are reports of such outliers in other foods, in particular from work by Sievers & Cannon in the early 1970s, who reported an “extraordinary” lithium content of 1,120 mg/kg in wolfberries from the Gila River Valley.)
Special thanks to all the funders, Sarah C. Jantzi at the Plasma Chemistry Laboratory at the Center for Applied Isotope Studies UGA for analytical support, and to Whylome for providing general support.
The technical report is here, the raw data are here, and the analysis script is here. Those documents give all the technical details. For a more narrative look, read on.
2. General Methods
2.1 Eggs
First, we collected a sample of eggs from grocery stores around America.
We started by purchasing several cartons of eggs from grocery stores near Boulder, Colorado. We bought several different brands, and tried to get a fair mix of eggs, both white and brown, conventional and organic.
However, this was still not enough diversity for our purposes. So in the meantime, we asked friends from around the country to mail us cartons of eggs.
Fun fact: Eggs don’t actually require refrigeration, Americans are basically the only weirdos who even keep them in the fridge. Especially when it’s mild outside, they keep for many weeks at room temperature. So shipping these eggs was relatively easy — really it’s just about packaging them with lots of padding so they don’t break. Most of the eggs arrived intact and we’re very grateful for the great care in packaging and shipping taken by our egg donors (ha).
The list of eggs is summarized in greater detail in the technical report.
From most cartons, we took two samples of 4 eggs. This gave us two measurements per carton, which should give us some sense of how much variation there is within an individual carton.
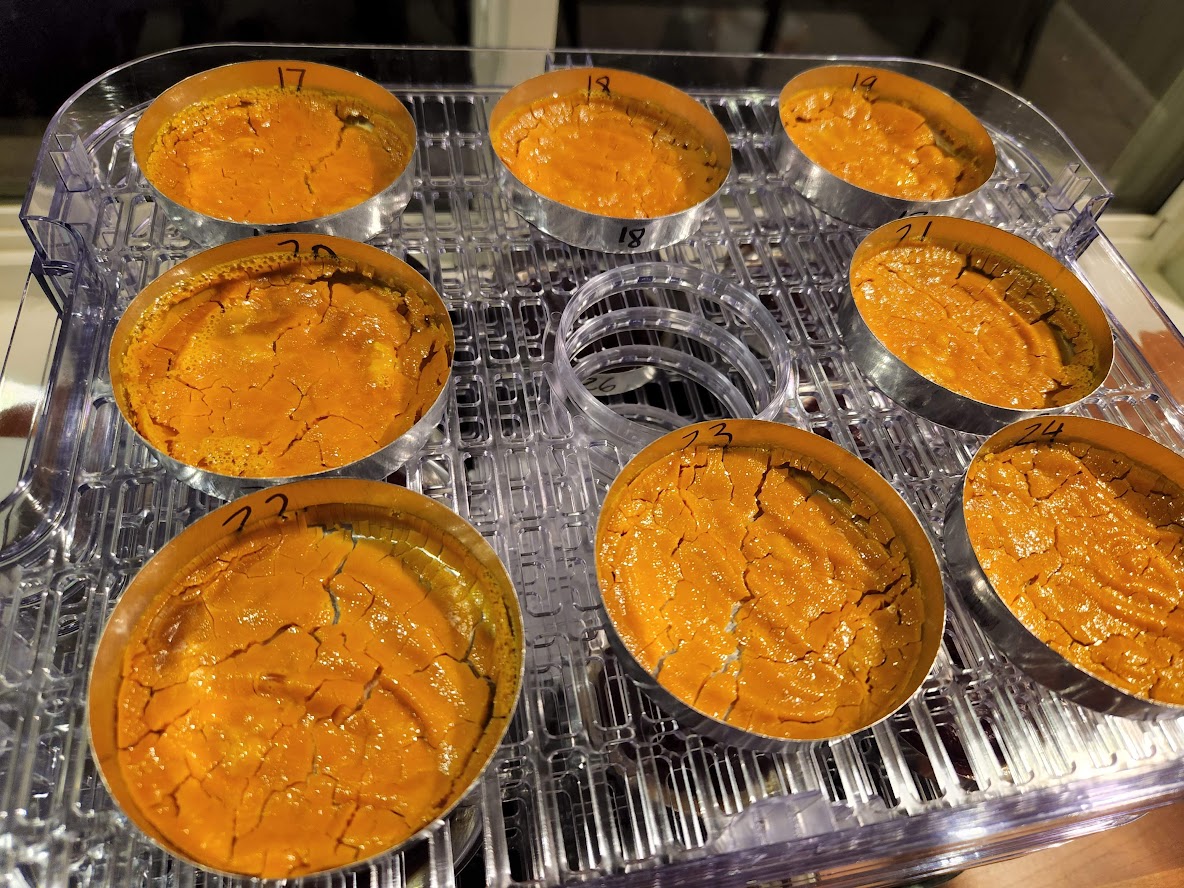
Each sample was homogenized/blended with a stick blender for 1 minute to obtain a smooth, merengue-like texture. The blended mixture was then transferred to drying dishes and dried in a consumer-grade food dehydrating oven.
We also pulled out one brand for more testing, to assess individual egg-to-egg variability. From the carton of Kroger Grade AA, we took two samples of 4 eggs as normal. Then we took three more samples of individual eggs. The single eggs were blended and dried just as the larger 4-egg samples were.
When all samples were dried, they were crumbled into a powder, weighed, put into polypropylene tubes, and shipped off to the lab for further processing.
2.2 Digestion
Food samples need to be digested before they can be analyzed by ICP-OES. Based on our results from the previous study, we used a “dry ashing” digestion approach, where samples are burned at high temperatures, and the ash is dissolved in nitric acid.
Incineration causes organic compounds to exit the sample as CO2 gas, but elements like sodium, potassium, magnesium, and lithium are non-volatile and remain behind in the ash.
2.3 Analysis
ICP-OES generates a tiny cloud of high-energy plasma, the “inductively-coupled plasma” of the acronym, and injects a cloud of liquid droplets into that plasma (hence the need for digestion). ICP-OES then examines the light that is emitted by the plasma as the liquid sample hits it.
In addition to lithium, we also analyzed all samples for sodium. Sodium is chemically similar to lithium, and most foods contain quite a lot, which nearly guarantees a good signal in every sample.
This makes sodium a useful point of comparison. At every step, we can compare the lithium results to the sodium results, to see if general patterns of findings match between the two elements.
3. Results
All samples were analyzed as one project, but for clarity of understanding, we’re going to report this project in two parts, as two studies.
In Study One, we look at the main body of results — eggs analyzed as four-egg batches from a single carton.
In Study Two, we look only at the Kroger Grade AA eggs — analyzed as two four-egg batches and three one-egg batches, to assess individual egg-to-egg variability.
3.1 Study One
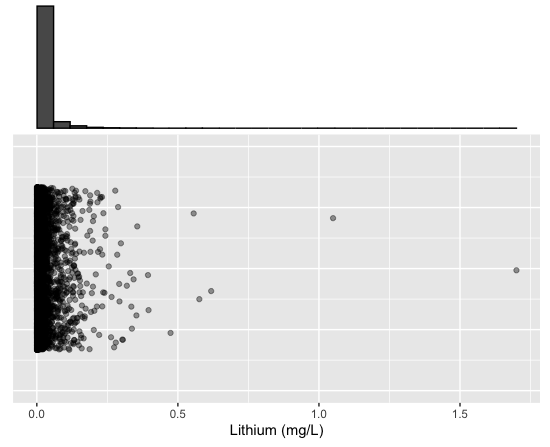
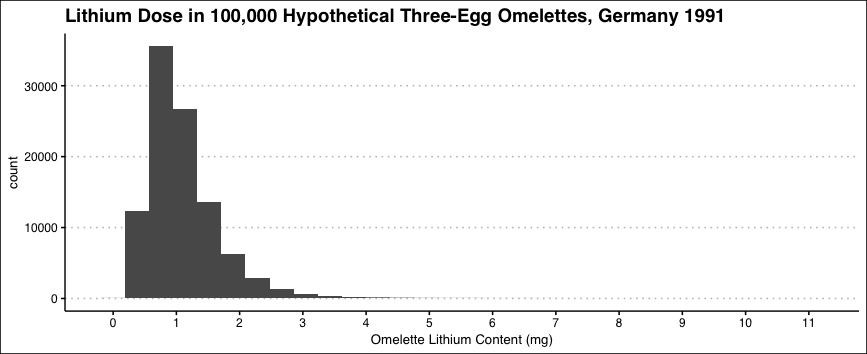
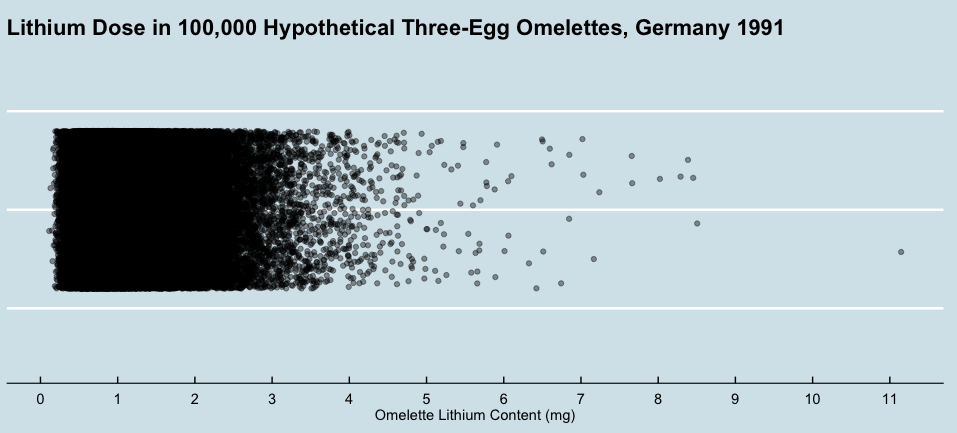
For starters, here is a histogram of the distribution of lithium measurements in our egg samples:
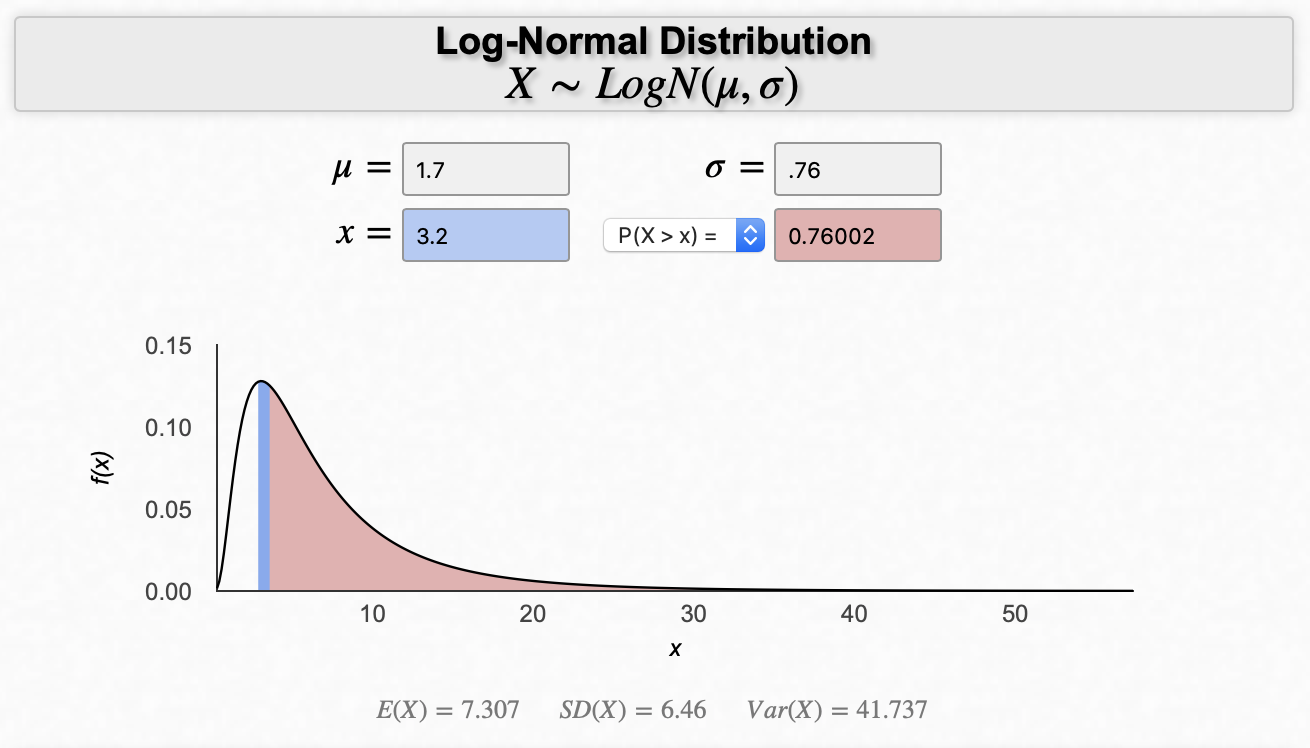
We’ve previously speculated that the distribution of lithium in food would be lognormal, as it is in drinking water, and indeed this looks very lognormal.
For comparison, here’s the distribution of sodium:
Note that the x-axis is extremely different between the two plots! This is not surprising; eggs contain a lot more sodium than lithium.
For a sanity check, the USDA says that “Egg, whole, raw, fresh” contains 142 mg sodium per 100 g egg. Converted, that’s 1,420 mg/kg, which approximately matches these results, though the mean in this sample is much lower at only 987.3 mg/kg. The median is 963.0 mg/kg, and the standard deviation is 288.8 all told.
Slightly surprising are those three samples that (according to the analysis) contain almost no sodium — their values in the data are 7.6 mg/kg, 1.5 mg/kg, and one measurement below the limit of quantification.
3.1.1 By Batch
More interesting is the breakdown by batch.
As a reminder: each carton of eggs (aside from the Trader Joe’s eggs, due to an oversight) was used to create two batches of four eggs each. Then, each batch was tested in triplicate, so each carton was tested six times. Here, each bar indicates a batch. Each batch has three dots, representing each of the three results from the tests done in triplicate:
The main finding is that lithium was detectable in nearly all eggs. This suggests that ICP-OES is more than sensitive enough for this type of work, and that in general, eggs contain appreciable levels of lithium.
Most egg samples contained between 0.5 and 5 mg/kg. The few readings of “zero” in the plot actually mean “less than about 0.04 mg/kg moist weight”.
Hypothetically speaking, the batches were all well-mixed. Eggs were blended with a stick blender for a full minute (to a very creamy consistency, think meringue), then dried and crumbled, and the dried bits mixed up. So it’s quite surprising that after all that, there’s so much variance within the batches.
Some of the batches show close agreement between different samples from the same batch. Both Simple Truth AA batches have only a very small amount of variation. Whole Foods Batch 2 is bang on every time.
But other batches show a lot of variation. Batch 1 of Organic Valley and Batch 1 of Eggland’s best both contain one sample that is a huge outlier. You might dismiss these as some kind of one-off analysis error. But some of these cases, like both CostCo batches or the first Land-O-Lakes batch, show disagreement between all three samples.
We wondered if this might mean that these batches were imperfectly blended. This would be quite surprising, given the lengths we went to to ensure that the batches were well-mixed.
If the batches were perfectly blended, then all three samples should contain identical levels of lithium. The only differences between the results would then be errors in the analysis, not real differences in the samples. But if errors were the only source of noise, you would expect to see similar levels of variation in every batch.
Two explanations seem likely.
First, lithium is very strange. In our last study, we saw that sometimes you get very different numbers for the exact same piece of food. Maybe the differences between different samples from the same batch comes from the fact that it’s hard to get accurate measurements for lithium levels in food.
Second, perhaps eggs are just goopy. It’s possible that despite our best efforts to completely blend the samples, they are still less than perfectly mixed, so some samples from the same batch contain more or less lithium than others.
We can test these explanations by comparing the lithium results to the sodium results for the same set of batches and samples. If the variance is the result of a problem with lithium detection, then the sodium results should be much more consistent within batches. But if the variation comes from the eggs being imperfectly blended, then we should see similar variation in the sodium results as in the lithium results.
3.1.2 Sodium
Here are the sodium results:
Sure enough, there is a lot of variation between sodium levels, even within single batches. This suggests that the variation we saw in the lithium results is not the result of something weird about lithium. It’s probably something general about the samples or the analysis.
Some of the variation in sodium lines up with the lithium results. The Whole Foods batches show great precision for both lithium and sodium, suggesting that they are especially well-blended or homogenous or something. But there is also some disagreement. For lithium, Organic Valley Batch 2 was much more precise than Organic Valley Batch 1. For sodium, it is the opposite.
Sodium does show something unique — three very clear outliers with readings of almost exactly zero sodium (specifically 7.6 mg/kg, 1.5 mg/kg, and one reading below the limit of quantification).
These look like errors of the analysis rather than real measurements. All three are outliers from the sodium data in general, more than three standard deviations below the mean. All three are from different batches and starkly disagree with the other samples from that batch. And we have strong external reasons to expect that any bit of egg will contain more than zero sodium.
In addition, we notice that these three cases with exceptionally low sodium levels are the exact same three cases that registered as below the limit of quantification for lithium. This suggests that none of these readings are real, that there were three samples where something went wrong, and the analysis for some reason registered hugely low levels of sodium and no lithium. If true, that means that all real measurements detected lithium above the limit of quantification.
The other variables we considered, like location, egg color, and whether or not the eggs were organic, didn’t seem to matter. Maybe differences would become apparent with a larger sample size, but they’re not apparent in these data.
3.2 Study Two
You might expect that hens from the same farm, eating the same feed, would all have roughly similar amounts of lithium in their eggs. For the same reason, it seems likely that any two eggs in the same carton wouldn’t be all that different, and would contain similar amounts of lithium.
All the above seems likely, but we actually have no evidence. It’s an assumption, and exactly the kind of assumption that could really confuse us if we assume wrong. It’s worthwhile to check.
Certainly the results from Study One call the assumption into question. A thoroughly blended mix of four eggs seems like it should have homogenous levels of lithium throughout. But empirically, that isn’t what we saw. We saw a lot of variation. Maybe the variation within those 4-egg batches comes from differences between the four eggs.
To test this, we did another round of analysis, focusing on a single carton of Kroger eggs. As before, of the 12 eggs in the dozen we took two groups of four to create two four-egg batches.
In addition, we took three of the remaining four eggs, and used them to create three one-egg batches, mixing and sampling just that single egg. The one-egg batches each consisted of a single egg from this carton, blended well. The one-egg batches were also tested in triplicate, i.e. three samples from the same egg.
Here are the results:
These four-egg batches look much like the four-egg batches tested in Study One. They show a lot of variation between the samples tested in triplicate.
The single-egg batches, on the other hand, did indeed have lower variance than the 4-egg batches. There was much closer agreement between different samples from the same eggs, than samples from different eggs. Certainly we see a difference between the egg used for Batch 3, which all samples indicate contains about 1 mg/kg lithium, and the egg used for Batch 4, which all samples indicate contains about 5 mg/kg lithium
This suggests that there really may be appreciable egg-to-egg variation. This could be the result of other factors, including simple randomness, but the tightness of the single-egg analyses is suggestive. And the fact that the variance seems much lower in single-egg batches implies that the mixed four-egg batches are imperfectly blended.
The sodium results for these batches seem to confirm this, with greater variation in sodium in the four-egg batches than in the one-egg batches:
Again, this suggests that the patterns we observe in the lithium data are the result of actual results in the world, or the analysis in general, rather than some artifact of the lithium analysis in particular.
4. Discussion
Nearly all egg samples contained detectable levels of lithium, and around 60% of samples contained more than 1 mg/kg lithium (fresh weight). These results appear to confirm that eggs generally contain lithium.
If you accept the argument that the three samples with conspicuously low sodium readings are the result of a failure of analysis, then all egg samples contained detectable levels of lithium.
In terms of diversity of results, samples varied from as much as 15 mg/kg Li+ to as little as less than 1 mg/kg Li+. Variation did not seem to be related to the geographic purchase origin of the eggs. Nor were there any obvious differences between organic and non-organic, or white and brown eggs. This suggests that these are not major sources of variation.
However, we did see evidence of a lot of variation in lithium levels between individual eggs, even between individual eggs from the same carton.
While there was a lot of variation between samples, some samples showed a great deal of consistency, especially samples from single eggs. This suggests that dry ashing followed by ICP-OES has high precision when analyzing food samples for lithium. Though these results do not speak to whether or not this analytical method is accurate for such samples, they do suggest that these are real measurements and not merely the result of noise or analytical errors.
One of our hopes for this study was to find an egg that contained more than 15 mg/kg lithium, that we could subject to other, less sensitive analytical methods. This would let us get a sense of accuracy by triangulation, comparing the results of different methods when analyzing samples of the same egg.
We did in fact find eggs that contain such high concentrations. Above we reported the lithium concentrations in fresh weight, because those are the numbers that are relevant if you are eating eggs. But in terms of analysis thresholds, the numbers that matter are the dry weight. For dry weight, some of these egg samples contain as much as 60 mg/kg lithium. That’s more than enough to be above the sensitivity of a technique like AAS.
As we are quite interested in trying to confirm the accuracy of lithium analyses in food, one next step will be to replicate these analyses using other analytical techniques like AAS.
There are lots of different methods you can use to estimate the lithium in a sample of food. This usually involves some kind of chemical liquefication (“digestion” in the parlance) paired with a tool for elemental analysis. You need digestion to analyze food samples, because some analysis techniques can only be performed on liquids, and as you may know, many foods are solids or gels. Mmmmm, gels. *HOMER SIMPSON NOISES*
Most modern studies use ICP-MS for analysis of metals like lithium, combined with digestion by nitric acid (HNO3). ICP-MS is preferred because it can analyze many elements at once and it is considered to be especially sensitive. HNO3 is preferred because it is fast and cheap compared to alternatives.
Studies that use HNO3 digestion with ICP-MS tend to find no more than trace levels of lithium in their food samples — only about 0.1 mg/kg lithium in most foods, and no foods above 0.5 mg/kg. Examples of these studies include Ysart et al. (1999), which surveyed 30 elements in a wide variety of UK foods and found no more than 0.06 mg/kg lithium in any food; Saribal (2019), which measured the levels of 19 elements in cow’s milk samples from supermarkets in Istanbul, and found less than 0.04 mg/L lithium in all samples; and Noël et al (2006) which surveyed the levels of 9 elements in “1319 samples of foods typically consumed by the French population”, finding 0.154 mg/kg or less lithium in all foods (though they reported slightly higher amounts in water).
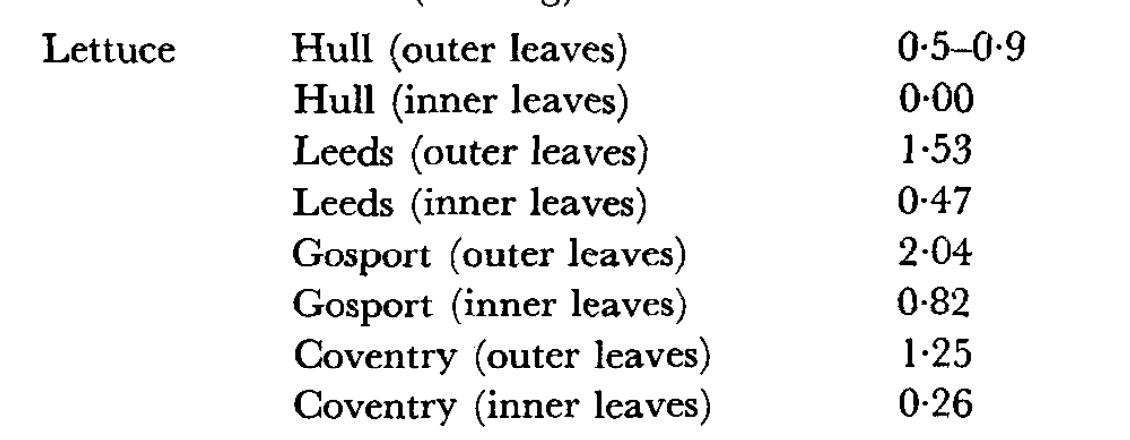
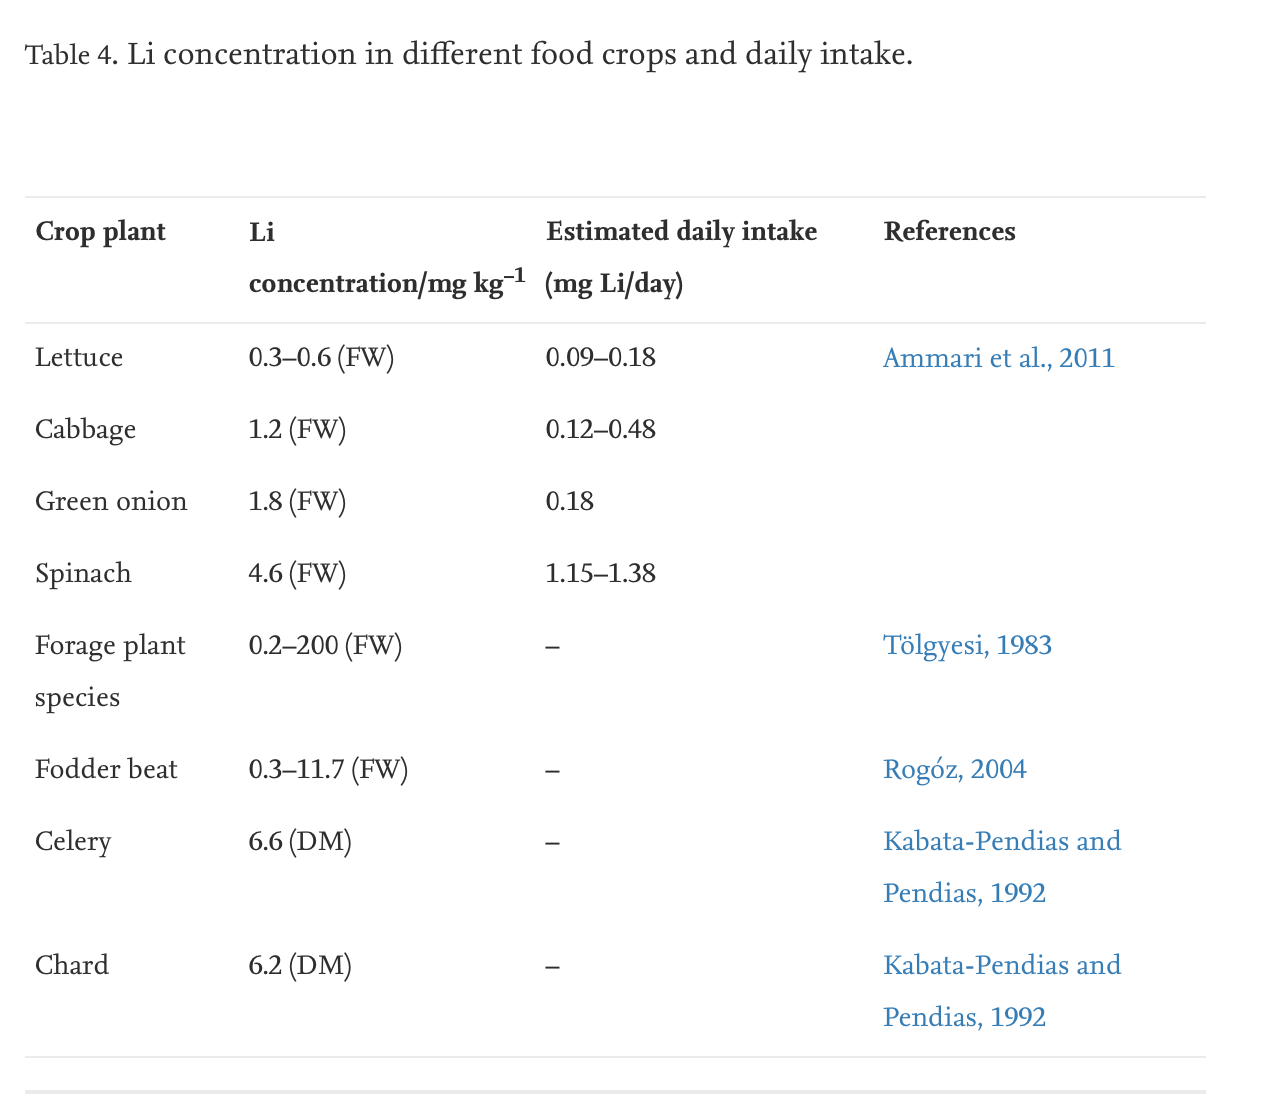
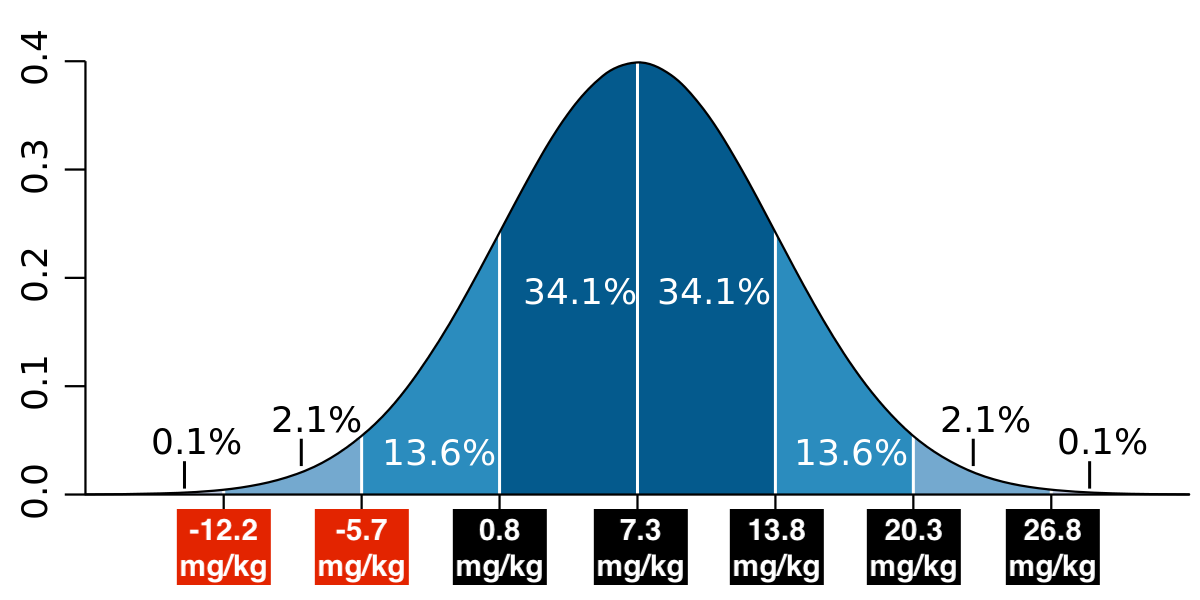
But as we’ve reviewed in previous posts, the literature as a whole is split. Studies that use other analysis techniques like ICP-OES or AAS, and/or use different acids like H2SO4 or HCl for their digestion, often find more than 1 mg/kg in various foods, with some foods breaking 10 mg/kg. Examples include studies like Ammari et al. (2011), which found 4.6 mg/kg lithium in spinach grown in the Jordan Valley; Anke, Arnhold, Schäfer, and Müller (1995) which found more than 1 mg/kg lithium in many German foods, including 7.3 mg/kg lithium in eggs; and in particular we want to mention again Sievers & Cannon (1973), which found up to 1,120 mg/kg lithium in wolfberries (a type of goji berry) growing in the Gila River Valley.
1.1 State of the Art Isn’t Great
From the existing literature alone, it’s hard to say what concentrations are present in today’s food. Different papers give very different answers, and often seem to contradict each other. It’s hard to get oriented.
We don’t want to give the impression that there’s a consensus to be boldly defied, or that there are two opposing camps. It’s more like this: hardly anyone has even tried to do a decent job of even looking for lithium in food or taking it seriously, and we are here to smack them and tell them to pay attention to something that has been ignored. This is not a well-studied question. It is a subject that has been the topic of few papers and even fewer authors. It is a small literature and very confused.
Hardly anyone can even be bothered to look for lithium. When it does appear in a study, half the time it feels just tacked on to a list of things that the authors actually care about (like in the France study above). Many of these studies are really looking for toxic metals like lead and cadmium, which are obviously important things to check for in our food. But this makes lithium an afterthought. And when authors don’t care, fundamental issues of analysis can easily be overlooked. The assumption seems to be that you can just throw everything into the same machine and get a good measurement for every element without any extra effort. But as we’ll see in a moment, that may not be the case.
As we hinted at above, the analytical methods may be the root of the problem. Studies that use HNO3 digestion with ICP-MS report minor trace levels of lithium in food. Studies that use other forms of digestion or other analytical techniques report much higher levels, often above 1 mg/kg. This makes us think that the different analyses are the reason why these papers get such different estimates. However, we couldn’t find any head-to-head comparisons in the literature, and it isn’t clear if the problem lies with ICP-MS, HNO3 digestion, or both.
1.2 Effects of Lithium
This is more than a purely academic question: lithium is psychoactive, and exposure through our food could have real health effects.
Clinical doses, which usually range between 56 mg and 336 mg elemental lithium per day, act as a mood stabilizer and sedative. These doses also cause all kinds of nonspecific adverse effects, including confusion, constipation, headache, nausea, weakness, and dry mouth.
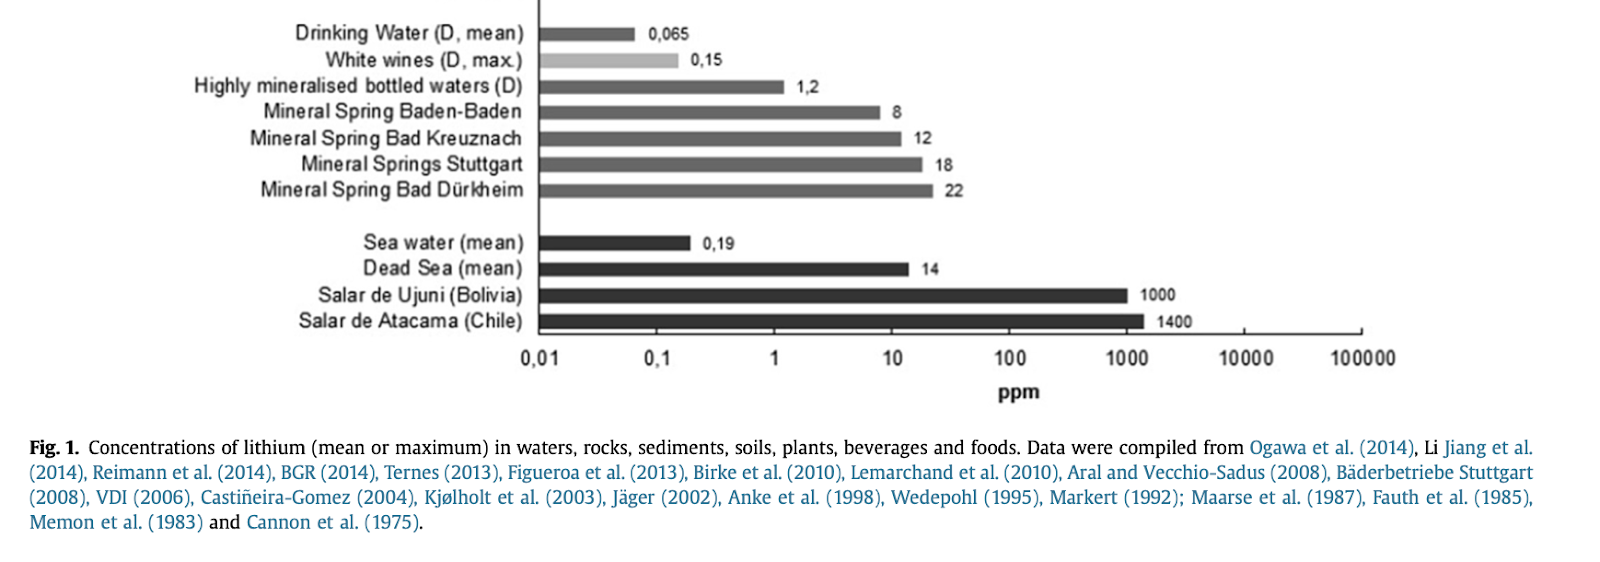
Even the trace amounts of lithium in our drinking water (< 1 mg/L) may have some effects. A epidemiological literature with roots dating back to the 1970s (meta-analysis, meta-analysis, meta-analysis) suggests that long-term exposure to trace levels of lithium in drinking water decreases crime, reduces suicide rates, reduces rates of dementia, and decreases mental hospital admissions, and this is supported by at least one RCT. The EPA is even concerned about exposure to levels as low as 0.01 mg/L and 0.06 mg/L, describing them as “concentrations of lithium that could present a potential human-health risk”, though they don’t say why.
1.3 Measurement
Trusting your methods is the basis of all empirical work. The disagreement in the existing literature is important because we don’t have a good sense of how much lithium is in our food. It’s concerning because it suggests we might not know how to measure lithium in our food even when we try! This looks like a crisis of methods either way.
High enough levels of lithium in our foods would be dangerous, so we should know how to take a piece of food and figure out how much lithium is inside it. But there isn’t much research on this topic, and it looks like different methods may give very different answers — if this is true, then we don’t know how to accurately test foods for lithium. And it’s likely that lithium levels in the environment are increasing due to both lithium production and fossil fuel prospecting — see Appendix B for more.
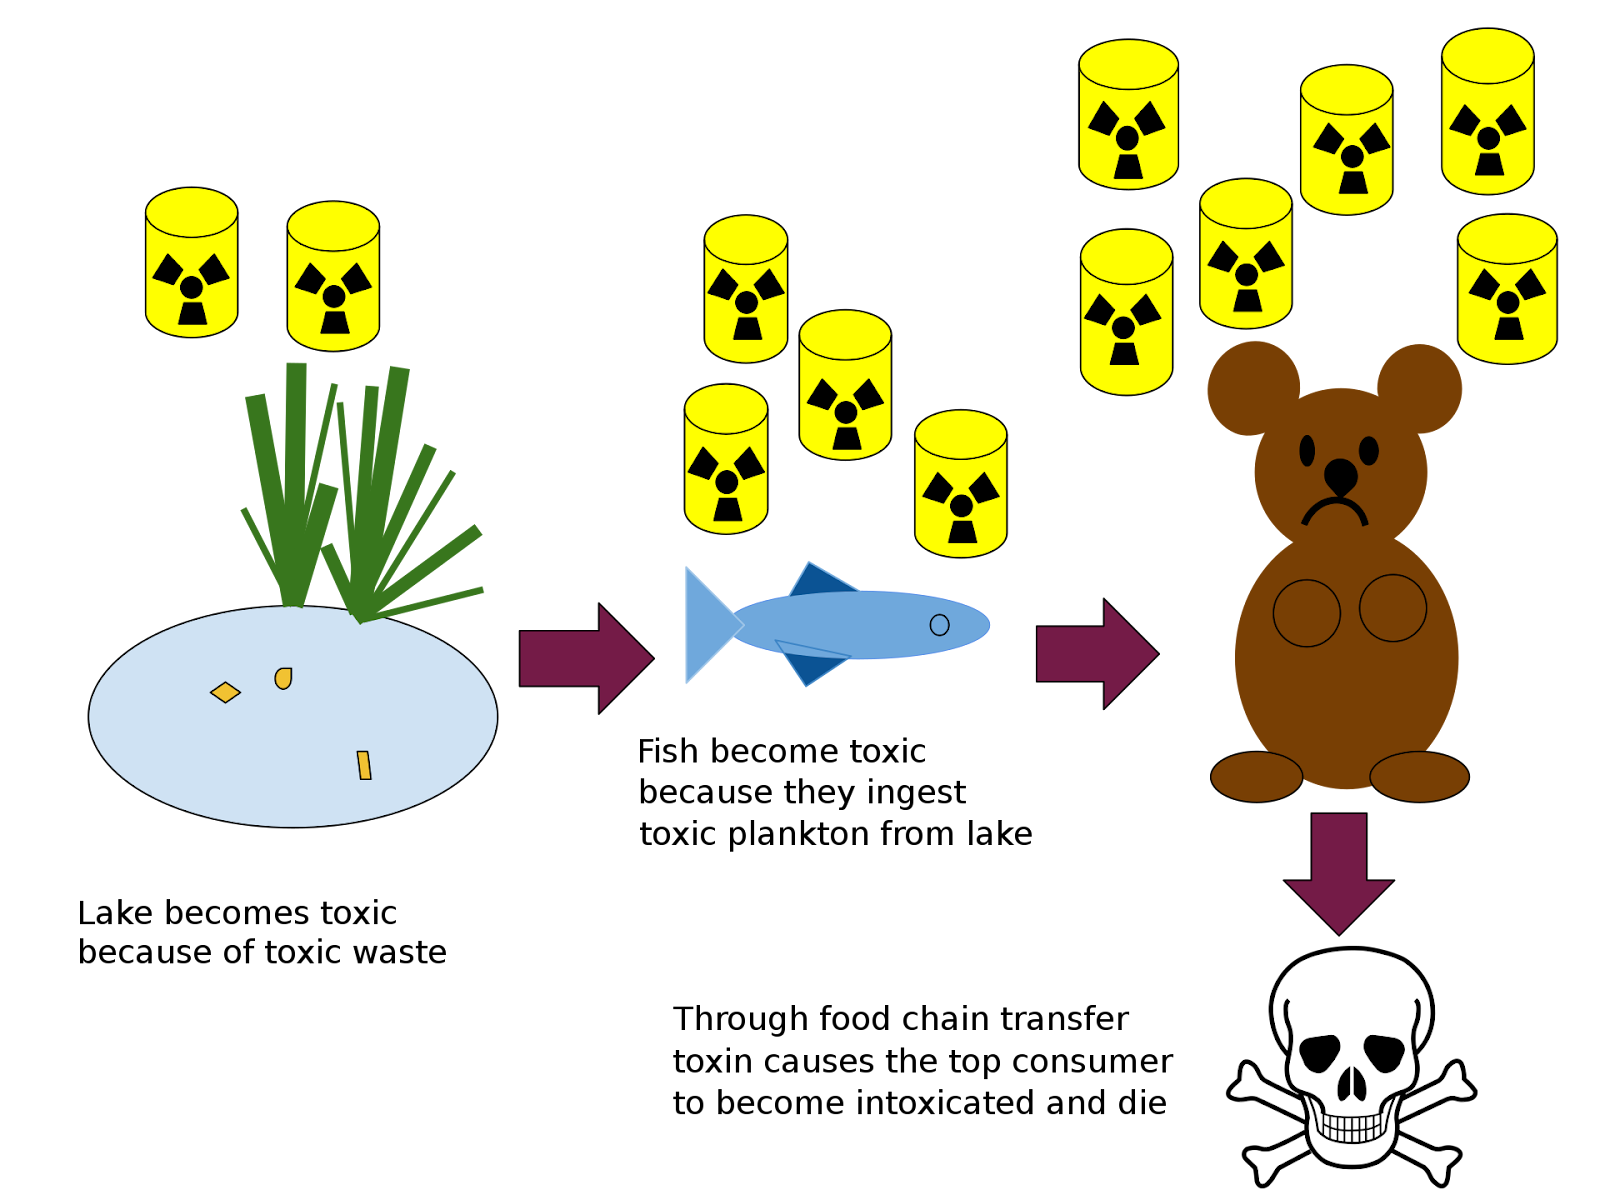
As an analogy, we should know how to measure mercury levels in fish in case it’s ever a problem — our chemists should be able to check fish samples periodically and get a good estimate of the mercury levels, an estimate we feel we can rely on. Because if we can’t measure it, then we don’t know if it’s a problem. High levels could slip by undetected if our methods aren’t right for the job.
1.4 Head-to-Head
Before we can really figure out how much lithium there is in food, we need to find analytical methods that have our full confidence. And the simplest way to test our methods is a head-to-head comparison.
This seemed easy enough, so we set up a project with research nonprofit Whylome to put a set of foods through different digestions and put the resulting slurries in different machines, and see if they give different answers. By comparing different digestions and analytical methods on a standard set of food samples, we should be able to see if different techniques lead to systematically different results.
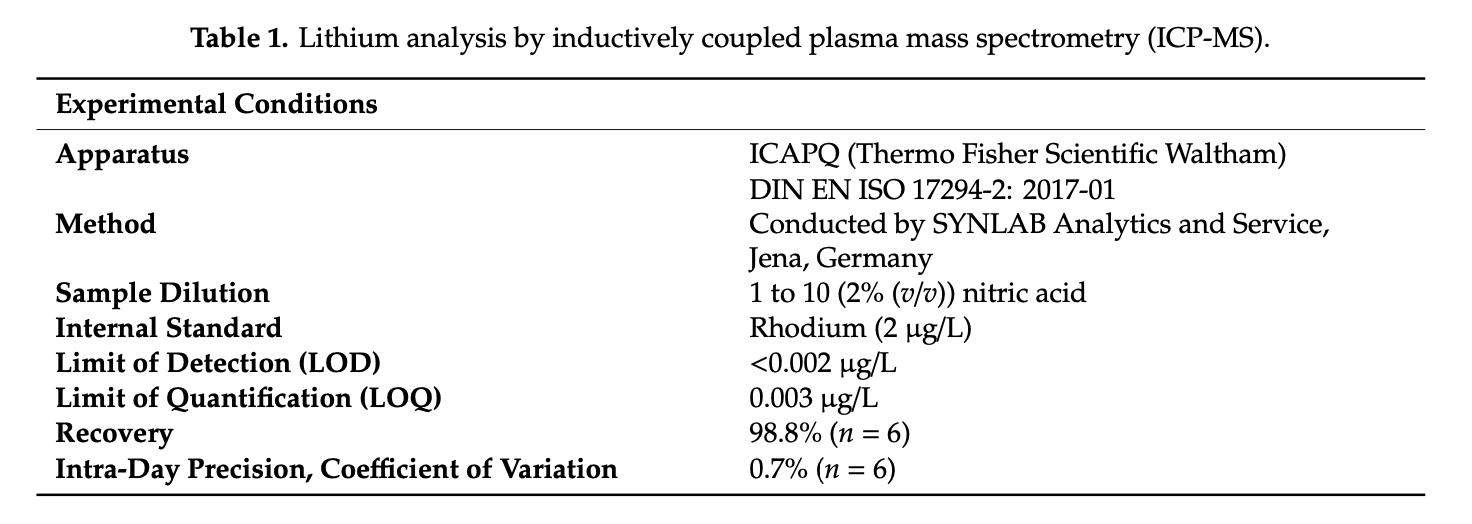
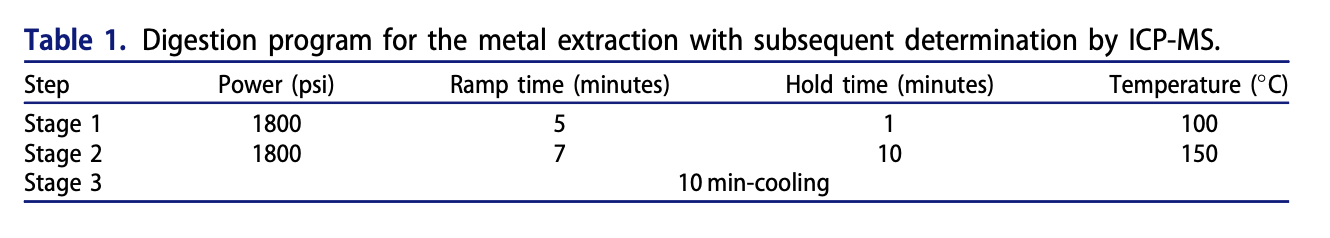
Based on the patterns we saw in the literature, we decided to compare two analysis techniques (ICP-MS and ICP-OES) and three methods of digestion (nitric acid, hydrochloric acid, and dry ashing). Details about these techniques are in the technical report, and in the methods section below.
We originally wanted to compare more analysis techniques (AAS, flame photometry, and flame emission methods) but weren’t able to find a lab that offered these techniques – they are somewhat oldschool and not in common use today. More on this below.
It turned out that the type of analysis didn’t make much difference, but the way in which samples were digested for analysis was surprisingly impactful. And the technique that’s most commonly used today seems to underestimate lithium, at least compared to alternatives.
This project was funded by a generous donation to Whylome from an individual who has asked to remain anonymous. General support for Whylome in this period was provided by the Centre For Effective Altruism and the Survival and Flourishing Fund.
Special thanks to all the funders, Sarah C. Jantzi at the Plasma Chemistry Laboratory at the Center for Applied Isotope Studies UGA for analytical support, and to Whylome for providing general support.
The technical report is here, the raw data are here, and the analysis script is here. Those documents give all the technical details. For a more narrative look at the project, read on.
2. Methods
The basic idea is to test a couple different analytic approaches on a short list of diverse foods.
Most modern analyses use either ICP-MS or ICP-OES. Some of these papers find low concentrations of lithium in food; some of them find high concentrations. We wanted to compare these two techniques to see if they might be the cause of the differences in measurements.
Based on what we had seen in the literature, we decided to compare two analysis techniques (ICP-MS and ICP-OES) and three methods of digestion (nitric acid, hydrochloric acid, and dry ashing), fully crossed, for a total of six conditions.
2.1 Food
As this is our first round of testing, we wanted a diverse set of foods that could give us some sense of the American food environment in general. Therefore we were looking for a mix of foods that were animal-based and plant-based, highly-processed and unprocessed, a mix of fruits, vegetables, dairy, carbs, and meats. We also made sure to include some foods that previous literature had suggested could be extremely high in lithium (like eggs and goji berries), to see if we could confirm those results. Twinkies made the cut because they’re highly processed and highly funny.
In the end, we settled on the following list:
Milk
Carrots
Eggs
Ketchup
Spinach
Corn syrup
Goji berries
Twinkies
Ground beef
Whey powder
All foods were purchased in August of 2022 at grocery stores around Golden, Colorado. Foods were immediately dried, blended, and divided into tubes for further processing, with weight measurements taken at each step of the process.
For example, this is how we prepared the eggs. A carton of twelve eggs were cracked into a stick blender, and blended until well-mixed. A subset of the resulting egg blend was then dehydrated, enough to produce all of the needed material with some to spare. The dried egg (more like flakes at this point) was crushed and mixed well. All samples were taken from this egg powder. Three samples each were submitted to every method of analysis, so every result is an estimate of the concentration of the target element averaged across the whole carton. Put another way, our sample size was one (1) carton of eggs, not 12 eggs separately. As the egg blend was well-mixed, all samples should in principle have the same concentration of elements, suggesting that any variation between samples is the result of analytic noise rather than variation between different eggs or different cartons.
the aforementioned eggs post-dehydration (but before crushing/powderizing)
The member of the team who prepared the samples had this to say:
Making a “Twinkie puree” out of a bowl of twinkies, and then precisely weighing it out into drying trays and placing it in a dehydrator, is probably the strangest thing I have ever done in the name of science. My trusty stick blender really struggled with twinkies, and I had to take a pause because the overworked motor started to make a burning smell. “Twinkiepuree” has unusual visco-elastic properties which make it worth the effort.
Samples were analyzed in triplicate, and each replicate was done entirely separate (its own digestion and its own analysis of the resulting post-digestion solution). Order was randomized, to minimize the risk of “carry-over” from one analysis to the next.
2.2 Digestion
In the literature, most analyses that found low levels of lithium used digestion by nitric acid. To see if this might be the cause of the differences in results, we decided to compare nitric acid digestion to some other digestion approaches. In the end we settled on two other kinds of digestion: 1) digestion with hydrochloric acid, and 2) “dry ashing”, where samples are burned at high temperatures, then the ash is dissolved in nitric acid.
Dry ashing is a good complement to these acid digestion techniques because while oily foods are very chemically resistant to oxidizers, they are also very flammable. Greasy foods full of hydrocarbon chains that may not perfectly come apart in an acid are likely to be fully broken down by incineration. Incineration causes organic compounds to exit the sample as CO2 gas, but elements like sodium, potassium, magnesium, and lithium are non-volatile and remain behind in the ash.
2.3 Analysis
Both ICP-MS or ICP-OES generate a tiny cloud of high-energy plasma, the “inductively-coupled plasma” of the acronym. And both methods inject a cloud of liquid droplets into that plasma. The difference is that ICP-OES examines the light that is emitted by the plasma as the liquid sample hits it, while ICP-MS examines the actual particles of matter (ions) that are emitted by the plasma as the sample hits it, by directing those ions towards a sensor.
3. Results
The first surprise was that hydrochloric acid digestion visibly failed to digest 6 of the 10 foods. Digestions were clearly incomplete and significant solid matter was still visible after the procedure. The 6 foods were carrots, ketchup, spinach, corn syrup, goji berries, and twinkies. This is an interesting mix since it includes fibrous, sugary, and oily foods, so there’s no obvious trend as to what worked and what didn’t.
Without complete digestion, the measurements we got from ICP-OES couldn’t be expected to be at all accurate. So while we have these results, they probably aren’t meaningful, and we discontinued hydrochloric acid digestion for all other samples.
The main results are all ten foods in four conditions: ICP-MS after HNO3 digestion, ICP-OES after HNO3 digestion, ICP-MS after dry ashing, and ICP-OES after dry ashing.
Little difference was found between the results given by ICP-MS and ICP-OES, other than the fact that (as expected) ICP-MS is more sensitive to detecting low levels of lithium. However, a large difference was found between the results given by HNO3 digestion and dry ashing.
In samples digested in HNO3, both ICP-MS and ICP-OES analysis mostly reported that concentrations of lithium were below the limit of detection. The highest numbers given by this technique were in spinach, which was found to contain about 0.2-0.3 mg/kg lithium, and goji berries, which ICP-MS found to contain up to 1.2 mg/kg lithium.
In comparison, all dry ashed samples when analyzed by both ICP-MS and ICP-OES were found to contain levels of lithium above the limit of detection. Some of these levels were quite low — for example, carrots were found to contain only about 0.1-0.5 mg/kg lithium. But other levels were found to be relatively high. The four foods with the highest concentrations of lithium, at least per these analysis methods, were ground beef (up to 5.8 mg/kg lithium), corn syrup (up to 8.1 mg/kg lithium), goji berries (up to 14.8 mg/kg lithium), and eggs (up to 15.8 mg/kg lithium).
These results are summarized in greater detail in the technical report, and in this figure:
4. Which technique is more accurate?
We think that dry ashing (which gives the higher estimates for lithium) is probably more accurate, and here are some reasons why.
Reason #1: Many water samples contain some lithium, and some water samples contain a lot of lithium — sometimes more than 1 mg/L, and occasionally a lot more than 1 mg/L. Unlike food samples, water samples require no digestion, so measurements of water samples are probably quite accurate.
Most food is grown using water and contains some water [CITATION NEEDED]. It would be strange if food, which is made out of water (plus some other things) always contained less lithium than the water it is made out of. More likely, there’s something else that can interfere with the analysis when foods aren’t completely digested.
Reason #2: The analysis lab we used has a “buy one element, get one free” deal, so for all of the foods we submitted, we requested sodium analysis (Na+) on top of the lithium (Li+). We figured, why not, it doesn’t cost any extra.
If there were something unusual about the lithium analysis, you’d expect sodium to behave differently. Specifically, you’d expect each analytical method to find similar levels of sodium in every food. So we compiled the sodium data and ran the same analysis as lithium. And sure enough, it does. Here’s a comparison of the results for lithium and sodium:
(Note that the y axes are different scales. There is way less lithium than sodium in these foods, so when analyzing lithium we are much closer to the limits of quantitation.)
If you were validating the equivalence of sample prep procedures based on Na+, you’d say “looks good, great agreement between ashing and HNO3 digestion.” This isn’t at all true for Li+. Why? We have no idea. But it further supports the suspicion that Li+ is more slippery for some reason, an excellent comparison that highlights just how strange the lithium results are.
This also seems to rule out various “operator error” explanations. If someone were dropping vials or putting them in the machine backwards or something, you would see weird patterns for both lithium and sodium results. The fact that the sodium results look totally normal suggests that something weird is happening for lithium in particular.
Reason #3: Imagine taking pictures with a camera. If you point the camera at something dark, the resulting picture comes out dark. If you point it at something bright, the resulting picture comes out bright. This is a good sign that the camera is working as intended, and that you’re operating it correctly. If your pictures always come out dark, something is probably wrong. Maybe you forgot to take off the lens cap.
We see something similar in these data. Dry ashing sometimes gives low measurements, like in milk and carrots, which it always found to contain less than 0.6 mg/kg lithium. Dry ashing sometimes gives high measurements, like in eggs and goji berries. There’s a lot of noise, but we know that it can produce numbers both large and small.
In comparison, HNO3 digestion always gives tiny numbers. Most of the time it finds that lithium levels are below the limit of detection. When it does seem to detect an actual amount of lithium, the levels are always low, never above 1.2 mg/kg. These numbers look less like actual estimates and more like a problem with the instrument. A cheap digital camera can’t take a good picture at night, even when it’s working perfectly well.
Reason #4: Several parts of the literature hint that spectroscopy techniques are a bad way to measure lithium in food. These comments are often vague, but it seems like people already have reason to think that these methods underestimate the amount of lithium.
For example, Drinkall et al. (1969) mention that they chose to use AAS (“the Unicam SP90 Atomic Absorption Spectrophotometer, [with] a propane-air flame”) because of their concern about “spectral interference occasioned by elements other than lithium” in spectroscopy techniques.
Manifred Anke, who did more work on lithium levels in food than maybe anyone else, makes this somewhat cryptic comment in his 2003 paper:
Lithium may be determined in foods and biological samples with the same techniques employed for sodium and potassium. However, the much lower levels of lithium compared with these other alkali metals, mean that techniques such as flame photometry often do not show adequate sensitivity. Flame (standard addition procedure) or electrothermal atomic absorption spectrophotometry are the most widely used techniques after wet or dry ashing of the sample. Corrections may have to be made for background/matrix interferences. Inductively coupled plasma atomic emission spectrometry [another name for ICP-OES] is not very sensitive for this very low-atomic-weight element.
We can also point to this article by environmental testing firm WETLAB which describes several potential problems in lithium analysis. “When Li is in a matrix with a large number of heavier elements,” they say, “it tends to be pushed around and selectively excluded due to its low mass. This provides challenges when using Mass Spectrometry.” They also indicate that “ICP-MS can be an excellent option for some clients, but some of the limitations for lithium analysis are that lithium is very light and can be excluded by heavier atoms, and analysis is typically limited to <0.2% dissolved solids, which means that it is not great for brines.” We’re not looking at brines, but digested food samples will also include many heavier atoms and some dissolved solids, and might face similar problems.
The upshot is that various sources say something like, “when testing foods, you have to do everything right or you’ll underestimate the amount of lithium”. We can’t tell exactly what these sources think is the right way to do this kind of analysis, but everyone talks about interference and underestimation, and no one mentions overestimation. This makes us suspect that the lower HNO3 digestion numbers are an underestimation and the higher dry ashing numbers are more accurate.
ICP techniques can detect all the elements from lithium to uranium, which means that lithium is just on the threshold of what can be detected. It wouldn’t be terribly surprising if lithium were an edge case, since it is on the edge of detection for ICP analysis. Interference might push it over the edge of the threshold. And interference would only lead to mistakenly lower measurements, not mistakenly higher measurements. This suggests the higher measurements are more accurate.
Reason #5: There are a few cases where teams have used HNO3 digestion and still report high concentrations of lithium in food, in particular Voica, Roba, and Iordache (2020).
This suggests that maybe there’s some trick to HNO3 digestion that can make it give higher, more accurate results, numbers that are consistent with dry ashing. Maybe these teams know something we don’t.
𐫱
All of these are reasons to suspect that the higher dry ashing numbers are more accurate. However, the truth is that at this point, nobody knows.
Given this uncertainty, it could be that neither technique is accurate. The true levels of lithium in these foods might be in between, or could be even higher than what was detected by dry ashing.
Using other analysis techniques like AAS or AES or FAES would be a good way to triangulate between these two conflicting methods. Unfortunately we have not been able to find a lab that offers AAS or other alternative methods of chemical analysis. Can anyone help us?
Accuracy aside, one thing that stands out is that none of these techniques are very precise. For three samples of the same well-blended corn syrup, dry ashing with ICP-OES gives estimates of 0.7155 mg/kg, 1.5892 mg/kg, and 8.1207 mg/kg lithium. HNO3 digestion with ICP-OES generally doesn’t report any lithium at all, but for spinach, it gives estimates of 0.3914 mg/kg, 0.2910 mg/kg, and 0.3595 mg/kg. These are for three identical samples of well-blended spinach. In theory they should be the same! But all four techniques appear to have relatively low precision across the board.
5. What does this mean for analytical chemistry?
Two different analytical techniques gave two very different answers when looking at the exact same samples. This seems like an anomaly worth investigating.
These unusual findings may result from the fact that lithium is the third-lightest element and by far the lightest metal. It’s a real weird ion, so this may just be lithium being lithium. But even so, if the nitric acid completely digests a sample and gives a clear, homogeneous solution, it would seem like there is nowhere for Li+ to hide. From first principles, you’d expect this to work.
It’s also possible that this points to a more consistent limitation of common analytical techniques. Certainly it would be a problem if the techniques we used to estimate mercury in fish, or arsenic in rice, consistently underestimated the concentrations of these metals.
It may be smart to run similar studies to compare analytical techniques for estimating other metals in foods, to make sure there aren’t any other hidden surprises like this one. If work along these lines turns up many similar surprises, well, maybe that means we don’t understand analytical chemistry as well as we think.
6. Next Steps
We would like to test a lot more samples, and get a better sense of how much lithium is in all kinds of different foods.
But before we can do that, we have to figure out this mystery around different analytical techniques. It doesn’t make sense to go out and use one method to test a thousand different foods when we don’t know if that method is at all reliable or accurate.
So first off, we will be trying to figure out which technique is most accurate, and if we can, we’ll also try to figure out why these different analytical techniques give such strikingly different results.
There are a few ways we can do this:
We can add known amounts of lithium to food samples in a spike-in study.
We can also spike-in elements that might be interfering with lithium detection.
We can try other kinds of digestion or other analytical techniques (like AAS) as a tiebreaker, and see if they agree more with the HNO3 numbers or the dry ashing numbers.
Or we can study more samples — it’s possible that a food containing 1000 mg/kg would register above the limit of detection for both techniques.
If you have any other clever ideas, please let us know!
In the meantime, here are some ways you can help:
If you have access to the necessary equipment, please replicate our work. We’ve included all the checks we could think of, but it’s still possible that there was some mistake in our procedure, something backwards about the results. Independent labs should confirm that they get similar results when comparing HNO3 digestion to dry ashing in ICP-MS and ICP-OES analysis.
An even bigger favor would be to extend our work. If you are able to replicate the basic finding, it would be jolly good to tack on some new foods or try some new analytical techniques. Do you have access to AAS for some reason? Wonderful, please throw an egg into the flame for us.
If you’re not an analytical chemist but you are a person of means who is both curious and skeptical, you could conceivably hire a lab to replicate or replicate and extend our work. If you’re interested in doing this, we would be happy to advise.
Thanks again to our anonymous donor, to Sarah Jantzi, and to Whylome for supporting this research.
Finally, thank you for reading!
APPENDIX A: Wait what is the background for this study?
Hello, we are SLIME MOLD TIME MOLD, your friendly neighborhood mad scientists.
We started getting into this question because in our opinion, the evidence suggests that exposure to subclinical doses of lithium is responsible for the obesity epidemic — you can read all about it in Part VII and Interludes C, G, H, and I of our series, A Chemical Hunger.
We also understand that not everyone finds this evidence convincing. That’s ok. Even if you don’t think lithium causes obesity, this project is still important for other reasons: 1) lithium might have other health effects, so 2) we should be able to test food for lithium concentrations so we can know how much we’re consuming and act accordingly. And in general, this looks like it might be a gap in analytical chemistry. We should know how to analyze things; so let’s close that gap.
APPENDIX B: Where is all this lithium coming from?
We’ve already written quite a bit about this, so if you want the full story, you should read those posts: in particular Part VII, Interlude G, Interlude H, and Interlude I of A Chemical Hunger.
But the short version is this. Starting around 1950, people started mining more and more lithium and never looked back, and some of what we mine eventually ends up as contamination. Lithium goes in batteries, which end up in landfills. It also goes in the lithium grease used in cars and other heavy machinery, which ends up in runoff. Deeper aquifers often contain more lithium, so drilling deeper wells may have also increased our exposure.
Graph showing world lithium production from 1900 to 2007, by deposit type and year. The layers of the graph are placed one above the other, forming a cumulative total. Reproduced from USGS.
After our recent post on Lithium in Food, several readers pointed us to a literature on “Total Diet Studies”, or TDS for short.
The TDS approach is pretty intuitive: if you want to study contaminants or residues that people are maybe exposed to through their food, one way to do that is to drive around to a bunch of actual grocery stores and supermarkets, buy the kinds of foods people actually buy and eat, prepare the foods like they’re actually prepared in people’s homes, and then test your samples for whatever contaminants or residues you’re concerned about.
A Total Diet Study (TDS) generally consists of selecting, collecting and analysing commonly consumed food purchased at retail level on the basis of food consumption data to represent a large portion of the typical diet, processing the food as for consumption, pooling the prepared food items into representative food groups, homogenizing the pooled samples, and analysing them for harmful and/or beneficial chemical substances (EFSA, 2011a). From a public health point of view, a TDS can be a valuable and cost effective complementary approach to food surveillance and monitoring programs to assess the presence of chemical substances in the population diet and to provide reliable data in order to perform risk assessments by estimating dietary exposure.
These papers include measurements of trace elements in various foods, and some of them include measurements for lithium. We didn’t find these papers while writing our first review of the levels of lithium in food and drink because these papers aren’t looking for lithium specifically — they’re looking at all sorts of different contaminants and minerals, and lithium just happens to sometimes make the cut.
But anyways, several of these papers do include measurements of lithium in various national food supplies, and they’re strange, because unlike every other source we’ve seen, which all routinely find some foods with more than 1 mg/kg lithium, they find less than 0.5 mg/kg lithium in every single food.
TDS with Li
The oldest TDS study we’ve seen that includes lithium is from 1999 in the United Kingdom, reporting on the UK 1994 Total Diet Study and comparing those results to data from previous UK Total Diet Studies. (The UK TDS has been “carried out on a continuous annual basis since 1966” but it seems like they only started including lithium in their analysis in the 1990s.) They report the mean concentrations of 30 elements (aluminium, antimony, arsenic, barium, bismuth, boron, cadmium, calcium, chromium, cobalt, copper, germanium, gold, iridium, iron, lead, lithium, manganese, mercury, molybdenum, nickel, palladium, platinum, rhodium, ruthenium, selenium, strontium, thallium, tin, and zinc) in 119 categories of foods, combined into 20 groups of similar foods for analysis.
The highest mean concentration of lithium they found in the food categories they examined was an average of 0.06 mg/kg (fresh weight) in fish. They estimated a total exposure of 0.016 mg lithium a day, and an upper limit of 0.029 mg a day, in the British diet at the time. This appears to be substantially less than the amount found in a 1991 sample, which gave an estimate of 0.040 mg lithium a day in the British diet. They explicitly indicate there is no data on lithium in foods (in their datasets) from before 1991.
France conducted a TDS in 2000, and a report all about it was published in 2005. They looked at levels of 18 elements (arsenic, lead, cadmium, aluminium, mercury, antimony, chrome, calcium, manganese, magnesium, nickel, copper, zinc, lithium, sodium, molybdenum, cobalt and selenium) in samples of 338 food items.
The highest mean concentration of lithium they found in the food categories they examined was an average of 0.123 mg/kg in shellfish (fresh matter) and 0.100 mg/L in drinking water. They estimated an average daily exposure of 0.028 mg for adults, with a 97.5th percentile daily exposure of 0.144 mg. They specifically mention, “drinking waters and soups are the vectors contributing most (respectively 25–41% and 14–15%) to the exposure of the populations; other vectors contribute less than 10% of the total food exposure.”
France did another TDS in 2006, with a report published in 2012. This time they looked at Li, Cr, Mn, Co, Ni, Cu, Zn, Se and Mo in 1319 samples of foods typically consumed by the French population.
Similar to the first French TDS, the highest mean concentration of lithium they found in the food categories they examined was an average of 0.066 mg/kg (fresh weight) in shellfish. But the highest individual measurements were found in two samples of sparkling water, with 0.612 mg/kg and 0.320 mg/kg.
New Zealand seems to run a Total Diet Study programme every 4–5 years since 1975, but we’ve only been able to find lithium measurements from this project in a paper from 2019, looking at data from the 2016 New Zealand Total Diet Study. Maybe, like some of the other TDS projects, they only started including lithium testing later on. Anyways, in this paper they looked at 10 elements (antimony, barium, beryllium, boron, bromine, lithium, nickel, strontium, thallium and uranium) in eight composite samples each of 132 food types.
This paper is a little strange, and unlike most of these papers, doesn’t give much detail. They summarize the main findings for lithium as, “the reported concentrations ranged from 0.0007 mg/kg in tap water to 0.54 mg/kg in mussels” and say that the mean overall intake of lithium in New Zealand adults is 0.020–0.029 mg/day.
The most recent TDS that looked at lithium seems to be this 2020 paper, which looks at food collected between October 2016 and February 2017 in the Emilia-Romagna Region in Italy. They looked at levels of fifteen trace elements (antimony, barium, beryllium, boron, cobalt, lithium, molybdenum, nickel, silver, strontium, tellurium, thallium, titanium, uranium, and vanadium) in 908 food and beverage samples from local markets, supermarkets, grocery stores, and community canteens.
The highest concentration of lithium they found in the food categories they examined was in fish and seafood (50th percentile 0.019 mg/kg, IQR 0.010–0.038 mg/kg), and legumes (50th percentile 0.015 mg/kg, IQR 0.006–0.035 mg/kg). They estimate a dietary lithium intake for the region of 0.018 mg/day (IQR 0.007–0.029 mg/day).
So overall, these papers report that lithium levels in foods and beverages never break 0.612 mg/kg, and almost universally keep below 0.1 mg/kg.
How About Those Numbers
We’re skeptical of these numbers for a couple of reasons.
The TDS papers say that all foods and beverages contain less than 1 mg/kg lithium, and that people’s lithium intake is well below 1 mg a day. But this is up against sources like the following, which all find much higher levels (not an exhaustive list):
Bertrand (1943), “found that the green parts of lettuce contained 7.9 [mg/kg] of lithium”
Borovik-Romanova (1965) “reported the Li concentration in many plants from the Soviet Union to range from 0.15 to 5 [mg/kg] in dry material”, in particular listing the levels (mg/kg) in tomato, 0.4; rye, 0.17; oats, 0.55; wheat, 0.85; and rice, 9.8.
Ammari et al. (2011), looked at lithium in plant leaves, including spinach, lettuce, etc. and found concentrations in leaves from 2 to 27 mg/kg DM.
Manfred Anke and his collaborators found more than 1 mg/kg in a wide variety of foods, in multiple studies across multipleyears, up to 7.3 mg/kg on average for eggs.
Schnauzer (2002) reviewed a number of other sources finding average intakes across several locations from 0.348 to 1.560 mg a day.
Five Polish sources from 1995 that a reader recently sent us reported finding (as examples) 6.2 mg/kg in chard, 18 mg/kg in dandelions, up to 470.8 mg/kg in pasture plants in the Low Beskids in Poland, up to 25.6 mg/kg in dairy cow skeletal muscle, and more than 40 mg/kg in cabbage under certain conditions. (These papers aren’t available online but we plan to review them soon.)
It seems like either the measurements from the TDS papers are right, and all foods contain less than 1 mg/kg lithium, or all the rest of the literature is right, and many plants and foods regularly contain more than 1 mg/kg lithium. The alternative, that both of them are right, would mean that the same foods consistently contain less than 1 mg/kg in France and New Zealand while containing more than 1 mg/kg in Germany and Brazil. This seems like the most far-fetched possibility.
There are three strikes against the TDS numbers. First, they’re strictly outnumbered. When five papers from four sources (two of those papers are from France) say one thing and the rest of the literature clearly says another, it’s not a sure thing, but the side with more evidence… well it has more evidence for it.
Second, the TDS studies have a divided focus. They’re not really interested in lithium at all; they’re interested in the local food supply, and lithium just happens to be one of between 9 and 30 different elements they’re testing for. In comparison, pretty much all the other papers are looking at lithium in particular. If we had to guess which kind of team is more likely to mess up this kind of analysis, the team interested in this one particular element, or the team that randomly included the element in the list of several elements they’re testing for, we know which we’d pick. It’s hard to imagine that every team looking for lithium chose the wrong analysis or screwed it up in the same way somehow. It’s easy to imagine that the TDS studies, which measured lithium incidentally, might get some part of the analysis wrong.
It’s kind of like clothing. Ready-made sizes will fit most elements, but if you have an unusual body type (really long arms, really thick neck, etc.) you may have to go to a tailor. And lithium has the most unusual body type of all the solid elements. It wouldn’t be at all surprising if off-the-rack clothes didn’t fit poor little lithium.
uhhhhh spectral analysis
The third thing that’s strange is that there seem to be some internal contradictions within the studies. For example, in the first French TDS study, the lithium levels in water are much higher than lithium levels in things that are made out of water, which seems impossible. The mean lithium level in drinking water is 0.100 mg/kg, but the lithium levels in things that are mostly water are much lower: 0.038 mg/kg in soups, 0.006 mg/kg in coffee, 0.004 in non-alcoholic beverages, 0.003 in alcoholic beverages, and 0.002 in hot beverages. Soup is maybe a little different, but coffee and beverages are mostly water. How can there be fifty times more lithium in plain water than in hot beverages, which are (we assume) mostly water?
For that matter, how can drinking water be the category with the second-most lithium (after shellfish)? Water is the main ingredient in beverages, but it’s also a major ingredient of pretty much every food. Fruits, salads, milk, vegetables, etc. etc. all contain lots of water. Unless there’s some major, universal filtering going on, there should be more lithium in at least some foods than there is in water.
And that’s what you see if you look at the other elements in this first French paper — more in foods than in water. For example, the average level of manganese in drinking water in these data is 0.19 mg/kg, and the mean levels in beverages are all 0.30 mg/kg or higher; the mean level in soup is 0.97 mg/kg; the mean level in fruits is 2.05 mg/kg, much higher. Same for zinc. The mean level in drinking water is 0.05 mg/kg, which is the lowest mean level of zinc of any food category. Other elements, at least, tend to have higher concentrations in some foods than in water.
In the second French TDS study, the same thing happens. The highest concentration of lithium they found in any food was in water, 0.612 mg/kg. The mean for water this time around was only 0.035 mg/kg, but that’s still higher than the means for most beverages and the mean for almost every food.
(The other TDS papers don’t give mean lithium measurements for water, so we can’t do the same comparison with them.)
This doesn’t make much sense. Water is a major component of many foods and it would be shocking if lithium didn’t find its way from water into food (and more obviously into beer and tea). But all of the fruits and vegetables have less lithium than the water that would presumably be used to irrigate them.
There’s a rich literature of hydroponics experiments that shows that all sorts of plants accumulate lithium. When you grow them in a lithium solution under controlled conditions, or in soil spiked with lithium, the plants end up containing a higher concentration of lithium than the solution/soil they were grown in.
These spikes are much larger than the levels of lithium plants are normally exposed to in the environment, but they’re experimental evidence that lithium accumulates, even to enormous degrees. You should reliably expect to see more lithium in plants than in the water they’re grown with. There might be some plants that don’t accumulate, but water shouldn’t universally contain the highest amounts.
We didn’t really include these sources in our original review because that was a review of lithium in food, and these hydroponically-grown experimental plants aren’t in the actual food supply. But they’re pretty informative, so here’s a selection of the studies:
Magalhães et al. (1990) grew radish, lettuce and watercress in a hydroponic system, with solution containing lithium levels of 0.7, 6.8 and 13.6 mg/L. These are all somewhat high, but exposure to 0.7 mg/L in water isn’t totally unrealistic. Plants were collected thirty days after transplanting. At the lowest and most realistic level of exposure, 0.7 mg/L, lettuce contained 11 mg/kg lithium, radish bulbs contained 11 mg/kg, radish leaves contained 17 mg/kg, and watercress contained 37 mg/kg. At 6.8 mg/L in the solution all plants contained several hundred mg/kg, and at 13.6 mg/L, radish leaves and watercress contained over 1000 mg/kg.
Hawrylak-Nowak, Kalinowska, and Szymańska (2012) grew corn and sunflower plants in glass jars containing 0 (control), 5, 25, or 50 mg/L lithium in a nutrient solution. After 14 days, they harvested the shoots, and found that lithium accumulated in the shoots in a dose-dependent manner. Even in the control condition, where no lithium was added to the solution, sunflower shoots contained 0.9 mg/kg and corn shoots contained 4.11 mg/kg lithium. At 5 mg/L solution, sunflower contained 422.5 mg/kg and corn contained 72.9 mg/kg; at 25 mg/L solution, sunflower contained 432.0 mg/kg and corn contained 438.0 mg/kg; at 50 mg/L solution, sunflower contained 3,292.0 mg/kg and corn contained 695.0 mg/kg. These levels are unrealistically high, but the example is still illustrative.
Kalinowska, Hawrylak-Nowak, and Szymańska (2013) grew lettuce hydroponically in solution containing 0, 2.5, 20, 50 or 100 mg/L lithium. Lithium concentrations above 2.5 mg/L progressively fucked the plants up more and more, but there was clear accumulation of lithium in the lettuce. There was some concentration in the leaves in a solution of 2.5 mg/L (though they don’t give the numbers), and when the lettuce was grown in a 20 mg/L solution, there was around 1000 mg/kg in the leaves.
Antonkiewicz et al. (2017) is an unusual paper on corn being grown hydroponically in solutions containing various amounts of lithium. They find that corn is quite resistant to lithium in its water — it actually grows better when exposed to some lithium, and only shows a decline at concentrations around 64 mg/L. (“The concentration in solution ranging from 1 to 64 [mg/L] had a stimulating effect, whereas a depression in yielding occurred only at the concentrations of 128 and 256 [mg/L].”) But the plant also concentrates lithium — even when only exposed to 1 mg/L in its solution, the plant ends up with an average of about 11 mg/kg in dry material.
Robinson et al. (2018) observed significant concentration in the leaves of several species as part of a controlled experiment. They planted beetroot, lettuce, black mustard, perennial ryegrass, and sunflower in controlled environments with different levels of lithium exposures. “When Li was added to soil in the pot experiment,” they report, “there was significant plant uptake … with Li concentrations in the leaves of all plant species exceeding 1000 mg/kg (dry weight) at Ca(NO3)2-extractable concentrations of just 5 mg/kg Li in soil, representing a bioaccumulation coefficient of >20.” For sunflowers in particular, “the highest Li concentrations occurred in the bottom leaves of the plant, with the shoots, roots and flowers having lower concentrations.”
Again, these are unrealistic for the amount of lithium you might find in your food, but they’re clear support for the idea that plants consistently accumulate lithium relative to the conditions they’re grown in. It doesn’t make sense that we see water having the highest concentration in the TDS data.
This is your sunflower leaf on 50 mg/L lithium
So for all these reasons, we’re pretty sure that the TDS numbers are wrong and that the lithium-specific literature is right. Specialty research that looks for lithium in particular is more reliable in our opinion than sources that happen to look at lithium as one contaminant along with a dozen others.
But even so, you’d have to be terminally incurious to look at this and not wonder what was going on. Why do these five papers have measurements that don’t match the rest of the literature?
What’s Going on in the TDS
Since these papers disagree with every other source, and they all share the same Total Diet Study approach, it seems like there must be something wrong with that approach.
Sometimes this kind of mistake can come from problems with the equipment, dropping a decimal, or misreading units, like mistaking mg/kg for µg/kg.
But we have a hard time imagining that all of these different teams with (as far as we can tell?) no overlap in authors would be making exactly the same error of using the wrong units or moving a decimal place. It’s possible they all use the same slightly-misleading software or something; we have seen a few other papers that report lithium in one set of units, and every other element they test for in different units. But again, it would be weird for every single TDS study to screw this up in exactly the same way.
So we went back and took a closer look at their methods. What we noticed is that every one of these TDS studies used the same analysis technique — inductively coupled plasma mass spectrometry, or ICP-MS.
So we wonder if there might be an issue with ICP-MS.
Samples of each food group … were homogenized and digested (0.5 g) in inert plastic pressure vessels with nitric acid (5 ml) using microwave heating (CEM MDS 2000 microwave digestion system). All elements except mercury, selenium and arsenic were analysed by Inductively Coupled Plasma-Mass Spectrometry (ICP-MS) (Perkin Elmer Elan 6000).
The elementary analyses (about 18 000 results in all) were carried out by the Environmental Inorganic Contaminants and Mineral Unit of the AFSSA-LERQAP, which is the national reference laboratory. All the 998 individual food composite samples were homogenized and digested (about 0.6 g taken from each sample) in the quartz vessels with suprapure nitric acid (3 ml) using Multiwave closed microwave system (Anton-Paar, Courtaboeuf, France). The total content of all selected essential and non essential trace elements in the foods was determined by Inductively Coupled Plasma-Mass Spectrometry (ICP-MS) (VG PlasmaQuad ExCell-Thermo Electron, Coutaboeuf, France), a very powerful technique for quantitative multi-elemental analysis.
The National Reference Laboratory (NRL) for heavy metals was chosen to analyse 28 trace elements, and among them nine essential elements, Li, Cr, Mn, Co, Ni, Cu, Zn, Se and Mo, by inductively coupled plasma-mass spectrometry (ICP-MS) after microwave-assisted digestion.
…
Sample digestion was carried out using the Multiwave 3000 microwave digestion system (Anton-Paar, Courtaboeuf, France), equipped with a rotor for 8 type X sample vessels (80-mL quartz tubes, operating pressure 80 bar). Before use, quartz vessels were decontaminated in a bath of 10% HNO3 (67% v/v), then rinsed with ultra-pure water, and dried in an oven at 40 °C. Dietary samples of 0.2–0.6 g were weighed precisely in quartz digestion vessels and wet-oxidised with 3 mL of ultra-pure water and 3 mL of ultra-pure HNO3 (67% v/v) in a microwave digestion system. One randomly-selected vessel was filled with reagents only and taken through the entire procedure as a blank. The digestion program had been optimised previously (Noël, Leblanc, & Guérin, 2003). After cooling at room temperature, sample solutions were quantitatively transferred into 50-mL polyethylene flasks. One hundred microlitres of internal standard solution (1 mg L−1) were added, to obtain a final concentration of 2 μg L−1, and then the digested samples were made up with ultrapure water to the final volume before analysis by ICP-MS.
ICP-MS measurements were performed using a VG PlasmaQuad ExCell (Thermo, Courtaboeuf, France). The sample solutions were pumped by a peristaltic pump from tubes arranged on a CETAC ASX 500 Model 510 autosampler (CETAC, Omaha, NE).
We measured content of fifteen trace elements (antimony, barium, beryllium, boron, cobalt, lithium, molybdenum, nickel, silver, strontium, tellurium, thallium, titanium, uranium, and vanadium) in 908 food and beverage samples through inductively coupled plasma mass spectrometry.
…
Using a clean stainless-steel knife, we cut solid foods by collecting samples from six different points in the plate. Then, we homogenized the samples using a food blender equipped with a stainless-steel blade and we placed a portion of 0.5 g in quartz containers previously washed with MilliQ water (MilliQPlus, Millipore, MA, USA) and HNO3. We liquid-ashed the samples with 10 ml solution (5 ml HNO3 + 5 ml·H2O) in a microwave digestion system (Discover SP-D, CEM Corporation, NC, USA) and we finally stored them in plastic tubes, and diluted to 50 ml with deionized water before analysis. Using an inductively coupled plasma mass spectrometer (Agilent 7500ce, Agilent Technologies, CA, USA), we performed trace element determination.
So, all of these papers use the same analysis technique, ICP-MS. We don’t know the exact technique used by the team in New Zealand, but all the other teams used microwave digestion with nitric acid (HNO3). Three of them (the French and Italian TDS studies) used quartz vessels.
The fact that all these studies use similar analysis techniques makes it much more plausible that something about this technique is screwing up something about the lithium detection.
This also seems likely because most other papers, the ones that find more than 1 mg/kg lithium in food, don’t use ICP-MS. Here’s a small selection.
The most recent paper finding more than 1 mg/kg lithium in plant matter seems to have used inductively coupled plasma optical emission spectrometry (ICP-OES), a related but distinct technique. This is Robinson et al. (2018), which found that plants can contain “several hundred mg/kg Li” in leaves. Here’s their procedure:
Plant samples were washed in deionized water and dried at 60 °C until a constant weight was obtained. Subsequently, they were milled using a Cyclotech type 1093 cyclone grinder with an aluminium rotor. Plant material (0.5 g) was digested in 5 ml HNO3. The digests were diluted with Milli Q (Barnstead, EASYpure RF, 18.3 MΩ-cm) to a volume of 25 ml and filtered with a Whatman 52 filter paper (pore size 7 μm). … Pseudo-total element concentrations (henceforth referred to as “total”) were determined in the acid digests using ICP-OES (Varian 720 ES).
Ammari et al. (2011), looked at lithium in solids (plant leaves, including spinach, lettuce, etc.) and found concentrations in leaves from 2 to 27 mg/kg DM. They used this procedure:
Collected leaves were gently washed in distilled water, air-dried, and then oven-dried to a constant weight at *70°C. Dry leaves were finely ground in a Moulinex Mill (Moulinex, Paris, France) to pass through a 40-mesh sieve. As Li is known to be present in cell vacuoles in inorganic soluble form, Li was determined in filtrates of oven-dry ground leaf samples (5 g) suspended in 50 ml of deionized water for 1 h. This procedure was used in the current study because not all the lithium present in natural unprocessed foods is taken up by the human body (pers. comm. with nutritionists; Dr. Denice Moffat, USA). Lithium extracted with deionized water represents the soluble fraction that is directly taken up by the gastrointestinal tract and considered the most bio-available. … The concentration of Li in leaf samples was measured with a flame photometer.
Anke’s 2005 paper doesn’t give a ton of detail, but seems to have used atomic absorption spectroscopy (AAS) for lithium, and reports numbers up to 7.5 mg/kg in foods.
Magalhães et al. (1990) found up to 1,216 mg/kg in (hydroponically-grown, experimental) watercress and say:
Thirty days after transplanting, the plants were harvested, shoots and roots separately, and their fresh weight determined. They were oven-dried at 700C for 72 hours, weighted, ground in a Wiley mill and analyzed for N, P, K, Ca, Mg, Fe and Li contents after digestion in H2SO4 and H202. N was determined by Nesslerization, P by an ammonium molybdate-amino naphthol sulfonic acid reduction method (Murphy & Riley 1962), K and Li by flame emission and Ca, Mg and Fe by atomic absorption (Sarruge & Haag 1974).
Drinkall et al. (1969), one of our oldest sources, found up to 148 mg/kg in pipe tobacco and used “the atomic absorption technique”. Specifically they say:
Methods for determination of lithium in foodstuffs have in the past been limited almost entirely to the use of the spectrograph and the flame photometer. In the present investigation, however, it was decided to apply the technique of atomic absorption for this purpose. The chief reason for this choice was the lack of occurrence of spectral interference occasioned by elements other than lithium, Indeed, the only elements which were thought likely to prove troublesome were calcium and strontium. Even these, however, were found not to interfere. The instrument used throughout this work was the Unicam SP90 Atomic Absorption Spectrophotometer, a propane-air flame being employed.
So this diverse set of methods all found levels of lithium above 1 mg/kg, while the “ICP-MS with microwave digestion in nitric acid (usually in quartz vessels)” technique seems to reliably find way less than 1 mg/kg. This is starting to look like it’s an issue with the analysis.
If this is the case, then if we can find other papers that use ICP-MS with microwave digestion in nitric acid, they should also show low levels of lithium, well below 1 mg/kg.
That’s exactly what we’ve found. Take a look at Saribal (2019). This paper used ICP-MS and looked at trace element concentrations in cow’s milk samples from supermarkets in Istanbul, Turkey. They found an average of 0.009 mg/L lithium in milk, way lower than the measurements for milk found in sources that don’t use ICP-MS.
Saribal, like the TDS studies, used ICP-MS to look for lithium alongside a huge number of other elements — 19 in fact. The full list was: lithium, beryllium, chromium, manganese, cobalt, nickel, copper, arsenic, selenium, strontium, molybdenum, cadmium, antimony, barium, lead, bismuth, mercury, thallium, and uranium. Like the TDS studies, they did digestion in nitric acid:
The quadrupole inductively coupled plasma mass spectrometer (ICP-MS) used in this work was Thermo Scientific X Series II (Thermo Fisher Scientific, Bremen, Germany).
…
One-milliliter portions of each milk samples were digested in 65% HNO3 and 2 mL 30% H2O2 (Merck, Poole, UK) on a heat block. The temperature was increased gradually, starting from 90 °C and increasing up to 180 °C. The mixture was cooled down and the contents were transferred to polypropyl- ene tubes with seal caps. Each digested sample was diluted to a final volume of 10 mL with double deionized water
Here’s another one. Kalisz et al. (2019) looked at “17 elements, including rare earth elements, in chilled and non-chilled cauliflower cultivars”. They used ICP-MS, they microwave digested with nitric acid, and they found lithium levels of less than 0.060 mg/kg. Here’s the method:
We investigated the content of Ag, Al, Ba, Co, Li, Sn, Sr, Ti, Sb, and all rare-earth elements. … Curds were cut into pieces and dried at 70 °C in a dryer with forced air circulation. Then, the plant material was ground into a fine and non-fibrous powder using a Pulverisette 14 ball mill (Fritsch GmbH, Germany) with a 0.5-mm sieve. Next, 0.5 g samples were placed in to 55 ml TFM vessels and were mineralized in 10 ml 65% super pure HNO3 (Merck no. 100443.2500) in a Mars 5 Xpress (CEM, USA) microwave digestion system. The following mineralization procedure was applied: 15 min. time needed to achieve a temperature of 200 °C and 20 minutes maintaining this temperature. After cooling, the samples were quantitatively transferred to 25 ml graduated flasks with redistilled water. Contents of mentioned elements were determined using a high-dispersion inductively coupled plasma optical emission spectrometer (ICP-OES; Prodigy Teledyne Leeman Labs, USA).
There are a couple complications, but they’re worth looking at. Seidel et al. (2020) used ICP-MS and found reasonable-seeming numbers in a bunch of beverages. But, as far as we can tell, they didn’t digest the beverages at all. They just say:
Li concentrations in our 160 samples were determined via inductively coupled plasma mass spectrometry (ICP-MS) as summarized in Table 1.
Here’s Table 1 in case you’re curious:
This seems like evidence that something about the digestion process might be to blame.
There’s also Voica, Roba, and Iordache (2020), a Romanian paper which used ICP-MS and found up to 3.8 mg/kg in sheep’s milk and up to 4.2 mg/kg in pumpkins. This is pretty surprising — it’s the first ICP-MS paper we’ve seen that finds more than 1 mg/kg lithium in a sample of food. They even use microwave digestion with nitric acid! So at first glance, this looks like a contradiction — but when we looked closer, their method did differ in some interesting ways.
The lithium concentrations were determined by inductively coupled plasma – mass spectrometry (ICP-MS).
…
Considering that samples have a very complex composition with large organic matter content, the total digestion of the matrix is mandatory to assure complete metal solubility. The studied samples were subjected to microwave assisted nitric acid digestion by using a closed iPrep vessel speed system MARS6 CEM One Touch. The digestion vessels were cleaned with 10 mL HNO3 using the microwave cleaning program and rinsed with deionized water. Approximately 0.3 g aliquots of the samples were weighed, followed by digestion in 10mL HNO3 60% at high pressure, temperature and in the presence of microwave irradiation. The vessel was closed tightly, placed on the rotor, and the digestion was carried out following the program presented in Table 1.
After complete digestion and cooling, the samples were filtered, transferred to 50 mL graduated polypropylene tubes and diluted to volume with deionized water.
A Perkin Elmer ELAN DRC-e instrument was used with a Meinhard nebulizer and a glass cyclonic spray chamber for pneumatic nebulization. The analysis was performed in the standard mode and using argon gas (purity ≥ 99.999%) for the plasma following the manufacturer’s recommendations.
The operating conditions were a nebulizer gas flow rate of 0.92 L/min; an auxiliary gas flow of 1.2 L/min; a plasma gas flow of 15 L/min; a lens voltage of 7.25 V; a radiofrequency power of 1100 W; a CeO/Ce ratio of 0.025; and a Ba++/Ba+ ratio of 0.020.
We don’t know exactly what the difference might be, but the fact that they mention that “considering that samples have a very complex composition with large organic matter content, the total digestion of the matrix is mandatory to assure complete metal solubility” suggests that they were aware of limitations of normal digestion methods that other teams may have been unaware of. And none of the other papers seem to have used pneumatic nebulization, so maybe that makes the difference and lets you squeeze all the lithium out of a pumpkin.
yeah that’s one way to do it
Another difference we notice is that while Voica, Roba, and Iordache do use ICP-MS and the same kind of digestion as the TDS studies, they don’t test for anything else — they’re just measuring lithium. So maybe the thing that torpedoes the ICP-MS measurements is something about testing for lots of elements at the same time — a trait shared by all the TDS studies, Saribal (2019), and Kalisz et al. (2019), but not by Seidel et al. (2020) (the beverages paper) and not by Voica, Roba, and Iordache (2020).
A final (we promise) paper that helps triangulate this problem is Nabrzyski & Gajewska (2002), which looked at lithium in food samples from Gdańsk, Poland. They found an average of only 0.07 mg/kg in milk products and of only 0.11 mg/kg in smoked fish. This is not quite as low as the TDS studies but it’s much lower than everything else. And weirdly, they didn’t use ICP-MS, they used AAS. But they did digest their foods in nitric acid. Here’s the method:
The representative samples were dry ashed in quartz crucibles and the ash was treated with suitable amounts of conc. HCl and a few drops of conc. HNO3. The obtained sample solution was then used for the determination of Sr, Li and Ca by the flame atomic absorption spectrometry (AAS) method. Ca and Li were determined using the air-acetylene flame and Sr with nitrous oxide-acetylene flame, according to the manufacturer’s recommendations.
So maybe this seems like more evidence that it’s something about the digestion process in particular, though this paper could also just be a weird outlier. It’s hard to tell without more tests.
Close Look at ICP-MS
We seem to have pretty clear evidence that ICP-MS, maybe especially in combination with microwave digestion / digestion with nitric acid, gives much lower numbers for lithium in food samples than every other analysis technique we’ve seen.
So we wanted to know if there was any other reason to suspect that ICP-MS might give bad readings for lithium in particular. We did find a few things of interest.
If you check out the Wikipedia page for ICP-MS, lithium is mentioned as being just on the threshold of what the ICP-MS can detect. This makes sense because lithium is unusual, much smaller than all other other metals. See for example: “The ICP-MS allows determination of elements with atomic mass ranges 7 to 250 (Li to U)” and “electrostatic plates can be used in addition to the magnet to increase the speed, and this, combined with multiple collectors, can allow a scan of every element from Lithium 6 to Uranium Oxide 256 in less than a quarter of a second.”
While ICP-MS is generally considered the gold standard for spectral analysis, like all methodologies, it has some limitations. Given that lithium is at the bottom of the range to begin with, it seems plausible to us that even small irregularities in the analysis might push it “off the end” of the range, disrupting detection. There’s more likely to be problems with lithium than with the other elements the TDS papers were analyzing.
We noticed that the 1999 UK TDS study had this to say about the upper limits of detection for ICP-MS: “The platinum group elements are notoriously difficult to analyse, as the concentrations, generally being close to the limits of detection, can be prone to some interferences in complex matrices when measured by ICP-MS.”
Now lithium is on the low end of the range, not the high range. But since the UK TDS study authors were concerned that elements “close to the limits of detection, can be prone to some interferences in complex matrices when measured by ICP-MS”, it seems like interference might be an issue. This shows that “fall of the end of the range” is a real concern with ICP-MS analysis. So ICP-MS may be the gold standard for spectral analysis, but it falls short of being the platinum standard.
There’s also something interesting in Anke’s 2003 paper, where he says:
Lithium may be determined in foods and biological samples with the same techniques employed for sodium and potassium. However, the much lower levels of lithium compared with these other alkali metals, mean that techniques such as flame photometry often do not show adequate sensitivity. Flame (standard addition procedure) or electrothermal atomic absorption spectrophotometry are the most widely used techniques after wet or dry ashing of the sample. Corrections may have to be made for background/matrix interferences. Inductively coupled plasma atomic emission spectrometry is not very sensitive for this very low-atomic-weight element.
As usual with Anke this is very cryptic, and inductively coupled plasma atomic emission spectrometry (ICP-AES) isn’t the same technique as ICP-MS. But even so, Anke’s comment does suggest that there might be some limitations on ICP methods when measuring lithium, that they might not be very sensitive.
We also found an article by environmental testing firm WETLAB which describes several problems you can run into doing lithium analysis, including that “[w]hen Li is in a matrix with a large number of heavier elements, it tends to be pushed around and selectively excluded due to its low mass. This provides challenges when using Mass Spectrometry.” They also indicate that “ICP-MS can be an excellent option for some clients, but some of the limitations for lithium analysis are that lithium is very light and can be excluded by heavier atoms, and analysis is typically limited to <0.2% dissolved solids, which means that it is not great for brines.” We’re not looking at brines, but this may also hold true for digested food samples. WETLAB indicates their preferred methodology is ICP-OES.
Conclusion
Maybe nobody knows what’s going on here! It’s looking more and more like this is just a question that’s sitting out on the limits of human knowledge. It’s a corner case — to know why some papers find high levels and other papers find really low levels, you might have to jointly be an expert on ICP-MS, lithium analysis, and chemical analysis in food. Manfred Anke is the only guy we’ve ever heard of who seemed like he might be all three, and he’s been dead for more than ten years. So maybe there’s no one alive who knows the answer. But that’s why we do science, right?
In any case, we’re very glad to know about this complexity early on in the process of planning our own survey, since we had also been planning to use ICP-MS! We had assumed that ICP-MS was the best technique and that it would certainly give us the most accurate numbers. But measurement is rarely that simple — we should have been more careful, and now we will be.
How do we figure out what’s going on here, and what technique we should use? We could go back and pore over the literature in even more detail. But that would take a long time, and would probably be inconclusive. Much better is to simply test a bunch of foods using different techniques, pit ICP-MS against techniques like AAS and flame photometry, and see if we can figure out what’s going on. So that’s what we’re gonna do.
But those are clinical doses, and it seems like the doses you’re getting from the environment are generally much smaller. There’s usually some lithium in modern drinking water, and there’s more lithium in drinking water now than there used to be. It seems to get into the water supply from things like drilled water wells, fracking, and fossil fuel prospecting, transport, and disposal. But even with all these sources of contamination, the dose you’re getting from your drinking water is relatively low, probably not much more than 0.2 mg per day. If you live right downstream from a coal plant, or you’re chugging liter bottles of mineral water on the regular, you could maybe get 5 or 10 mg/day. But no one is getting 1000 mg/day or even 300 mg/day from their drinking water.
So what gives?
Effects of Trace Doses
One possibility is that small amounts of lithium are enough to cause obesity, at least with daily exposure.
This is plausible for a few reasons. There’s lots of evidence (or at least, lots of papers) showing psychiatric effects at exposures of less than 1 mg (see for example meta-analysis, meta-analysis, meta-analysis, dystopian op-ed). If psychiatric effects kick in at less than 1 mg per day, then it seems possible that the weight gain effect would also kick in at less than 1 mg.
There’s also the case study of the Pima in the 1970s. The Pima are a group of Native Americans who live in the American southwest, particularly around the Gila River Valley, and they’re notable for having high rates of obesity and diabetes much earlier than other groups. They had about 0.1 mg/L in their water by the 1970s (which was 50x the national median at the time), for a dose of only about 0.2-0.3 mg per day, and were already about 40% obese. All this makes the trace lithium hypothesis seem pretty reasonable.
Unfortunately, no one knows where the weight gain effects of lithium kick in. As far as we can tell, there’s no research on this question. It might cause weight gain at doses of 10 mg, or 1 mg, or 0.1 mg. Maybe 0.5 mg a week on average is enough to make some people really obese. We just don’t know.
Some people in the nootropics community take lithium, often in the form of lithium orotate (they use orotate rather than other compounds because it’s available over-the-counter), as part of their stacks. Based on community posts like this, this, and this, the general doses nootropics enthusiasts are taking are in the range of 1-15 mg per day.
We haven’t done a systematic review of the subreddit (but maybe you should, that would be a good project for someone) but they seem to report no effects or mild positive effects at 1 or 2 mg lithium orotate and brain fog and fatigue at 5 mg lithium orotate and higher. Some of them report weight gain, even on doses this low. The fact that a couple extra mg might be enough to push you over the line suggests that the weight gain tipping point is somewhere under 10 mg, maybe a lot under. And for what it’s worth, all of this is consistent with the only randomized controlled trial examining the effects of trace amounts of lithium which found results at just 0.4 mg a day.
Clinical and Subclinical Doses
Another possibility is that people really ARE getting unintended clinical doses of lithium. We see two reasons to think that this might be possible.
#1: Doses in the Mirror may be…
The first is that clinical doses are smaller than they appear.
When a doctor prescribes you lithium, they’re always giving you a compound, usually lithium carbonate (Li2CO3). Lithium is one of the lightest elements, so by mass it will generally be a small fraction of any compound it is part of. A simple molecular-weight calculation shows us that lithium carbonate is only about 18.7% elemental lithium. So if you take 1000 mg a day of lithium carbonate, you’re only getting 187.8 mg/day of the active ingredient.
The little purple orbs are the pharmacologically active lithium ions, everything else is non-therapeutic carbonate
For bipolar and similar disorders, lithium carbonate has become such a medical standard that people usually just refer to the amount of the compound. It’s very unusual for an ion to be a medication, so this nuance is one that some doctors/nurses don’t notice. It’s pretty easy to miss. In fact, we missed it too until we saw this reddit comment from u/PatienceClarence/, which begins, “First off we need to differentiate between the doses of lithium orotate vs elemental lithium. For example, my dosage was 130 mg orotate which would give me 5 mg ‘pure’ lithium…”
Elemental lithium is what we really care about, and when we look at numbers from the USGS or serum samples or whatever, they’re all talking about elemental lithium. When we say people get 0.1 mg/day from their water, or when we talk about getting 3 mg from your food, that’s milligrams of elemental lithium. When we say that your doctors might give you 600 mg per day, that’s milligrams lithium carbonate — and only 112.2 milligrams a day of elemental lithium. With this in mind, we see that the dose of elemental lithium is always much lower than the dose as prescribed.
A high clinical dose is 600 mg lithium carbonate three times a day (for a total of 1800 mg lithium carbonate or about 336 mg elemental lithium), but many people get clinical doses that are much smaller than this. Low doses seem to be more like 450 mg lithium carbonate per day (about 84 mg/day elemental lithium) or even as little as 150 mg lithium carbonate per day (about 28 mg/day elemental lithium).
Once we take the fact that lithium is prescribed as a compound into account, we see that the clinical dosage is really closer to something like 300 mg/day for a high dose and 30 mg/day for a low dose. So at this point we just need to ask, is it possible that people might occasionally be getting 30 mg/day or more lithium in the course of their everyday lives? Unfortunately we think the answer is yes.
#2: Concentration in Food
The other reason to think that modern people might be getting clinical or subclinical doses on the regular is that there’s clear evidence that lithium concentrates in some foods.
Again, consider the Pima. The researchers who tested their water in the 1970s also tested their crops. While most crops were low in lithium, they found that one crop, wolfberries, contained an incredible 1,120 mg/kg.
By our calculations, you could easily get 15 mg of lithium in a tablespoon of wolfberry jelly. If the Pima ate one tablespoon a day, they would be getting around 100 times more lithium from that tablespoon than they were getting from their drinking water.
The wolfberries in question (Lycium californium) are a close relative of goji berries (Lycium barbarum or Lycium chinense). The usual serving size of goji berries is 30 grams, which if you were eating goji berries like the ones the Pima were eating, would provide about 33.6 mg of lithium. This already puts you into clinical territory, a little more than someone taking a 150 mg tablet of lithium carbonate.
If you had a hankering and happened to eat three servings of goji berries in one day, you would get just over 100 mg of lithium from the berries alone. We don’t know how much people usually eat in one go, but it’s easy enough to buy a pound (about 450 g) of goji berries online. We don’t have any measurements of how much lithium are in the goji berries you would eat for a snack, but if they contained as much lithium as the wolfberries in the Gila River Valley, the whole 1 lb package would contain a little more than 500 mg of lithium.
So. Totally plausible that some plants concentrate 0.1 mg/L lithium in water into 1,120 mg/kg in the plant, because Sievers & Cannon have measurements of both. Totally plausible that you could get 10 or even 100 mg if you’re eating a crop like this. So now we want to know, are there other crops that concentrate lithium? And if so, what are they?
In this review, we take a look at the existing literature and try to figure out how much lithium there is in different foods. What crops does it concentrate in? Is there any evidence that foods are further contaminated in processing or transport? There isn’t actually all that much work on these questions, but we’ll take a look at what we can track down.
Let’s not bury the lede: we find evidence of subclinical levels of lithium in several different foods. But most of the sources that report these measurements are decades old, and none of them are doing anything like an exhaustive search. That’s why at the end of this piece, we’re going to talk a little bit about our next project, a survey of lithium concentrations in foods and beverages in the modern American food supply.
Because of this, our goal is not to make this post an exhaustive literature review; instead, our goal is to get a reasonable sense of how much lithium is in the food supply, and where it is. When we do our own survey of modern foods, what should we look at first? This review is a jumping off point for our upcoming empirical work.
Context for the Search
But first, a little additional context.
There are a few official estimates of lithium consumption we should consider (since these are in food and water, all these numbers should be elemental lithium). This review paper from 2002 says that “the U.S. Environmental Protection Agency (EPA) in 1985 estimated the daily Li intake of a 70 kg adult to range from [0.650 to 3.100 mg].” The source they cite for this is “Saunders, DS: Letter: United States Environmental Protection Agency. Office of Pesticide Programs, 1985”, but we can’t find the original letter. As a result we don’t really know how accurate this estimate is, but it suggests people were getting about 1-3 mg per day in 1985.
These numbers are backed up by some German data which appear originally to be from a paper from 1991, which we will discuss more in a bit:
In Germany, the individual lithium intake per day on the average of a week varies between [0.128 mg/day] and [1.802 mg/day] in women and [0.139] and [3.424 mg/day] in men.
The paper also includes histograms of those distributions:
Both of these say “mg/day” but we’re pretty sure that’s 1000x too high and they should say “µg/day”. If it were mg/day we think many of these people would be dead?
We want to call your attention to the shape of both of these distributions, because the shape is going to be important throughout this review. Both distributions are pretty clearly lognormal, meaning they peak early on but then have a super long tail off to the right. For example, most German men in this study were getting only about 0.2 to 0.4 mg of lithium per day, but twelve of them were getting more than 1 mg a day, and five of them were getting more than 2 mg a day. At least one person got more than 3 mg a day. And this paper is looking at a pretty small group of Germans. If they had taken a larger sample, we would probably see a couple people who were consuming even more. You see a similar pattern for women, just at slightly lower doses.
We expect pretty much every distribution we see around food and food exposure to be lognormal. The amount people consume per day should usually be lognormally distributed, like we see above. The distribution of lithium in any foods and crops will be lognormal. So will the distribution of lithium levels in water sources. For example, lithium levels in that big USGS dataset of groundwater samples we always talk about are distributed like this:
With scatterplot because those outliers are basically invisible on the histogram
Again we see a clear lognormal distribution. Most groundwater samples they looked at had less than 0.2 mg/L lithium. But five had more than 0.5 mg/L and two had more than 1 mg/L.
This is worth paying close attention to, because when a variable is lognormally distributed, means and medians will not be very representative. For example, in the groundwater distribution you see above, the median is .0055 mg/L and the mean is .0197 mg/L.
These sound like really tiny amounts, and they are! But the mean and the median do not tell anywhere close to the full story. If we keep the long tail of the distribution in mind, we see that about 4% of samples contain more than 0.1 mg/L, about 1% of samples contain more than 0.2 mg/L, and of course the maximum is 1.7 mg/L.
This means that about 4% of samples contain more than 20x the median, about 1% of samples contain more than 40x the median, and the maximum is more than 300x the median.
Put another way, about 4% of samples contain more than 5x the mean, about 1% of samples contain more than 10x the mean, and the maximum is more than 80x the mean.
We should expect similar distributions everywhere else, and we should expect means and medians to consistently be misleading in the same way. So if we find a crop with 1 mg/kg of lithium on average, that suggests that the maximum in that crop might be as high as 80 mg/kg! If this math is even remotely correct, you can see why crops that appear to have a low average level of lithium might still be worth empirically testing.
Another closely related point: that USGS paper only found those outliers because it’s a big survey, 4700 samples. Small samples will be even more misleading. Let’s imagine the USGS had taken a small number of samples instead. Here are some random sets of 6 observations from that dataset:
0.044, 0.007, 0.005, 0.036, 0.001, 0.002
0.002, 0.028, 0.005, 0.001, 0.009, 0.001
0.003, 0.006, 0.002, 0.001, 0.001, 0.006
We can see that small samples ain’t representative. If we looked at a sample of six US water sources and found that all of them contained less than 0.050 mg/L of lithium, we would miss that some US water sources out there contain more than 0.500 mg/L. In this situation, there’s no substitute for a large sample size (or, the antidote is to be a little paranoid about how long the tail is).
So if we looked at a sample of (for example) six lemons, and found that all of them contained less than 10 mg/kg of lithium, we might easily be missing that there are lemons out there that contain more than 100 mg/kg.
In any case, the obvious lognormal distribution fits really well with the kind of bolus-dose explanation we discussed with JP Callaghan, who said:
My thought was that bolus-dosed lithium (in food or elsewhere) might serve the function of repeated overfeeding episodes, each one pushing the lipostat up some small amount, leading to overall slow weight gain. … I totally vibe with the prediction that intake would be lognormally distributed. … lognormally distributed doses of lithium with sufficient variability should create transient excursions of serum lithium into the therapeutic range.
In the discussion with JP Callaghan, we also said:
Because of the lognormal distribution, most samples of food … would have low levels of lithium — you would have to do a pretty exhaustive search to have a good chance of finding any of the spikes. So if something like this is what’s happening, it would make sense that no one has noticed.
What we’re saying is that even if people aren’t getting that much lithium on average, if they sometimes get huge doses, that could be enough to drive their lipostat upward. If we take that model seriously, the average amount might not not be the real driver, and we should focus on whether there are huge lithium bombs out there, and how often you might encounter them. Or it could be even more complicated! Maybe some foods give you repeated moderate doses, and others give you rare megadoses.
Two final notes before we start the review:
First, if two sources disagree — one says strawberries are really high in lithium and the other says that strawberries are really low in lithium, or something — we should keep in mind that disagreement might mean something like “the strawberries were grown in different conditions (i.e. one batch was grown in high-lithium soil and the other batch wasn’t)” or even “apparently identical varieties of strawberries concentrate lithium differently”. There isn’t a simple answer to simple-sounding questions like “how much lithium is in a strawberry” because reality is complicated and words make it easy to hide that complexity without thinking about it.
Second, we want to remind you that whatever dose causes obesity, lithium is also a powerful sedative with well-known psychiatric effects. If you’re getting doses up near the clinical range, it’s gonna zonk you out and probably stress your kidneys.
Ok. What crops concentrate lithium?
Lithium Concentration
Unfortunately we couldn’t find several of the important primary sources, so in a number of places, we’ve had to rely on review papers and secondary sources. We’re not going to complain “we couldn’t find the primary source” every time, but if you’re ever like “why are they citing a review paper instead of the original paper?” this is probably why.
We should warn you that these sources can be a little sloppy. Important tables are labeled unclearly. Units are often given incorrectly, like those histograms above that say mg/day when they should almost certainly say µg/day. When you double-check their citations, the numbers don’t always match up. For example, one of the review papers said that a food contained 55 mg/kg of lithium. But when we double-checked, their source for that claim said just 0.55 mg/kg in that food. So we wish we were working with all the primary sources but we just ain’t. Take all these numbers with a grain of salt.
It’s worth noting just how concerned some of these literature reviews sound. Shahzad et al. (2016) say in their abstract, “The contamination of soil by Li is becoming a serious problem, which might be a threat for crop production in the near future. … lack of considerable information about the tolerance mechanisms of plants further intensifies the situation. Therefore, future research should emphasize in finding prominent and approachable solutions to minimize the entry of Li from its sources (especially from Li batteries) into the soil and food chain.”
Older reviews include The lithium contents of some consumable items by Hullin, Kapel, and Drinkall — a 1969 paper which includes a surprisingly lengthy review of even older sources, citing papers as far back as 1917. Sadly we weren’t able to track down most of these older sources, and the ones we could track down were pretty vague. Papers from the 1930s just do not give all that much detail. Still, very cool to have anything this old.
There’s also Shacklette, Erdman, Harms, and Papp (1978), Trace elements in plant foodstuffs, a chapter from (as far as we can tell) a volume called “Toxicity of Heavy Metals in the Environment”, which is part of a series of reference works and textbooks called “HAZARDOUS AND TOXIC SUBSTANCES”. It was sent to us by a very cool reader who refused to accept credit for tracking it down. If you want to see this one, email us.
A bunch of the best and most recent information comes from a German fella named Manfred Anke, who published a bunch of papers on lithium in food in Germany in the 1990s and 2000s. He did a ton of measurements, so you will keep seeing his name throughout. Unfortunately the papers we found from Anke mostly reference measurements from earlier work he did, which we can’t find. Sadly he is dead so we cannot ask him for more detail.
From Anke, in case anyone can track them down, we’d especially like to see a couple papers from the 1990s. Here they are exactly as he cites them:
Anke’s numbers are very helpful, but we think they are a slight underestimation of what is in our food today. We’re pretty sure lithium levels in modern water are higher than levels in the early 1990s, and we’re pretty sure lithium levels are higher in US water than in water in Germany. In a 2005 paper, Anke says: “In Germany, the lithium content of drinking water varies between 4 and 60 µg/L (average : 10 µg/L).” Drinking water in the modern US varies between undetectable and 1700 µg/L (1.7 mg/L), and even though that 1700 is an outlier, about 8% of US groundwater samples contain more than 60 µg/L, the maximum Anke gives for Germany. The mean for US groundwater is 19.7 µg/L, compared to the 10 µg/L Anke reports.
So the smart money is that Anke’s measurements are probably all lower than the levels in modern food, certainly lower than the levels in food in the US.
Here’s another thing of interest: in one paper Anke estimates that in 1988 Germany, the average daily lithium intake for women was 0.373 mg, and the average daily lithium intake for men was 0.432 mg (or something like that; it REALLY looks like he messed up labeling these columns, luckily the numbers are all pretty similar). By 1992, he estimates that the average daily lithium intake for women was 0.713 mg, and the average daily lithium intake for men was 1.069 mg. He even explicitly comments, saying, “the lithium intake of both sexes doubled after the reunification of Germany and worldwide trade.”
That last bit about trade suggests he is maybe blaming imported foods with higher lithium levels, but it’s not really clear. He does seem to think that many foreigners get more lithium than Germans do, saying, “worldwide, a lithium intake for adults between [0.660 and 3.420 mg/day] is calculated.”
Anyways, on to actual measurements.
Beverages
Beverages are probably not giving you big doses of lithium, with a few exceptions.
Most drinking water doesn’t contain much lithium, rarely poking above 0.1 mg/L. Some beverages contain more, but not a lot more. The big exception, no surprise, is mineral water.
As usual, Anke and co have a lot to say. The Anke paper from 2003 says, “cola and beer deliver considerable amounts of lithium for humans, and this must be taken into consideration when calculating the lithium balance of humans.”The Anke paper from 2005 says that “amounts of [0.002 to 5.240 mg/L] were found in mineral water. Like tea and coffee, beer, wine and juices can also contribute to the lithium supply.” But the same paper reports a range of just 0.018 – 0.329 mg/L in “beverages”. Not clear where any of these numbers come from, or why they mention beer in particular — the citation appears to be the 1995 Anke paper we can’t find.
In fact, Anke seems to disagree with himself. The 2005 paper mentions tea and coffee contributing to lithium exposure. But the 2003 paper says, “The total amount in tea and coffee, not their water-soluble fraction in the beverage, was registered. Their low lithium content indicates that insignificant amounts of lithium enter the diet via these beverages.”
This 2020 paper, also from Germany, finds a weak relationship for beer and wine and a strong relationship for tea with plasma concentrations for lithium. We think there are a lot of problems with this method (the serum samples are probably taken fasted, and lithium moves through the body pretty quickly) but it’s interesting.
Franzaring et al. (2016), one of those review papers, has a big figure summarizing a bunch of other sources, which has this to say about some beverages:
For water, 1 ppm is approximately 1 mg/L
So obviously mineral water can contain a lot — if you drank enough, you could probably get a small clinical dose from mineral water alone. On the other hand, who’s drinking a liter of mineral water? Germans, apparently.
This paper from 2000 similarly finds averages of 0.035 and 0.019 mg/L in red wines from northern Spain. This 1994 paper and this 1997 paper both report similar values. We also found this 1988 paper looking at French red wines which suggests a range from 2.61 to 17.44 mg/L lithium. Possibly this was intended to be in µg/L instead of in mg/L? “All results are in milligrams per liter except Li, which is in micrograms per liter” is a disclaimer we’ve seen in more than one of these wine papers.
So it might be good to check, but overall we don’t think you’ll see much more than 0.150 mg/L in your wine, and most of you are hopefully drinking less than a full liter at a time.
She’s just so happy!
The most recent and most comprehensive source for beverages, however, is a 2020 paper called Lithium Content of 160 Beverages and Its Impact on Lithium Status in Drosophila melanogaster. Forget the Drosophila, let’s talk about all those beverages. This is yet another German paper, and they analyzed “160 different beverages comprising wine and beer, soft and energy drinks and tea and coffee infusions … by inductively coupled plasma mass spectrometry (ICP-MS).” And unlike other sources, they give all the numbers — If you want to know how much lithium they found in Hirschbraeu/Adlerkoenig, “Urtyp, hell” or the cola known as “Schwipp Schwapp”, you can look that up.
They find that, aside from mineral water, most beverages in Germany contain very little lithium. Concentration in wine, beer, soft drinks, and energy drinks was all around 0.010 mg/L, and levels in tea and coffee barely ever broke 0.001 mg/L.
The big outlier is the energy drink “Acai 28 Black, energy”, which contained 0.105 mg/L. This is not a ton in the grand scheme of things — it’s less than some sources of American drinking water — but it’s a lot compared to the other beverages in this list. They mention, “it has been previously reported that Acai pulp contains substantial concentrations of other trace elements, including iron, zinc, copper and manganese. In addition to acai extract, Acai 28 black contains lemon juice concentrate, guarana and herb extracts, which possibly supply Li to this energy drink.”
BEWARE
We want to note that beverages in America may contain more lithium, just because American drinking water contains more lithium than German drinking water does. But it’s doubtful that people are getting much exposure from beverages beyond what they get from the water it’s made with.
Basic Foods
We also have a few leads on what might be considered “basic” or “component” foods.
Anke mentions sugars a bit, though doesn’t go into much detail, saying, “honey and sugar are also extremely poor in lithium…. The addition of sugar apparently leads to a further reduction of the lithium content in bread, cake, and pastries.“ At one point he lists the range of “Sugar, honey” as being 0.199 – 0.527 mg/kg, with a mean of 0.363 mg/kg. That’s pretty low.
We also have a little data from the savory side. This paper from 1969 looked at levels in various table salts, finding (in mg/kg):
On the one hand, those are relatively high levels of lithium. On the other hand, who’s eating a kilogram of salt? Even if table salt contains 3 mg/kg, you’re just never gonna get even close to getting 1 mg from your salt.
Plant-Based Foods
It’s clear that plants can concentrate lithium, and some plants concentrate lithium more than others. It’s also clear that some plants concentrate lithium to an incredible degree. This last point is something that is emphasized by many of the reviews, with Shahzad et al. (2016) for example saying, “different plant species can absorb considerable concentration [sic] of Li.”
Plant foods have always contained some lithium. The best estimate we have for preindustrial foods is probably this paper that looked at foods in the Chocó rain forest around 1970, and found (in dry material): 3 mg/kg in breadfruit; 1.5 mg/kg in cacao, 0.4 mg/kg in coconut, 0.25 mg/kg in taro, 0.4 mg/kg in yam, 0.6 mg/kg in cassava, 0.5 mg/kg in plantain fruits, 0.1 mg/kg in banana, 0.3 mg/kg in rice, 0.01 mg/kg in avocado, 0.5 mg/kg in dry beans, and 0.05 mg/kg in corn grains. Not nothing, but pretty low doses overall.
There are a few other old sources we can look at. Shacklette, Erdman, Harms, and Papp (1978) report a paper by Borovik-Romanova from 1965, in which she “reported the Li concentration in many plants from the Soviet Union to range from 0.15 to 5 [mg/kg] in dry material; she reported Li in food plants as follows ([mg/kg] in dry material): tomato, 0.4; rye, 0.17; oats, 0.55; wheat, 0.85; and rice, 9.8.” That’s a lot in rice, but we don’t know if that’s reliable, and we haven’t seen any other measurements of the levels in rice. We weren’t able to track the Borovik-Romanova paper down, unfortunately.
From here, we can try to narrow things down based on the better and more modern measurements we have access to.
Cereals
We haven’t seen very much about levels in cereals / grains / grass crops, but what we have seen suggests very low levels of accumulation.
Borovik-Romanova reported, in mg/kg, “rye, 0.17; oats, 0.55; wheat, 0.85; and rice, 9.8” in 1965 in the USSR. Most of these concentrations are very low. Again, rice is abnormally high, but this measurement isn’t at all corroborated. And since we haven’t been able to find this primary source, there’s a good chance it should read 0.98 instead.
Anke, Arnhold, Schäfer, & Müller (2005) report levels from 0.538 to 1.391 mg/kg in “cereal products”, and in a 2003 paper, say “the different kinds of cereals grains are extremely lithium-poor as seeds.” Anke reports slightly lower levels in derived products like “bread, cake”.
There’s also this unusual paper on corn being grown hydroponically in solutions containing various amounts of lithium. They find that corn is quite resistant to lithium in its water, actually growing better when exposed to some lithium, and only seeing a decline at concentrations around 64 mg/L. (“the concentration in solution ranging from 1 to 64 [mg/L] had a stimulating effect, whereas a depression in yielding occurred only at the concentrations of 128 and 256 [mg/L].”) But the plant also concentrates lithium — even when only exposed to 1 mg/L in its solution, the plant ends up with an average of about 11 mg/kg in dry material. Unfortunately they don’t seem to have measured how much ends up in the corn kernels, or maybe they didn’t let the corn develop that far. Seems like an oversight. (Compare also this similar paper from 2012.)
Someone should definitely double-check those numbers on rice to be safe, and corn is maybe a wildcard, but for now we’re not very worried about cereal crops.
Leafy Vegetables
A number of sources say that lithium tends to accumulate in leaves, suggesting lithium levels might be especially high in leafy foods. While most of us are in no danger of eating kilograms of cabbage, it’s worth looking out for.
In particular, Robinson et al. (2018) observed significant concentration in the leaves of several species as part of a controlled experiment. They planted beetroot, lettuce, black mustard, perennial ryegrass, and sunflower in controlled environments with different levels of lithium exposures. “When Li was added to soil in the pot experiment,” they report, “there was significant plant uptake … with Li concentrations in the leaves of all plant species exceeding 1000 mg/kg (dry weight) at Ca(NO3)2-extractable concentrations of just 5 mg/kg Li in soil, representing a bioaccumulation coefficient of >20.” For sunflowers in particular, “the highest Li concentrations occurred in the bottom leaves of the plant, with the shoots, roots and flowers having lower concentrations.”
Obviously this is reason for concern, but these are plants grown in a lab, not grown under normal conditions. We want to check this against actual measurements in the food supply.
Hullin, Kapel, and Drinkall (1969) report that an earlier source, Bertrand (1943), “found that the green parts of lettuce contained 7.9 [mg/kg] of lithium.” They wanted to follow up on this surprisingly high concentration, so they tested some lettuce themselves, finding:
This pretty clearly contradicts the earlier 7.9 mg/kg, though the fact that lettuce can contain up to 2 mg/kg is still a little surprising. This could be the result of lettuce being grown in different conditions, the lognormal distribution, etc., but even so it’s reassuring to see that not all lettuce in 1969 contained several mg per kg.
In this study from 1990, the researchers went and purchased radish, lettuce and watercress at the market in Brazil, and found relatively high levels in all of them:
Let’s also look at this modern table that reviews a couple more recent sources, from Shahzad et al.:
FW = Fresh Weight and DM = Dry Matter, we think?
None of these are astronomical, but it’s definitely surprising that spinach contains more than 4 mg/kg and celery and chard both contain more than 6 mg/kg, at least in these measurements.
So not to sound too contrarian but, maybe too many leafy greens are bad for your health.
This is a wide range, and a pretty high ceiling. But as usual, Anke is much vaguer than we might hope. He gives some weird hints, but no specific measurements. In the 2003 paper, Anke says, “as a rule, fruits contain less lithium than vegetative parts of plants (vegetables). Lemons and apples contained significantly more lithium, with about 1.4 mg/kg dry matter, than peas and beans.”
More specific numbers have been hard to come by. We’ve found a pretty random assortment, like how Shahzad et al. report that “in a hydroponic experiment, Li concentration in nutrient solution to 12 [mg/L], increased cucumber fruit yield, fruit sugar, and ascorbic acid levels, but Li did not accumulate in the fruit (Rusin, 1979).” It’s interesting that cucumbers survive just fine in water containing up to 12 mg/L, and that suggests that lithium shouldn’t accumulate in cucumbers under any realistic water levels. But cucumbers are not a huge portion of the food supply.
What we do see all the time is sources commenting on how citrus plants are very sensitive to lithium. Anke says, “citrus trees are the most susceptible to injury by an excess of lithium, which is reported to be toxic at a concentration of 140–220 p.p.m. in the leaves.” Robinson et al. (2018) say, “citing numerous sources, Gough et al. (1979) reported a wide variation in plant tolerance to Li; citrus was found to be particularly sensitive, whilst cotton was more tolerant.” Shahzad et al. say, “Bradford (1963) found reduced and stunted growth of citrus in southern California, U.S.A., with the use of highly Li-contaminated water for irrigation. … Threshold concentrations of Li in plants are highly variable, and moderate to severe toxic effects at 4–40 mg Li kg−1 was observed in citrus leaves (Kabata-Pendias and Pendias, 1992).” This Australian Water Quality Guidelines for Fresh and Marine Waters document says, “except for citrus trees, most crops can tolerate up to 5 mg/L in nutrient solution (NAS/NAE 1973). Citrus trees begin to show slight toxicity at concentrations of 0.06–0.1 mg/L in water (Bradford 1963). Lithium concentrations of 0.1–0.25 mg/L in irrigation water produced severe toxicity symptoms in grapefruit … (Hilgeman et al. 1970)”.
All tantalizing, but we can’t get access to any of those primary sources. For all we know this is a myth that’s been passed around the agricultural research departments since the 1960s.
The citrus is tantalizing, get it?
Even if citrus trees really are extra-sensitive to lithium, it’s not clear what that means for their fruits. Maybe it means that citrus fruits are super-low in lithium, since the tree just dies if it’s exposed to even a small amount. Or maybe it means that citrus fruits are super-high in lithium — maybe citrus trees absorb lithium really quickly and that’s why lithium kills them at relatively low levels.
So it’s interesting but at this point, the jury is out on citrus.
Nightshades
Multiple sources mention that the Solanaceae family, better known as nightshades, are serious concentrators of lithium. Hullin, Kapel, and Drinkall mention that even in the 1950s, plant scientists were aware that nightshades are often high in lithium. Anke, Schäfer, & Arnhold (2003) mention, “Solanaceae are known to have the highest tolerance to lithium. Some members of this family accumulate more than 1000 p.p.m. lithium.” Shacklette, Erdman, Harms, and Papp (1978) even mention a “stimulating effect of Li as a fertilizer for certain species, especially those in the Solanaceae family.”
Shahzad et al. (2016) say, “Schrauzer (2002) and Kabata-Pendias and Mukherjee (2007) noted that plants of Asteraceae and Solanaceae families showed tolerance against Li toxicity and exhibited normal plant growth,” and, “some plants of the Solanaceae family, when grown in an acidic climatic zone accumulate more than 1000 mg/kg Li.” We weren’t able to track down most of their sources for these claims, but we did find Schrauzer (2002). He mentions that Cirsium arvense (creeping thistle) and Solanum dulcamara (called things like fellenwort, felonwood, poisonberry, poisonflower, scarlet berry, and snakeberry; probably no one is eating these!) are notorious concentrators of lithium, and he repeats the claim that some Solanaceae accumulate more than 1000 mg/kg lithium, but it’s not clear what his source for this was.
Hullin, Kapel, and Drinkall mention in particular one source from 1952 that found a range of 1.8-7.96 [mg/kg] in members of the Solanaceae. 7.9 mg/kg in some nightshades is enough to be concerned, but they don’t say which species this measurement comes from.
The finger seems to be pointing squarely at the Solanaceae — but which Solanaceae? This family is huge. If you know anything about plants, you probably know that potatoes and tomatoes are both nightshades, but you may not know that nightshades also include eggplants, the Capsicum (including e.g. chili peppers and bell peppers), tomatillos, some gooseberries, the goji berry, and even tobacco.
We’ve already seen how wolfberries / goji berries can accumulate crazy amounts under the right circumstances, which does make this Solanaceae thing seem even more plausible.
Anke, Schäfer, & Arnhold (2003) mention potatoes in particular in one section on vegetable foods, saying: “All vegetables and potatoes contain > 1.0 mg lithium kg−1 dry matter.” There isn’t much detail, but the paper does say, “peeling potatoes decreases their lithium content, as potato peel stores more lithium than the inner part of the potato that is commonly eaten.”
That same paper that tries to link diet to serum lithium levels does claim to find that a diet higher in potatoes leads to more serum lithium, but we still think this paper is not very good. If you look at table 4, you see that there’s not actually a clear association between potatoes and serum levels. Table 5 says that potatoes come out in a regression model, but it’s a bit of an odd model and they don’t give enough detail for us to really evaluate it. And again, these serum concentrations were taken fasted, so they didn’t measure the right thing.
It’s much better to just measure the lithium in potatoes directly. Anke seems to have done this in the 1990s, but he’s not giving any details. We’ll have to go back all the way to 1969, when Hullin, Kapel, and Drinkall included three varieties of potatoes in their study (numbers in mg/kg):
These potatoes, at least, are pretty low in lithium. The authors do specifically say these were peeled potatoes, which may be important in the light of Anke’s comment about the peels. These numbers are pretty old, and modern potatoes probably are exposed to more lithium. But even so, these potatoes do not seem to be mega-concentrators, and Hullin, Kapel, and Drinkall did find some serious concentrators even back in 1969.
This is especially interesting to us because it provides a little support for the idea that the potato diet might cause weight loss by reducing your lithium intake and forcing out the lithium already in your system with a high dose of potassium, or something. At the very least, it looks like you’d get less lithium in your diet if you lived on only potatoes than if you somehow survived on only lettuce (DO NOT TRY THE LETTUCE DIET).
Apparently the nightshade family’s tendency to accumulate lithium does not include the potatoes (unless the peeling made a huge difference?). This suggests that the high levels might have come from some OTHER nightshade. Obviously we have already seen huge concentrations in the goji berry (or at least, a close relative). But what about other nightshades, like tomatoes, eggplant, or bell peppers?
Hullin, Kapel, and Drinkall do frustratingly say, “[The lithium content] of the tomato will be reported elsewhere.” But they don’t discuss it beyond that, at least not in this paper. We’ll have to look to other sources.
Shacklette et al. report: “Borovik-Romanova reported the Li concentration in [dry material] … tomato, 0.4 [mg/kg].” This is not much, though these numbers are from 1965, and from the USSR.
A stark contrast can be found in one of Anke’s papers, where they state, “Fruits and vegetables supply 1.0 to 7.0 mg Li/kg food DM. Tomatoes are especially rich in Li (7.0 mg Li/kg DM).”
This is a lot for a vegetable fruit! It occurs to us that tomatoes are pretty easy to grow hydroponically, and you could just dose distilled water with a known amount of lithium. If any of you are hydroponic gardeners and want to try this experimentally, let us know!
But tomatoes are obviously beaten out by wolfberries/goji berries, and they also can’t compare to this dark horse nightshade: tobacco.
SURPRISE
That’s right — Hullin, Kapel, and Drinkall (1969) also measured lithium levels in tobacco. They seem to have done this not because it’s another nightshade, but because previous research from the 1940s and 1950s had found that lithium concentrations in tobacco were “extraordinarily high”. For their own part, Hullin and co. found (mg/kg in ash):
This is a really interesting finding, and in a crop we didn’t expect people to examine, since tobacco isn’t food.
At the same time, measuring ash is kind of cheating. Everything organic will be burned away in the cigarette or pipe, so the level of any salt or mineral will appear higher than it was in the original substance. As a result, we don’t really know the concentration in the raw tobacco. This is also the lithium that’s left over in the remnants of tobacco after it’s been smoked, so these measurements are really the amount that was left unconsumed, which makes it difficult to know how much might have been inhaled. Even so, the authors think that “the inhalation of ash during smoking could provide a further source of this metal”.
This is also interesting in combination with the fact that people with psychiatric disorders often seem to self-medicate with tobacco. Traditionally schizophrenics are the ones drawn to being heavy smokers, but smoking is disproportionately common in bipolar patients as well. Researchers have generally tried to explain this in terms of nicotine, which we think of as being the active ingredient in tobacco, but given these lithium levels, maybe psychiatric patients smoke so much because they’re self-medicating with the lithium? Or maybe lithium exposure through the lungs causes schizophrenia and bipolar disorder? (For comparison, see Scott Alexander discussing a similar idea.)
We didn’t find measurements for any other nightshades, but we hope to learn more in our own survey.
Animal-Based Foods
Pretty much everything we see suggests that animal products contain more lithium on average than plant-based foods. This makes a lot of general sense because of biomagnification. It also makes particular sense because many food animals consume huge quantities of plant stalks and leaves, and as we’ve just seen, stalks and leaves tend to accumulate more lithium than other parts of the plants.
toxic waste make bear sad
But the bad news is that, like pretty much everything else, levels in animal products are poorly-documented and we have to rely heavily on Manfred Anke again. He’s a good guy, we just wish — well we wish we had access to his older papers.
It’s like he’s toying with us!!!
Meat
Meat seems to contain a consistently high level of lithium. Apparently based on measurements he took in the 1990s, Anke calculates that meat products contain an average of about 3.2 mg/kg, and he gives a range of 2.4 to 3.8 mg/kg.
In Anke, Arnhold, Schäfer, & Müller (2005) he elaborates just a little, saying, “Poultry, beef, pork and mutton contain lithium concentrations increasing in that order.”
On average, eggs, meat, sausage, and fish deliver significantly more lithium per kg of dry matter than most cereal foodstuffs. Eggs, liver, and kidneys of cattle had a mean lithium content of 5 mg/kg. Beef and mutton contain more lithium than poultry meat. Green fodder and silage consumed by cattle and sheep are much richer in lithium than the cereals largely fed to poultry. Sausage and fish contain similar amounts of lithium to meat.
Beyond this, we haven’t found much detail to report. And even Anke can’t keep himself from mentioning how meat plays second fiddle to something else:
… Poultry, beef, pork and mutton contain lithium concentrations increasing in that order. Most lithium is delivered to humans by eggs and milk (> 7000 µg/kg DM).
Among foods of animal origin, those which have been found to contain lithium include eggs (Press, 1941) and milk (Wright & Papish, 1929; Drea, 1934).
So let’s leave meat behind for now and look at the real heavy-hitters.
Dairy
The earliest report we could find for milk was this 1929 Science publication mentioned by Hullin, Kapel, and Drinkall. But papers this old are pretty terse. It’s only about three-quarters of a page, and the only information they give about lithium is that it is included in the “elements not previously identified but now found to be present” in milk.
Anke can do one better, and estimates an average for “Milk, dairy products” of 3.6 mg/kg with a range of 1.1 to 7.5 mg/kg. This suggests that the concentration in dairy products is pretty high across the board, but also that there’s considerable variation.
Anke explains this in a couple ways. First of all, he says that there were, “significant differences between the lithium content of milk”, and he suggests that milk sometimes contained 10 mg/kg in dry matter. This seems to contradict the range he gives above, but whatever.
He also points out that other dairy products contain less lithium. For example, he says that butter is “lithium-poor”, containing only about 1.2 mg/kg dry matter, which seems to be the bottom of the range for dairy. “In contrast to milk,” he says, “curd cheese and other cheeses only retain 20–55% of lithium in the original material available for human nutrition. The main fraction of lithium certainly leaves cheese and curd cheese via the whey.”
This is encouraging because we love cheese and we are glad to know it is not responsible for poisoning our brains — at least, not primarily. It’s also interesting because 20-55% is a pretty big range; we’d love to know if some cheeses concentrate more than others, or if this is just an indication of the wide variance he mentioned earlier in milk. Not that we really need it, but if you have access to the strategic cheese reserve, we’d love to test historical samples to see if lithium levels have been increasing.
What he suggests about whey is also pretty intriguing. Whey is the main byproduct of turning milk into cheese, so if cheese is lower in lithium than milk is, then whey must be higher. Does this mean whey protein is super high in lithium?
Whey protein display in The Hague, flanked by boars
Eggs
The oldest paper we could find on lithium in eggs is a Nature publication from 1941 called “Spectrochemical Analysis of Eggs”, and it is half a page of exactly that and nothing else. They do mention lithium in the eggs, but unfortunately the level of detail they give is just: “Potassium and lithium were also present [in the eggs] in fair quantity.”
Anke gives his estimate as always, but this time, it’s a little different:
Anke gives an average (we think; he doesn’t label this column anywhere) of 7.3 mg/kg in eggs. This is a lot, more than any other food category he considers. And instead of giving a range, like he does for every other food category, he gives the standard deviation, which is 6.5 mg/kg.
This is some crazy variation. Does that mean some eggs in his sample contained more than 13.8 mg/kg lithium? That’s only one standard deviation above the average, two standard deviations would be 20.3 mg/kg. A large egg is about 50 g, so at two standard deviations above average, you could be getting 1 mg per egg.
That does seem to be what he’s suggesting. But if we assume the distribution of lithium in eggs is normal, we get negative values quickly, and an egg can’t contain a negative amount of lithium.
Because lithium concentrations can’t be negative, and because of the distributions we’ve seen in all the previous examples, we assume the distribution of lithium in eggs must be lognormal instead.
A lognormal distribution with parameters [1.7, .76] has a mean and sd of very close to 7.3 and 6.5, so this is a reasonable guess about the underlying distribution of eggs in Germany in 1991.
Examination of the lognormal distribution with these parameters suggests that the distribution of lithium in eggs (at least in Germany in 1991) looks something like this: The modal egg in this distribution contains about 3 mg/kg lithium. But about 21% of the eggs in this distribution contain more than 10 mg/kg lithium. About 4% contain more than 20 mg/kg. About 1% contain more than 30 mg/kg. About 0.4% contain more than 40 mg/kg. And two out of every thousand contain 50 mg/kg lithium or more.
That’s a lot of lithium for just one egg. What about the lithium in a three-egg omelette?
ACHTUNG
To answer this Omelettenproblem, we started by taking samples of three eggs from a lognormal distribution with parameters [1.7, .76]. That gives us the concentration in mg/kg for each egg in the omelette.
Again, a large egg is about 50 grams. In reality a large egg is slightly more, but we’ll use 50 g because some restaurants might use medium eggs, and because it’s a nice round number.
So we multiply each egg’s mg/kg value by .05 (because 50 g out of 1000 g for a kilogram) to get the lithium it contains in mg, and we add the lithium from all three eggs in that sample together for the total amount in the omelette.
We did this 100,000 times, ending up with a sample of 100,000 hypothetical omelettes, and the estimated lithium dose in each. Here’s the distribution of lithium in these three-egg omelettes in mg as a histogram:
And here it is as a scatterplot in the style of The Economist:
As you can see, most omelettes contained less than 3 mg lithium. In fact, most contained between 0.4 and 1.6 mg.
This doesn’t sound like a lot, but we think it’s pretty crazy. A small clinical dose is something like 30 mg, and it’s nuts to see that you can get easily like 1/10 that dose from a single omelette. Remember that in 1985, the EPA estimated that the daily lithium intake of a 70 kg US adult ranged from 0.650 to 3.1 mg — but by 1991 Germany, you can get that whole dose in a single sitting, from a single dish!
Even Anke estimated that his German participants were getting no more than 3 mg a day from their food. But this model suggests that you can show up at a cafe and say “Kellner, bringen Sie mir bitte ein Omelette” and easily get that 3 mg estimate blown out of the water before lunchtime.
Even this ignores the long tail of the data. The omelettes start to peter out at around 5 mg, but the highest dose we see in this set of 100,000 hypothetical breakfasts was 11.1 mg of lithium in a single omelette.
The population of Germany in 1990 was just under 80 million people. Let’s say that only 1 out of every 100 people orders a three-egg omelette on a given day. This means that every day in early 1990s Germany, about 800,000 people were rolling the dice on an omelette. Let’s further assume that the distribution of omelettes we generated above is correct. If all these things are true, around 8 unlucky people every day in 1990s Germany were getting smacked with 1/3 a clinical dose of lithium out of nowhere. It’s hard to imagine they wouldn’t feel that.
Processed Food
One thing we didn’t see much of in this literature review was measurements of the lithium in processed food.
We’re very interested in seeing if processing increases lithium. But no one seems to have measured the lithium in a hamburger, let alone a twinkie.
Mostly Anke and co find that processed foods are not extreme outliers. “Ready-to-serve soups with meat and eggs were [rich] in lithium,” they say, “whereas various puddings, macaroni, and vermicelli usually contained < 1 mg lithium/kg dry matter. Bread, cake, and pastries are usually poor sources of lithium. On average, they contained less lithium than wheat flour. The addition of sugar apparently leads to a further reduction of the lithium content in bread, cake, and pastries.”
Even in tasty treats, they don’t find much. We don’t know how processed German chocolate was at the time, but they say, “the lithium content of chocolates, chocolate candies, and sweets amounted to about 0.5 mg/kg dry matter. Cocoa is somewhat richer in lithium. The addition of sugar in chocolates reduces their lithium content.”
The only thing that maybe jumps out as evidence of contamination from processing is what they say about mustard. “Owing to the small amounts used in their application,” they begin, “spices do not contribute much lithium to the diet. It is surprising that mustard is relatively lithium-rich, with 3.4 mg/kg dry matter, whereas mustard seed contains extremely little lithium.” Mustard is generally a mixture of mustard seed, water, vinegar, and not much else. We saw in the section on beverages that wine doesn’t contain much lithium, so vinegar probably doesn’t either. Maybe the lithium exposure comes from processing?
Misc
We notice that for many categories of food, we seem to have simply no information. How much lithium is in tree nuts? Peanuts? Melons? Onions? Various kinds of legumes? How much is in major crops like soy? This is part of why we need to do our own survey, to fill these gaps and run a more systematic search.
Meat seems to contain a lot of lithium, but honestly not that much more than things like tomatoes and goji berries. Vegetarians will consume less lithium when they stop eating meat, but if they compensate for not eating meat by eating more fruit, they might actually be worse off. If they compensate by eating more eggs, or picking up whey protein, they’re definitely worse off!
Vegans have it a little better — just by being vegan, they’ll be cutting out the three most reliable sources of lithium in the general diet. As long as they don’t increase their consumption of goji berries to compensate, their total exposure should go down. Hey, it makes more sense than “not eating dairy products gives you psychic powers because otherwise 90% of your brain is filled with curds and whey.”
But even so, a vegan can get as much lithium as a meat-eater if they consume tons of nightshades, so even a vegan diet is not a sure ticket to lithium removal. Not to mention that we have basically no information on plant-based protein sources (legumes, nuts) so we don’t know how much lithium vegans might get from that part of their diet.
In Conclusion
There’s certainly lithium in our food, sometimes quite a bit of lithium. It seems like most people get at least 1 mg a day from their food, and on many days, there’s a good chance you’ll get more.
That said, most of the studies we’ve looked at are pretty old, and none of them are very systematic. Sources often disagree; sample sizes are small; many common foods haven’t been tested at all. The overall quality is not great. We don’t think any of this data is good enough to draw strong conclusions from. Personally we’re avoiding whey protein and goji berries for right now, but it’s hard to get a sense of what might be a good idea beyond that. So as the next step in this project, we’re gonna do our own survey of the food supply.
The basic plan is pretty simple. We’re going to go out and collect a bunch of foods and beverages from American grocery stores. As best as we can, we will try to get a broad and representative sample of the sorts of foods most people eat on a regular basis, but we’ll also pay extra-close attention to foods that we suspect might contain a lot of lithium. Samples will be artificially digested (if necessary) and their lithium concentration will be measured by ICP-MS. All results will be shared here on the blog.
Luckily, we have already secured funding for the first round of samples, so the survey will proceed apace. If you want to offer additional support, please feel free to contact us — with more funding, we could do a bigger survey and maybe even do it faster. We could also get a greenhouse and run some hydroponic studies maybe.
If you’re interested in getting involved in other ways, here are a few things that would be really helpful:
1. If you would be willing to go out and buy an egg or whatever and mail it in to be tested, so we could get measurements from all over the country / the world, please fill out this form.
2. If you work at the FDA or a major food testing lab or Hood Milk or something, or if you’re a grad student with access to the equipment to test your breakfast for lithium and an inclination to pitch in, contact phil@whylome.org to discuss how you might be able to contribute to this project.