Potato Diet Riff Trial: Sign up Now, lol

When we finished the Potato Diet Community Trial, we found ourselves in a pickle. The diet worked — people lost 10.6 lbs on average over only four weeks — and we had basically no idea why. No idea what parts of the protocol were essential, and what parts were optional. 

We had no idea what would make it work better. We had no idea what might make it work worse. And we had no idea of the boundary conditions. We told everyone to avoid dairy, but was that really necessary? Is the potato diet very strict, and you need to stick closely to the original protocol? Or is it very lax? When does it stop working, and why? 

Since then, we have investigated a few of these questions. We tested our main hypothesis about the mechanism (potatoes give you high doses of potassium) and the results provided some support for that hypothesis. We tried a 50% potato AKA half-tato diet based on some case studies, but the results were underwhelming. And we’ve encouraged people to do self-experiments that try to get at the same questions. One example is friend-of-the-blog Krinn, who tried higher doses of potassium and consistently lost weight.

We could keep going like this, running one study at a time. But honestly, that would take forever. The problem is that you can easily come up with 100 different hypotheses for what’s going on. Ok, so you run 100 different studies to test each one. But studies take a long time to run — let’s say 6 months per study. Congratulations, you’ve just locked yourself into 50 years of studying nothing but iterations on the potato diet. There has to be a better way. 

So today we’re introducing a new kind of study we call the riff trial. Let’s see how it works!

Variations on a Meme

In a normal study, everyone follows pretty much the same protocol. In some kinds of studies, like randomized controlled trials, participants are randomly assigned to a small number of very similar protocols.

Instead of making protocols standard, the riff trial makes protocols different. In a riff trial, you start with a base protocol, and every participant follows a different variation. Everyone tests their own riff on the original protocol, and you see what happens. 

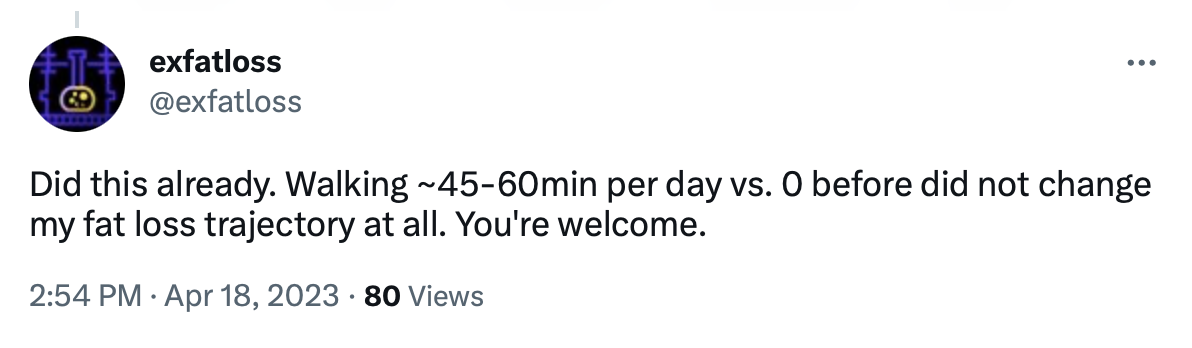
To give credit where credit is due, the blogger known as ExFatLoss did something like this first. He ran a study where 10 people signed up to try his ex150 protocol. In practice, however, most people tried minor riffs on the original protocol, like adding an “illegal” carrot salad, and they still generally lost weight. This is a better test of the robustness of his protocol, and it’s a more efficient way to explore the design space. 

Now it’s our turn. Today we are starting a Potato Riffs Trial, and we’re looking for people who want to try their own riff on the potato diet. 

A riff trial takes advantage of the power of parallel search. Some riffs will work better than others (or at least differently), and parallel search helps you find these differences faster, especially if the differences are big.

Or if you prefer, it uses the power of evolution. The original protocol goes out with mutations and we see how they do in the face of natural selection. If you want, you can even run a second riff trial on the most successful riff(s), to explore the space even further. In this way, the riff trial is the atomic gardening of study design.

Some riffs will be more compelling than others. If you do a riff and lose weight on that version of the potato diet, this suggests the potato diet is robust to that difference. If you do a riff and don’t lose weight, that’s tricker, because we know the potato diet doesn’t work for some people — maybe you are just one of those people. 

But even when individual riffs don’t prove much, together they can be suggestive. If ten people try potatoes + bacon and they all gain weight, that’s pretty strong evidence that bacon is the anti-potato. You could also account for this by doing a few weeks of the original potato diet to demonstrate that it works for you under normal conditions, and then starting the riff to see if anything changes.

A riff trial is scientific fun for friends and family. If a husband and wife living in the same house try different potato riffs, and have different results, we know the differences aren’t a result of their environment, since they live in the same house and sleep in the same bed and so on. If adult siblings living in different cities try the same potato riff and have different results, the differences are probably due to differences in their cities, since the siblings are closely related and are doing the same protocol.

This is also a way to put your money where your mouth is, so to speak. We love all y’all people on the internet, but some of you talk a lot and experiment very little. Science needs to be more competitive — not in the sense of arguing (bleh!) but in the sense of people actually doing studies to go after their disagreements rather than just theorizing about them. This is your chance to get your hands dirty.

And as always, this is a chance to PLAY with your ideas, to PLAY WITH SCIENCE, to JOIN the INTERNET HIVE MIND and MESS AROUND WITH YOUR FRIENDS. This can be your way to help welcome the 21st century scientific revolution you so desperately crave.

Science is a freaking blast!

Tl;dr, we’re looking for people to volunteer to eat almost nothing but potatoes (depending on your riff) for at least four weeks, and to share their results. You can sign up below. For more detail, read on! 

Potato Riffs

As a reminder, here is our version of THE POTATO DIET (more detail can be found in the original post):

  • Drink mostly water. You can also have other beverages like tea or coffee. Just don’t take them with cream or sugar and try not to get too many calories from your drinks. 
  • Eat potatoes. Start with whole potatoes and cook them yourself when you can, but in a pinch you can eat potato chips or fries if you need to. You can calculate how many potatoes to eat (a potato is about 100 calories, so if you need 2000 kcal/day, eat about 20), but we think it’s better to eat the potatoes ad libitum — make a lot of potatoes and just eat as much as you want.
  • Perfect adherence isn’t necessary. If you can’t get potatoes, eat something else rather than go hungry, and pick up the potatoes again when you can. 
  • Seasonings are ok. Do what you can to keep yourself from getting bored.
  • Oil is ok.
  • Take a daily B12 supplement, since potatoes don’t contain any. We like this version but use whatever you like. Take vitamin A if you’re not eating sweet potatoes. A multivitamin would also be fine as long as it contains B12. 

Your mission, should you choose to accept it, is to try the potato diet plus some kind of variation of your choice for at least four weeks. You can try any riff you like, but for inspiration, here is a list of ideas:

  • Whole foods
    • Potatoes + Avocado
    • Potatoes + Bananas
    • Potatoes + Cashews
    • Potatoes + Fruits
    • Potatoes + Leafy Greens
  • Unwhole/Processed Foods
    • Potatoes + Snickers
    • Potatoes + Hot Dogs
    • Potatoes + Soda
    • Potatoes + 10% Ultra-Processed Foods
  • Various Fats
    • Potatoes + Butter
    • Potatoes + Olive Oil
    • Potatoes + Sunflower Oil
  • Grains
    • Potatoes + Bread
    • Potatoes + Rice
  • Protein
    • Potatoes + Tofu
    • Potatoes + Chickpeas
    • Potatoes + Beans
    • Potatoes + Eggs
    • Potatoes + Ground Beef
    • Potatoes + Chicken
  • Food Suspects
    • Potatoes + White Sugar
    • Potatoes + Honey
    • Potatoes + Chocolate
    • Potatoes + Cream
    • Potatoes + All Dairy
    • Potatoes + Ketchup
    • Potatoes + Tomato Sauce
  • Preparation
    • Potatoes (baked only)
    • Potatoes (boiled only)
    • Potatoes (roasted only)
    • Potato Soup SOUP ONLY
  • For Humor Only

Before you sign up, let’s highlight some riffs we might be especially interested in:

Mono-Diet

Some people think the potato diet causes weight loss because it is a mono diet, a diet where you eat mostly one food. We think this is wrong! If it were true, 1) any other mono diet would also work, and 2) the half-tato diet wouldn’t work because you eat more than one thing. But the half-tato diet does seem to work, at least for some people. Also there was so much cheating in the original potato diet (by design!) that we’re not sure even most of those would could as a mono diet really:

So one very simple riff you can do is the potato diet plus some other food of your choice. Potatoes and apples. Potatoes and lettuce. Potatoes and carrots. If the mono-diet hypothesis is true, adding these other foods should stop the potato diet from working. If it keeps working, that’s a major problem for the mono-ness hypothesis. 

Deliciousness

Some people think the potato diet causes weight loss because it is bland. We think this is wrong too. First of all, potatoes are delicious. Second of all, this doesn’t make any sense. Why would that happen.

However, one riff you could do is potatoes plus one or two foods you think are especially delicious. This seems like a good deal. You get to eat potatoes and one or more of your favorite foods, as much as you want for a whole month, and you might lose weight for your trouble. If you do lose weight eating potatoes and a favorite food, that’s a major problem for the blandness hypothesis. Also it makes sense.

Potatoes + Whole Foods or Unwhole Foods

Some people think the potato diet causes weight loss because potatoes are whole foods — they are totally unprocessed, unadulterated, torn directly from the bosom of Mother Earth. This might be part of it, though it makes us wonder what it might be about “whole foods” that would make them cause weight loss. 

Anyways, one way to test this would be to try eating potatoes plus some other whole food, like almonds or bananas. If the whole food hypothesis is correct, this should cause as much weight loss as the normal potato diet, maybe more.

Or you could do the opposite, and try eating potatoes plus some highly-processed food, like snickers bars or Big Macs. If the whole food hypothesis is correct, eating these processed foods should make the potato diet much less effective. But if you lose weight on potatoes + gummy worms, that’s evidence against the whole foods hypothesis.

...yes

Potatoes + Cream

ExFatLoss has lost a lot of weight on a diet that is mostly heavy cream. When he recruited ten other people to try the same thing, most of them lost weight too. If potatoes cause weight loss, and cream causes weight loss, maybe potatoes and cream together will cause even more weight loss? 

Worth trying, at least, especially since in the original Potato Diet Community Trial, we asked people to avoid dairy. Maybe that was the wrong move. You could also do potatoes + light cream or potatoes + milk, to see if milkfat matters. Or just a general potatoes + dairy, where you eat both potatoes and any dairy products ad libitum

Potatoes + Various Fats

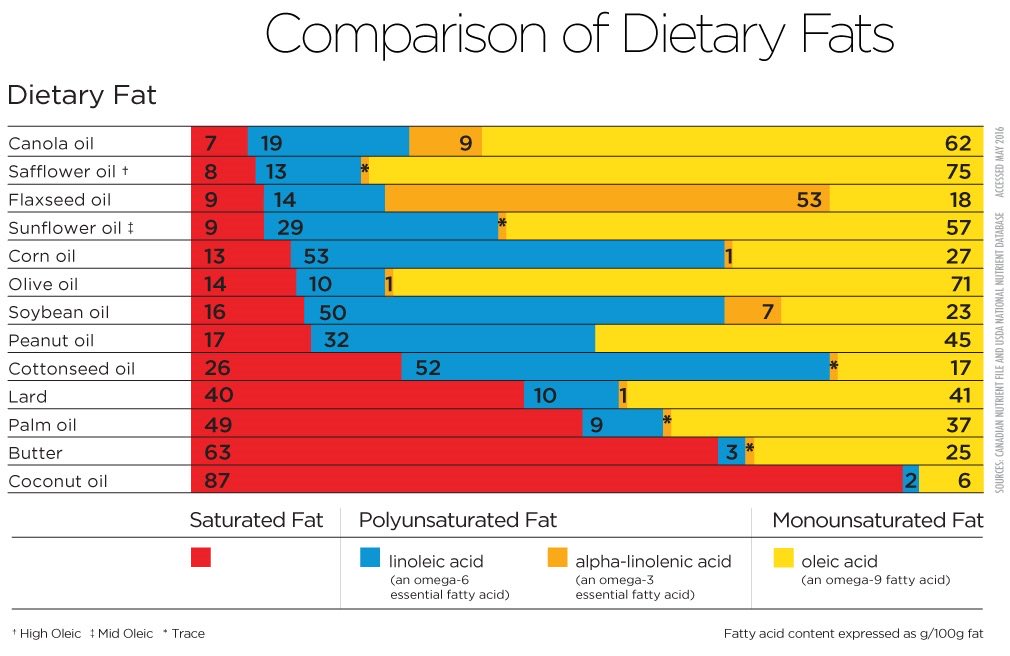
Some people think that seed oils are the cause of the obesity epidemic, and/or are bad for you in general. From this perspective, the reason the potato diet works is that it cuts all the seed oils out of your diet — you’re too busy eating potatoes. As we’ve previously argued, we don’t find this theory very convincing. But it’s easy enough to test. We wrote:

It would be easy to run a variation of the potato diet where half the participants are randomly assigned to eat their potatoes with butter, and the other half are randomly assigned to eat their potatoes with sunflower oil. (Or substitute these for whatever fats the seed oil theorists think are best and worst.) If the seed oil theory is correct, then the participants eating potatoes + butter should lose weight much faster than the participants eating potatoes + sunflower oil. If the seed oil theory is wrong, there should be basically no difference.

This would be a good subject for riff trials. If they want to, some people can sign up to eat olive oil with all their potatoes, some can sign up to eat butter with all their potatoes, some can sign up to eat canola oil, etc. Then we can see if there are big differences between people who choose different fats. 

If seed oil theorists are really confident in their theory, they should sign up and demonstrate that seed oils kill the potato weight loss effect, and other fats don’t.

Potatoes and Suspected Blockers

The potato diet may work by adding things to your diet, like huge doses of potassium. But it may also work by removing things from your diet. (It might also do both.) This suggests that there may be some foods that “block” the potato weight loss effect. You can test this in a riff by trying the potato diet plus one of these foods, to see if it keeps working or not.

One prime suspect is tomato and tomato products like ketchup. Ketchup came to our attention as a result of some anecdotes from the original Potato Diet Community Trial, stories where people felt that eating ketchup kept them from losing weight. As Jack Peterson noted, tomatoes blocking the effect “would explain why no one ever noticed [the weight loss properties of potatoes] prior to Chris Voigt’s stunt: because potatoes are usually eaten with ketchup”. And we were surprised to see that in the Half-Tato Diet Community Trial, weight loss was correlated with tomato consumption, r(36) = 0.37, p = .021 (also significant when removing the extreme outlier, r(35) = 0.36, p = .031). Plot here:  

So you could try a potato diet with ketchup in particular, or with tomato products in general. If you still lose weight, that would show that tomato isn’t necessarily a blocker. If you don’t lose weight, that’s pretty interesting. You could also try alternating weeks with and without tomatoes, to see if you can make the effect turn on and off at whim. Whee! 

Tomatoes are our top bet, but other possible blockers might be: wheat, bread, grains more generally, maybe meat. Carbs stand out because on the potato diet you are getting a lot of carbs. So even if you do take a cheat day, you probably won’t be cheating with bread, because you probably won’t crave that. Some people think sugar might be a blocker, so you could try potatoes + white sugar (but maybe not together, ew). Eggs or goji berries might also be blockers because they seem to be high in lithium. So one kind of riff would be trying potatoes and one of these foods and seeing how it goes. 

Potatoes + Chocolate

CuoreDiVetro recently published a self-experiment where they followed a very simple form of the potato diet, replacing one meal per day with a meal of just potatoes, supplemented by additional doses of potassium chloride (based off of a potassium:sodium ratio hypothesis that has been floating around). This worked very well for them at first — then they discovered that it appeared to work even better when they included chocolate, like so:

I bought dark baking chocolate (100% cacao) with a high concentration of potassium (just in case it was the potassium). I made my hot cacao by melting ~36g of dark chocolate (containing roughly 750 mg of K) in roughly one cup (250ml) of milk (containing roughly 350 mg of K) and sweetening it to taste. 

According to CuoreDiVetro, they lost weight four times faster when they were eating one hot chocolate per day in addition to their meal of potatoes.

This could be something about chocolate in particular. But it might also be yet another pointer to stearic acid, a waxy fat common in foods like tallow, lard, butterfat, and cocoa butter, which for some reason keeps showing up in weight loss research. If you’ve heard of this fat before, it’s likely from Fire in a Bottle (FIAB), a website/program/theory which argues that a diet high in stearic acid can cause weight loss. This is sometimes called The Croissant Diet (TCD), presumably in the hopes of confusing readers — you do not actually eat nothing but croissants. In fact, you don’t have to eat any croissants at all. But you do ideally eat lots of foods high in stearic acid, sometimes supplementing with additional stearic acid, and some people seem to lose weight when they do this.

There are other reasons to think that stearic acid might be involved. ExFatLoss and co must be getting a lot of stearic acid from the huge quantities of milkfat they’re consuming. And Outlier 17 from our Half-Tato Diet Community Trial, who lost way more weight than anyone else in the trial, often took straight stearic acid as a supplement. 

So you could supplement stearic acid on top of your potatoes and see what that does. Or you could try potato + chocolate, which seems more delicious. But to each their own. 

You could also try CuoreDiVetro’s riff exactly, or riff further off that riff. It appears to be 1) one meal per day as a meal of just potatoes, 2) potatoes are salted with 3.2 g KCl, 3) avoid adding NaCl (normal table salt) to potatoes, 4) at least one hot cacao per day, per the recipe above, and 5) otherwise eat as normal. This is really several riffs away from the main protocol and might not be as illuminating, but would give another similar data point for comparison. 

Preparation

We think the potato diet might cause weight loss because of the super high doses of potassium you get when you eat tons of potatoes. We also hear that boiling potatoes removes a lot of their potassium, because it drains out of the potato and into the boiling water. If this is the case, then eating nothing but boiled potatoes would probably cause much less weight loss than eating nothing but baked or roasted potatoes, which should still have all their potassium. Unless you boiled your potatoes as a soup and then drank all the broth.

Doing a riff where you only ate one kind of preparation, whether those be boiled, baked, fried, steamed, roasted, mashed, or souped potatoes, might illuminate this question. But it might be kind of boring.

Half-Tato Accelerator

Many people lose weight on the half-tato diet, like M, Nicky Case, Outlier 17, and CuoreDiVetro. We say “half-tato”, even though many of these people were getting less than 50% of their food from potatoes. But when we ran a community trial of the half-tato diet, most people barely lost any weight.

What gives? Maybe there’s some extra step required to make half-tato work. If we could figure out that extra step, people could lose weight with much less hassle. So if your riff seems to be working on full-tato, you could switch to half-tato and see if it keeps working just as well. Or you could try various riffs on half-tato and see if any of them serve as the switch. 

Get Confused

They say that the most exciting phrase to hear in science is not “Eureka!” but “That’s funny…” So the best thing that could happen would be if you find something really weird. For example, it would be very weird if people found that taking iron supplements makes the potato diet totally ineffective… unless you take iron supplements AND magnesium supplements, in which case it starts working again (we have no reason to think this would happen, just a wild hypothetical). If that happened and it were robust, it would be very surprising, and trying to puzzle it out would get us closer to an answer.

So if you have some other weird potato diet riff you want to try for some reason — we say, go for it!

Sign Up

Ok researchers, time to sign up.

The only prerequisites for signing up are: 

  • You must be 18 or older;
  • In generally good health, and specifically with no kidney problems;
  • Willing to do some version of the potato diet, as described above, for at least four weeks, and;
  • Willing to share your data with us — you can publish it as a philosophical transactions post on our blog if you like, or publish it somewhere else on your own.

As usual, you can sign up to lose weight, lower your blood pressure, get more energy, or see one of the other potential effects. But you can also sign up to help advance the state of medical science. This study will hopefully get us much closer to understanding why the potato diet causes weight loss. It might lead to a practical weight-loss intervention that’s much easier than the 100% potato diet, and it might lead to curing obesity for good.

And beyond that, running a study like this through volunteers on the internet is a small step towards making science faster, smarter, and more democratic. Imagine a future where every time we’re like, “why is no one doing this?”, every time we’re like, “dietary scientists, what the hell?”, we get together and WE do it, and we get an answer. And if we get a half-answer, we iterate on the design and get closer and closer every time. That seems like a future worth dreaming of. If you sign up, you get us closer to that future.

Eating this much potato may sound a little daunting, but people who have tried it say that it is much easier than they expected, and delicious to boot. Here’s our suggestion: If you are at all interested in trying a potato diet riff, go ahead and sign up and start collecting your data. Collect your baseline measurements for two weeks, then try the first day or two of the potato diet and see how it feels. If you hate it and have to stop, we would still love to have that data.

If at any point you get sick or begin having side-effects, stop the diet immediately. We can still use your data up to that point, and we don’t want anything to happen to you.

We are mostly interested in weight loss effects for people who are overweight (BMI 25+) or obese (BMI 30+), but if you are “normal weight” (BMI 20-25) you can also sign up. 

And for everyone, please consult with your doctor before trying this or any other weight loss regimen. 

We realize that anyone who starts a potato riff soon will overlap with Thanksgiving and/or Christmas. So you’re welcome to wait and sign up later, we will keep signups open at least through January, maybe longer. But also, it’s not a problem if you overlap with the holidays, and it might be a good way to see how robust your riff is. Someone doing an “I ate potatoes and whatever holiday treats I wanted” would honestly be an amazing study.

In general, signups will be open for a while, and it’s all rolling signups. Pick out a riff and join whenever.

If you were part of previous SMTM studies, please feel free to sign up for this study as well! Just mention it, and provide any previous subject numbers, when you’re signing up.

How do you decide what riff to choose? Here are three approaches to consider:

  1. Follow what you like. Do you like steak a lot? Maybe that’s a sign that your body needs more steak. Even if not, you would probably enjoy it. So why not sign up for a steak and potatoes riff? You might lose weight, and even if you don’t, you’ll be making an important scientific contribution while eating delicious foods you enjoy. 
  2. Put your money where your mouth is. This is a chance to test your theoretical bone to pick, whatever that might be. If you think the potato diet works because it is low sugar, then potatoes + sugar shouldn’t work. You can try that and test your idea. If you think the potato diet works because it is a seed oil elimination diet, then potatoes + sunflower oil shouldn’t work, while potatoes + coconut oil should work as normal. You can recruit three friends and test it. You might be surprised. 

  3. You can choose “randomly”. What sounds funny? What is no one else doing? Go with that. 

Anyways, to sign up: 

  1. Fill out this google form, where you give us your basic demographics and contact info. You will assign yourself a subject number, which will keep your data anonymous in the future. You will also tell us what riff(s) you’re interested in. 
  2. We will clone a version of this google sheet and share the clone with you. This will be your personal spreadsheet for recording your data over the course of the diet.
  3. On the first day, weigh yourself in the morning. If you’re a “morning pooper”, measure yourself “after your first void”; if not, don’t worry about it. We don’t care if you wear pajamas or whatever, just keep it consistent. Note down your weight and the other measures (mood, energy, etc.) on the google sheet.
  4. Do your version of the potato diet for at least four weeks.
  5. When you reach the end of the diet (whether you’re ending the diet early, reaching the end of 4 weeks, or reaching the end of a longer span), send us an email. Let us know if you want to publish your results yourself (in which case send us a link to your post) or if you want to publish your results on SMTM as a philosophical transactions post (in which case send us a detailed email about your protocol, results, and thoughts).
  6. Remember that it is ok to end the study early if you need to, for example if you get sick. It’s also fine to reach the end of 4 weeks and keep going if you’re having a good time. Just make your intentions clear in the comments on your data sheet and send us an email whenever you decide to finish, we’d love to hear from you.

We plan for this to be somewhat more relaxed and more casual than our previous studies, so please understand if we take a few days to sign you up or get back to you about anything.

As always, if you think this is an interesting idea, please tell your friends!

N=1: Having Fun and Feeling Good

Previously in this series:
N=1: Introduction
N=1: Single-Subject Research
N=1: Hidden Variables and Superstition
N=1: Why the Gender Gap in Chronic Illness? 
N=1: Symptom vs. Syndrome
N=1: Latency and Half-Life
N=1: n of Small
N=1: Dr. Garcia’s Queasy Irradiated Rats
N=1: Bite the Bullet

I just really like watermelon and finally realized the only limitations were in my mind.

Luck based medicine: angry eldritch sugar gods edition

The current model of nutrition science is that nutrition is a struggle of mind over body. You just need to find the discipline to completely ignore your instincts, to avoid what you enjoy and restrict all the stuff you like. The more you like it, the more you should probably restrict it. You should ignore and suppress the signals your body is sending you and do exactly the opposite instead. 

What if we flip that on its head, and assume that your mind is silly while your body is wise? Notice what feels good, things you enjoy and respond well to, then ramp up those?

This seems to have worked well for both Elizabeth Van Nostrand and ExFatLoss (and his participants so far). Elizabeth eats all the watermelon she wants, and in her own words, her health is “obviously doing much better” than before. ExFatLoss loves cream, eats almost nothing but cream, and is currently down more than 50lbs.

Our potato diet came from a similar place. Seeing all the case studies where people lost a ton of weight did pique our interest. But we also just love potatoes, and we were kind of curious if we could eat nothing but potatoes and never get tired of them. Turns out, we pretty much can. Even after months of dedication, we still love potatoes. And so do many of our participants: 

(16832193) I was quite surprised that I didn’t get tired of potatoes. I still love them, maybe even more so than usual?!

(57875769) My wife and I went out to eat with a friend and I expected to use today as a cheat day, but honestly potatoes sounded like the best thing on the menu so I ordered hash browns and french fries. The hash browns were very filling on their own so I didn’t eat many of the fries.

Eating tons of a single food you enjoy might not be your ideal protocol. But it’s a good place to start.

Anonymous vs Pseudonymous Internet Science

People frequently ask us why we are anonymous. The answer is that we’re not anonymous, we’re pseudonymous. Both of these approaches are useful ways to conduct your internet science, so here is a quick guide to choosing which one works best for you: 

Anonymous

  • No name attached at all.
  • Highest level of separation between government identity and the individual.
  • Can be good for one-off research or theoretical pieces that don’t need to be connected to other things you’ve worked on, or things that might be better for a different audience.
  • For study participants, the best option to protect their privacy.
  • Literally you can do infinite anonymous identities.
  • Naming conventions: numbering is easy, but there’s lots of opportunity to be creative. Or just say “by Anonymous”. Actually Google Docs has a nice approach
Anonymous NyanCat

Pseudonymous 

  • A pseudonym is like a band name. It’s a name that you will use multiple times, and a name that can develop its own reputation.
  • A pseudonym may or may not be connected to a legal name — this can also change over time or in different contexts. Lots of people are known by a stage name or a pen name professionally, but you can still find their other names without too much trouble. You may not immediately know Jay Z’s government name, but it’s not hard to find out that he was born Shawn Corey Carter.
  • Pseudonyms are great for groups! Fighting for first authorship is stupid — just come up with a silly name instead. 
  • You can also have multiple pseudonyms. Generally it makes sense to pick one name for a given project and stay with that for a while, so that people can get to know your style and see what you do as a body of work that should be considered. But using different pseudonyms for different projects, or when you’re working with different groups, is a good approach.

Conclusions: Really it’s a spectrum. There are lots of different options that can work, depending on the project and your specific concerns. 

Philosophical Transactions: Jon on One Year Post-Potato-Diet

Previous Philosophical Transactions:

Jon was a participant in our Potato Diet Community Trial. He recently sent us an email with an update on how he’s doing, which is reproduced below with his permission.


I don’t know if you wanted a 1 year followup.

So last year at this time I’d just come off my first potato diet and it seemed like the weight was staying off at least partially out of sheer cussedness and a desire to see my much-touted diet work out as well as I’d hoped. Where am I at a year later?

At the end of that first potato diet I was at 168, having lost about 15 pounds from my start of 183.6. Last time I weighed myself I was at around 172. That’s practically within water-weight of that 168! And that 172 is approximately stable compared to a month ago or whenever I last weighed myself!

In the last year I’ve done a couple more tries at the potato diet, neither of which were as successful as that first one. But I think when it comes down to it the potato diet knocked my basic set-weight down by about 11 pounds! The biggest ongoing change in my diet is having tater tots and sausage for breakfast almost every day, generally replacing cereal in the old regime.

Anyway, absurdly pleased by that result–potato diet wasn’t a magic bullet for me but it halted the inexorable upward slide of my weight, got me down a little bit and has kept me stable for a year.

Even though it never worked as well again (probably lack of accountability from not being part of a study) the potato diet was still life-changing and has improved my health long term! Please let me know if you need any more data, I’m happy to provide it! Thanks,

Jon 

Mysteries Contest: Winners

Thanks to everyone who participated or voted in the Mysteries Contest! The winners are:

FIRST PLACE:
What’s the Deal With Airplane Food Iodine and Longevity? by Kevin Shea, writing as Lee S. Pubb.

SECOND PLACE:
Why is autism rare among the Amish? by TripleTaco.

THIRD PLACE:
Have Attention Spans Been Declining? by niplav, writing as Cennfaeladh, who also blogs at niplav.site. Also, honorable mention to niplav for getting by far the most (30,000+) pageviews.

We’ve been in contact with all three winners and will be sending them their awards shortly. Congratulations! 


In addition, TripleTaco gave us this proposed explanation to the list of Amish mysteries. For your consideration: 

After I formed my own theory of what caused Autism, I looked hard to see if anybody else had come to the same conclusion. After a long time of looking, I finally found one researcher, Max McDowell, who explains what he (and I) believe likely causes autism in this video: https://www.youtube.com/watch?v=BHhAnCTVLG4

If I were naming this, I’d call it “face starvation”. Babies have a crucial window in which they need a certain amount of eye contact and starving them of that causes autism for many children. He goes on in that video to describe many of the same mysteries I described in my mystery post. The theory lines up with the mysteries perfectly.

The video has been out for over 2 years and at this moment it has 114 views. His idea was first published all the way back in 2004, so it’s not new at all. It’s just being utterly ignored, and for very strong reasons:

First of all, he calls himself a “Jungian Psychoanalyst”, which frankly makes him sound kind of woo-woo and makes it harder to take him seriously. Secondly, he’s well outside of the academic circles that have earned the right to talk about autism and its causes. He’s an outsider. Thirdly, it’s a shocking, awful idea, and anybody championing it will be pilloried from all sides. The idea is threatening to the neurodiversity camp who don’t want autism treated like a disorder at all. The idea is threatening to parents who aren’t eager to hear that their own technology habits may have contributed to severe lifelong difficulty in their child. The idea is threatening to existing researchers who are far along other research paths and stand to gain little from such a simple tidy explanation, especially when championing it would get them in all kinds of hot water from every direction. Frankly, this idea is way too controversial to put my own name on, which is why this is an anonymous contribution. 

Even if we’re right, I’m not hopeful that people are going to start taking this idea seriously. There are some ideas that are just too controversial to be taken seriously. 

Vacation Study Ideas


There are lots of stories where an American goes on vacation for a few weeks, to Europe or Asia or wherever, and loses a significant amount of weight without any special effort. 

(Though sometimes it’s not weight, it’s something else like acne breakouts or digestive issues.)

There are also some stories that are exactly the opposite: someone from Europe or Asia or wherever goes on vacation to America for a few weeks, and GAINS a significant amount of weight without any changes. 

Some stories describe what are almost simple ABABA-style experiments, where a person goes back and forth from America to other parts of the world and sees their weight reliably yo-yo as they move from country to country. We shared one such story in Part X of A Chemical Hunger, this account from Julius: 

I currently live in Seattle but have moved around a lot. I’ve made 6 separate moves between places where I drank the tap water (mostly USA/UK/Hungary) and places I haven’t (South East Asia, India, Middle East). Whenever I’ve spent significant time in bottled water countries I lost weight (up to 50 lbs), and each time, save one 3 month stretch in Western Europe, I gained it back in tap water countries. I also lost weight for the first time in the States (20 lbs) this year around the time I switched to filtered water.

We can also share this story, from another reader (lightly edited per his request):

I quit my job and moved to northwest Thailand. I lived there for about 1.5 years and lost 100lbs. At the end, I was thinner than I’d ever been as an adult, even in Germany, just under 200lbs (or ~90kg). I didn’t do much if any exercise and I typically ate as much as I wanted.

Then I moved to SF and gained the 100lbs back within 2-3 years. I worked out while I was still thin, but, again, it didn’t stop the gaining and eventually became impractical as I was too fat to run. Peaked around 300lbs once again.

So then I thought, it’s the work stress. So I quit my job once more, and I moved to Las Vegas, where I lived for an ENTIRE YEAR without a job. And didn’t lose any weight. 

During these last few years, I would often vacation in Thailand for 1-3 months, and always lose weight without trying. Typically, if I was there for at least 1 month, I’d see some noticeable fat loss on the order of a few pounds, and feel my belt get looser.

Even right now, as I’m visiting with my family back in Germany, I am visibly and belt-feel thinner after only 3 weeks of being outside the US, despite zero exercise and eating a ton of salami and cheeses.

Anecdotes are fun, but so far there hasn’t been any systematic study. If this vacation weight loss effect is real, it seems like it would be good to know. It would give us a powerful tool for causing weight loss (just take a trip to somewhere leaner than where you’re living right now), and it would help us get closer to finding out what causes obesity. 

In particular, it would provide more evidence for the contamination hypothesis, since losing weight on vacation is a pretty strong hint that something about the environment is to blame. Most of the anecdotes above seem pretty confident their weight loss has something to do with the “unprocessed” foreign food, but there are reasons to think it might be some other part of the foreign environment. And if we could study vacation weight loss in a systematic way, we might be able to narrow things down.

Systematic

Happily, the plural of anecdote IS data, so these anecdotes do start us off with data we can use. 

But this data is not very systematic, and may not be representative. In particular, if you go on vacation to Europe and you lose no weight, you probably don’t post about it on social media, and you probably don’t email us to tell us about the weight you didn’t lose. 

We can correct for this by trying to collect data in a more systematic way. We can also try to come up with a design that lets us account for some alternative explanations (more on this in a bit). 

We have a few ideas for study designs, but we’re not sure what kind of design would be best. We’ll describe general ideas for designs below, and please, let us know what you think.

If any of the designs seem good, we might run one of these studies at some point. But it’s somewhat of a shame for us to be running so many of these internet studies. No one should have to take our word for these things — it would be better if the work/knowledge/expertise were spread around the community. 

So if you want to help run one of these studies, or if you want to take point and run it yourself, let us know and we can talk about collaborating. Or you can just take the design and run with it, we’re not your mom.

Walking

But first: Some people are skeptical that there is something special about vacation. The most common alternative they offer is some form of, “it’s all the extra walking”.

But there are some problems with this response. For starters, it assumes that all these people are walking more, but you don’t always walk more on vacation than you do at home. Some people have very active day jobs, and there’s nothing stopping you from sitting quietly in your hotel room for a week straight. 

It ignores the other details people often mention in these stories, like that they also ate much more and ate “worse” than normal on vacation. From a simplistic CICO perspective, this extra food should balance out the extra walking.

And if extra walking on vacation were the cause of vacation weight loss, then extra walking ANYWHERE should cause weight loss. This would mean that slightly more mild cardio is a good treatment for obesity in general. But “slightly more mild cardio” doesn’t work as a treatment for obesity, so it’s clearly not the cause of vacation weight loss. 

More importantly, many people who lost (or gained) weight on vacation make it clear that they don’t think it was the extra walking. Yes, they are not totally neutral parties, but no one is a totally neutral party, and they are the only ones with firsthand knowledge of their own cases.

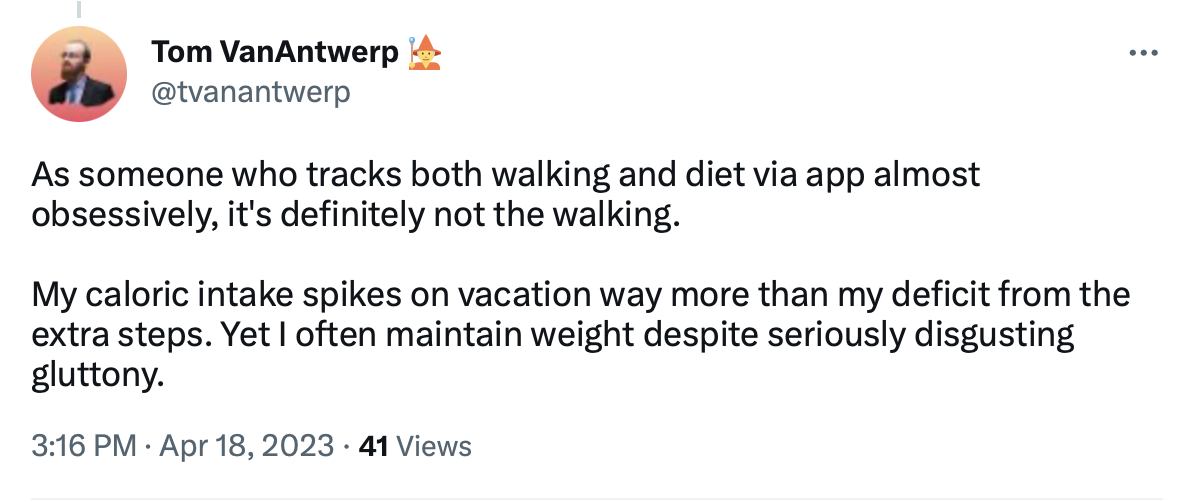
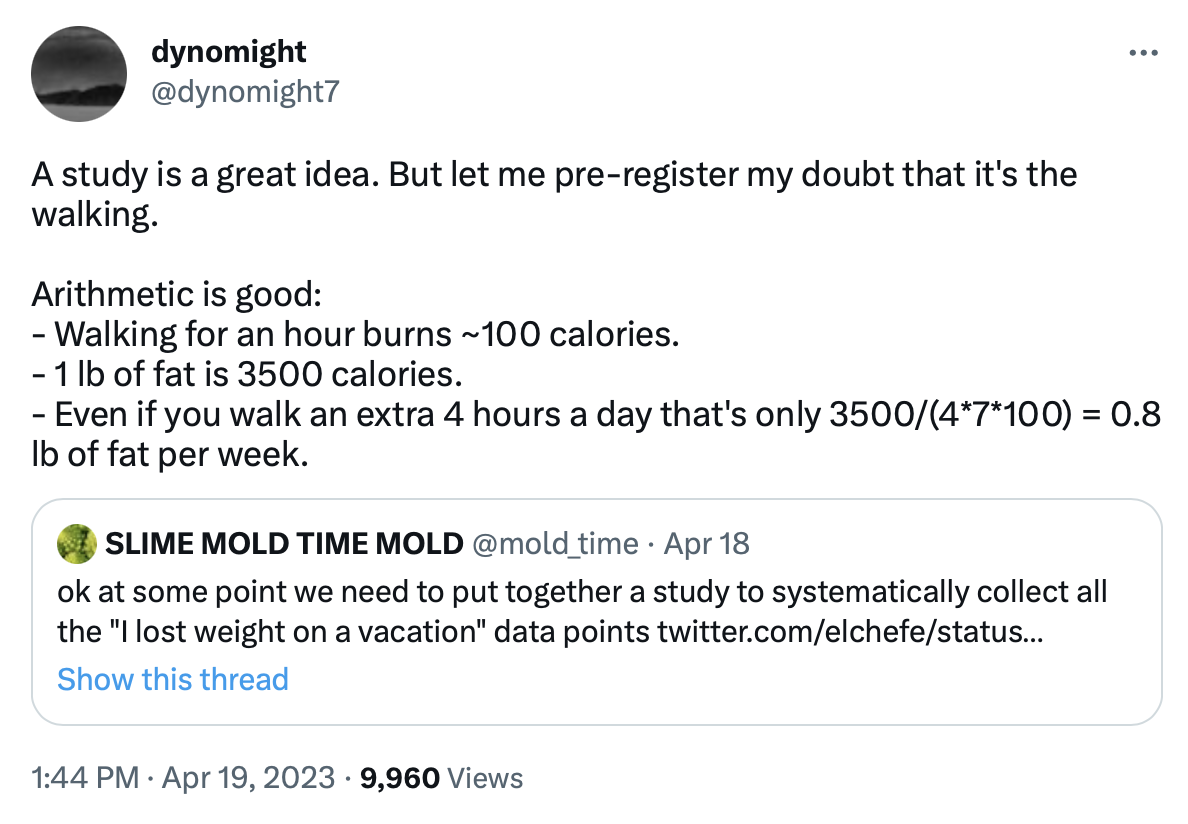
There may be other reasons to doubt that extra walking is to blame. Friend-of-the-blog dynomight is skeptical that the walking explanation survives back-of-the-napkin math:  

But all this debate is really for nothing. We can just check. 

For starters, it’s easy enough to ask people to count steps. Their phones make estimates automatically. We can see if people are walking more on vacation and if how much extra walking they do is at all related to how much weight they lose. 

We can compare Americans who go on vacation to Europe with Europeans who go to vacation in America. Maybe both groups walk more than average while they’re on vacation, but if the Americans lose weight in Europe and the Europeans gain weight in America, that would suggest that the extra walking has little to do with the weight change. 

We can also compare between states. Different US states vary widely in their obesity rates, from 25% in Colorado to more than 40% in Kentucky. If it’s something about the environment, then people from Kentucky should lose weight when they vacation in Spain, but people from Colorado might not. Similarly, we can look at people taking vacations in different US states. Europeans might gain weight in Mississippi but might not gain weight in Massachusetts. 

We could even do something ludicrous like: “take identical obese twins, send one twin on vacation to Italy and have the other twin stay in America and try to match their walking distance as closely as possible.”

With the right design, it should be relatively easy to tell if walking is to blame. It’s fine if somehow it turns out that extra walking is the real cause of vacation weight loss, but clearly this is somewhat controversial — we should do a study and see. 

Design #1: Existing Cohort Study

First, we could use data that someone else has already collected.

Programs like the Fulbright Program and the Peace Corps send young people to different countries around the world. These programs are already doing a controlled study on the vacation weight change effect, they just don’t know it. For example, the Philippine-American Fulbright Commission takes young people from a fat country (America) and sends them to a lean country (the Philippines), and also takes young people from a lean country (the Philippines) and sends them to a fat country (America), in both cases for about a full year. 

These programs may already be recording students’ weights before and after their trip abroad, perhaps for medical reasons. If so, all the data we need already exists out there in some database. If not, all that would be required would be convincing the program, or even just some of the students, to start recording their weights before and after the exchange.

This is pretty much the ideal experiment. It’s systematic — we will get information from everyone, whether or not they gain or lose weight. The sample size is huge. And the data may already exist.

The problem is that we don’t know if there’s any way for us to GET this data. We haven’t had any luck trying to get in touch with Fulbright or any of these other programs, and we doubt they would be willing to make this data public.

If anyone thinks they could put us in touch with anyone on the Fulbright Philippines Board of Directors, or anyone at a similar organization (the American armed forces might have similar data), we would love to do this analysis. But barring that, we’ll have to come up with ways to collect our own data. 

Design #2: Retrospective Vacation Study

Second, we could collect vacation information that already exists.

People have gone on many vacations over the course of human history [citation needed]. So for this design, we would systematically collect all the existing vacation stories we can.

This could be as simple as setting up a google form and asking people to submit stories about their past vacations (or other international trips, like exchange programs or briefly being an expat). The form would include just a few simple questions — how long the trip was, how much they weighed before, how much they weighed after, where they went, etc. Then we could look at this data to see if there’s any support for the vacation effect. 

You might want to limit this (and the designs we talk about below) to trips that are at least two weeks long, because one week probably wouldn’t be enough to get a clear signal. 

The upside of this design is that you might be able to get a lot of data pretty quickly. But there are some downsides.

First off, people may not remember how much they lost, how long they were gone, or other details of the trip. In short, the measurements will be noisy.

Second, you can’t ask people to collect specific data, or ask them to collect it in specific ways, because the vacation has already happened. If people happen to have measurements of how much they walked on their vacation, that would be great, but most people won’t have collected that data. 

Finally, there’s bound to be a selection effect. People who lost weight on vacation are probably more likely to respond than people who gained weight. This isn’t totally damning since we can still see things like 1) whether people lost more weight on longer vacations, 2) whether people lost more weight when they traveled to leaner countries, or 3) whether younger people lost more weight than older people. But it is a limitation. 

So it would be easy to run this study, and maybe informative if we got enough responses, but there are some problems with this kind of design.

Design #3: Prospective Vacation Study

Third, we could collect vacation data as it’s being created.

People continue to go on vacations today; in fact, many people are planning vacations right now. So another option would be to ask people to sign up to report on any vacations they’re about to take, and provide us a little data about the before and after. 

The design would be pretty simple: first a pre-vacation survey, where people tell us about the vacation they’re about to go on, where they’re coming from, where they’re going, how long it will be, and how much they weigh right now. We’d also ask them to give us some measure of their average activity, maybe their average steps per day over the last three months — something easy that should already be captured by their phone.

Then when they get back, there’d be a post-vacation survey, where people could tell us what their weight was after the vacation. We’d also ask them for their average steps per day while on vacation, so we could get a sense of if they are walking more or less than normal. We could also ask them to report subjectively on measures like whether they exercised more or less than usual, and whether they ate more or less than usual.

This would help keep selection effects somewhat in check. No one knows before a vacation whether they will gain or lose weight — they can’t decide whether or not to sign up for the study based on their weight change, because it hasn’t happened yet. 

If we have a high attrition rate, with lots of people filling out the first part but not filling out the second, this could be a sign that people who gain weight don’t come back and report their weight gain. But if the attrition rate is low, that suggests there isn’t much post-hoc selection. 

We can also do comparisons just within the people who respond. Maybe the attrition rate is high, but if all the Americans going to Europe report losing weight, and all the Europeans coming to America report gaining weight, we can be fairly sure that’s not just selection. 

The downside is that this approach would be pretty slow. There are lots of vacations, but we have to wait for people to come to us one by one as they jet off on their various trips. 

This design is also not very controlled. We don’t get to pick the vacations and we don’t get to pick the vacationers. It’s a convenience sample, and while it might still be revealing, there are limitations. 

Design #4: Controlled Vacation Experiment

Fourth, we can go out of our way to create the data we want.

It’s within our power to make vacations happen under controlled conditions — recruit some people who are obese and who can spend a month or two abroad (perhaps they have a remote job), and send them to a lean country for a couple weeks to see what happens. As with the other designs, you could have them track their exercise and other confounders if you want.

This is a version of what we have previously called “Slime Mold Time Mold’s Excellent Adventure”. 

We were originally concerned that even if things were perfect, weight loss would be pretty slow. Even if you sent people to Japan for a month, they might not lose weight quickly enough for you to reliably detect the change. We thought that you might have to send people abroad for closer to a year, just to pick up on the effect.

But the results of the Potato Diet have convinced us that under the right conditions, quite a lot of weight loss can happen in just a few weeks. So now we think that a vacation study of 2-4 weeks might actually be informative. 

And you may not need very many people. It’s still not clear how many people lose weight on vacations, but if the effect is consistent enough, you could find strong evidence with just a few participants (yet another n of small opportunity). If five obese people go to Italy for a month and all of them drop 10 lbs while sitting around and eating spaghetti alla carbonara ad libitum, that would be strong evidence, even with the small sample size.

The ideal countries to send people to would probably be Vietnam (leanest country in the world, about 2% obese), Bangladesh, India, Nepal, Japan, or South Korea (all less than 5% obese). There are many relatively lean countries in South America and Europe, but even Albania is more than 20% obese, so you would probably get a weaker effect. 

This wouldn’t be too expensive. It costs around $4,000-$5,000 to send someone to a lean country for a month, so you could likely send around 10 people to one of these countries for a month for less than $50,000. Not pocket change, true, but cheap in the grand scheme of scientific studies. Given that many people enjoy vacations [citation needed], you might even be able to get people to pay for half of their trip.

It might make sense to run one of the other studies first to see if they back up the anecdotes, before spending all this money. But the other study designs aren’t nearly as controlled. If you’d be interested in funding this study, or helping us arrange all the travel details (booking hotels and flights is not our strong suit), please let us know. Or you can ignore us, recruit 10 obese volunteers, and send them to Myanmar all on your own. Just let us know what you find out! 

Similarly, anyone who is at all overweight could run this as an N=1 self-experiment, or get a few friends and run it as an N of small. You just need to be in a position to spend a few weeks in one of these lean regions.

The main drawback is that the small sample size would keep you from making interesting comparisons. Sending 10 obese Americans on a one-month trip to a small Asian country could make a strong case for the vacation effect, but it wouldn’t let us answer questions like the following: do young people lose weight faster on vacations than old people? Do other demographics (like ethnicity) have an impact? Do people lose weight faster in Peru (19% obese) than in Spain (27% obese)? Do people with BMI < 25 also lose weight on vacations? 

This would be another reason to run multiple studies with different designs. Sending people on a planned vacation gives you a lot of experimental control with the limitation of a small sample size, while other designs can give you a large sample size at the cost of experimental control. Both could tell us a lot, and they’d be stronger together — triangulation is the name of the game. 

Final Notes

As far as we know, no one has ever done a vacation study like this, so any study at all would be interesting. It doesn’t have to be perfect — we should start by getting our toes wet. 

We’re talking about these designs like they’re all about obesity, but this approach doesn’t have to be used to study obesity. You could also use it to study, say, migraines. Lots of people think they are gluten or lactose intolerant — but are they still gluten or lactose intolerant if they’re eating bread or milk in, say, Italy? Might be interesting to find out. 

As always, we are happy to help with designs and methodology. If you want to run one of the studies described above, please contact us

Vote in the Mysteries Contest

Thank you for reading the entries in our Mysteries Contest

Please vote for your favorites here, using approval voting (i.e. vote for however many you want).

We will probably keep voting open until the end of the day on August 31 in case you want a chance to go back and re-read your favorites. In case you’ve forgotten, the finalists are:

  1. Why is autism rare among the Amish?
  2. Have Attention Spans Been Declining?
  3. What’s the Deal With Airplane Food Iodine and Longevity?

That’s right, only three finalists!

Your Mystery: What’s the Deal With A̶i̶r̶p̶l̶a̶n̶e̶ ̶F̶o̶o̶d̶ Iodine and Longevity?

[This is one of the finalists in the SMTM Mysteries Contest, by a reader writing under the pseudonym Lee S. Pubb. We’ll be posting about one of these a week until we have gotten through all the finalists. At the end, we’ll ask you to vote for a favorite, so remember which ones you liked.]

Background

Element 53, iodine, is a mineral essential to human health largely because it is utilized in the production of thyroid hormones.[1] For much of recorded human history, societies the world over suffered from the iodine deficiency disorder known as goiter–swelling in the neck resulting from an enlarged thyroid gland. It was common in regions where topsoil was regularly eroded (e.g., by flooding), as topsoil is rich in iodine, normally leading to its uptake in food crops. It’s also abundant in foods derived from the ocean, as ocean water contains iodine.

While Chinese doctors are said to have prescribed the consumption of animals’ thyroid glands to treat goiter as early as the 7th century, it was only in the early 20th century that large-scale research was done on iodine supplementation. It was found that sufficient levels of iodine consumption eliminated goiter in the vast majority of cases, and we began iodizing salt soon after. (Which is why I had to give this lengthy background on goiter, instead of just saying “that giant lump in your friend’s neck”.) The FDA recommends that Americans consume 150 mcg of iodine a day, and expect that the vast majority of Americans will achieve this through salt consumption.

(Very likely the reason you don’t have a goiter.)

That said, while the level of iodine supplementation present in modern-day table salt is clearly sufficient to greatly reduce the incidence of goiter, that doesn’t necessarily mean that it’s the ideal level for overall thyroid health.[2] (The FDA’s upper limit is set nearly 8 times higher than the RDA, at 1,100 mcg, suggesting that considerably more than the recommended amount isn’t expected to be deleterious to human health.) The thyroid largely regulates metabolism, and you may be familiar with some mysteries raised about human metabolism over the past century.[3] There are also a number of diseases directly associated with thyroid function, and these are pretty common in the present day (especially among women), with around 20 million patients in the United States estimated to have some kind of thyroid disorder. Thyroid functioning is screened for by doctors via blood tests measuring thyroid hormone concentration. Common disorders include hypothyroidism, in which an abnormally low level of thyroid hormone is produced, and hyperthyroidism, in which too much is produced.

INTERESTING!:

The Blue Zones are regions around the world renowned for their high proportion of centenarians, people living to the age of 100 or later. These are Okinawa, Japan; Sardinia, Italy; Nicoya, Costa Rica; Ikaria, Greece, and Loma Linda, California. These zones are now getting the shit studied out of them by anthropologists, doctors, etc., so we can try and figure out why they live so long and hopefully use it to improve human healthspan elsewhere.

You will not be surprised, given the background I just provided, to find out that iodine appears to be related to the mystery of the blue zones.

In the study Association of endemic goitre and exceptional longevity in Sardinia: evidence from an ecological study, the authors note “The spatial analysis revealed that the goitre rate (p < 0.0001), the proportion of inhabitants involved in pastoralism (p = 0.016), the terrain inclination (p = 0.008), and the distance from the workplace as a proxy for physical activity (p = 0.023) were consistently associated with population longevity at an aggregated level in the 377 municipalities.” Which is to say, a higher goiter rate in a municipality was the measure they studied that was most clearly associated with greater longevity. This association had an extremely–to my mind, an almost outrageously–low p-value.

 The study goes on to say that, “from a worldwide perspective, the finding of an epidemiological association between goitre prevalence and longevity does not seem to be limited to Sardinia, but partially shared also by other populations where long-lived subjects are numerous. Most of the Longevity Blue Zones in the past were niches of endemic goitre as well. In Costa Rica, where the Nicoya LBZ was identified in 2007 (Rosero-Bixby 2008), high prevalence of endemic goitre has been reported since the 1950s (Perez et al. 1956) possibly aggravated by a gross excess of calcium ingested with drinking water (Boyle et al. 1966). In another LBZ, Ikaria island, the iodine level in spring water is remarkably low (Pes and Poulain 2014).”

So great, restrict iodine and you’ll live forever, right? AGING SOLVED! WE DID IT, YOU’RE WELCOME, aging is just iodine damage.

…Except.

Another Blue Zone is Okinawa, where most of the population routinely consumes nutritionally large quantities of seaweed–one of the richest natural sources of iodine. How much iodine are they consuming? I don’t have great numbers on Okinawa itself, but mean consumption of iodine in Japan is estimated at around 1-3 milligrams a day–that’s 1,000-3,000 micrograms of iodine. Remember that the FDA puts the RDA of iodine at just 150 micrograms, and the UL at 1,100 micrograms! Apparently, many Japanese people are consuming considerably more than the “tolerable upper intake level” for iodine. Centenarianhood is apparently their reward. Japan has 86,000 centenarians (.06% of their population, the highest percentage in the world), and a life expectancy of 84.62 years, second only to Hong Kong (the population of which, as of 2011, had a high risk of iodine deficiency).

These studies, taken together, suggest that having a moderate iodine intake leads to early death. As the Buddha said, “seek extremes in all things and maybe you can live to be a hundred”.

It is difficult not to propose any explanations for this, but that is the task that has been assigned to me, so, there you have it. Low iodine is correlated with longevity. High iodine is correlated with longevity. The thyroid is truly the most mysterious organ.


[1] If that first sentence surprised you, you’re in good company; iodine is “the heaviest element commonly needed by living organisms.”

[2] Plus, there’s bound to be population variance–I, for one, use kosher salt in my cooking, because Alton Brown told me to, and it’s not iodized. I’m surely exposed to iodized salt via processed foods and restaurant meals, but I do consume those somewhat rarely, at least compared to the number of meals I prepare at home.

[3] Iodine was once used to treat flour, oxidizing it to allow gluten to more easily form bonds and create the texture all us non-celiacs love in bread and pizza. But around the same time we began to study iodine supplementation, we invented potassium bromate, and started brominating flour instead to achieve the same effect–potassium bromate produced a very white flour that rapidly oxidized. Iodine is a necessary mineral, though, and bromine isn’t. So there was likely a point in recent American history where iodine consumption in bread decreased. You’re also really not supposed to consume the potassium bromate, but the thought is that baking temperatures sublimate the bromine–ah fuck I guess you really *shouldn’t* eat raw cookie dough? fuck.

Still not Sold on Seed Oils

Our friend and colleague Experimental Fat Loss over at Experimental Fat Loss just put out a post titled Seed Oils explain the 8 Mysteries of Obesity.

In this post, he takes a look at the 8 mysteries about obesity that we presented in Part I of A Chemical Hunger, and points out that most of them fit the seed oil hypothesis (viz. the obesity epidemic is caused by seed oils, and linoleic acid is probably the mechanism) pretty well.

We agree with ExFatLoss that the mysteries of obesity fit seed oils pretty well. This is part of why when we investigated seed oils in Interlude E (as ExFatLoss mentions) we took them seriously as a hypothesis.

There is room for multiple theories at once. Disagreement and uncertainty at this stage is normal/healthy and it just shows that this is an area where we still don’t understand everything. We can entertain seed oils as a possible explanation, whereas things like “diet and exercise” are non-explanations. And it’s quite possible that many things contribute at once. If any single cause could potentially explain half of the obesity increase since 1970, or even just 25%, that’s still a big deal. 

We also really like this passage, which we think bears reproducing:

By the way, I find the way scientists talk about the “cafeteria diet” to be mystical to the point of being comical. Really, you couldn’t recreate lab chow that made the rats as obese as the human cafeteria diet? Weird, the cafeteria managed to do it.

They somehow imbue “human junk food” with a mystical, obesogenic property that cannot be explained by the sum of its parts, almost like the immortal soul. Please. You could start by differentiating fatty acids.

But despite the good fit with the first 8 mysteries, we’re still not convinced that the seed oil hypothesis is a fit for the evidence overall. In this post we try to explain why.

7 Out of 8 Ain’t Bad, But This is Out of 10  

If we wrote A Chemical Hunger today, Part I would include 10 mysteries, not 8. And one problem with the seed oil hypothesis is that while it provides a pretty good fit to 7 of the 8 original mysteries, it doesn’t match the two new ones.

ExFatLoss pays special attention to the map of obesity in the US (below) which shows a relationship between obesity and elevation. He suggests that could be explained if lower levels of oxygen found at higher altitudes compensate for the damage seed oils do to your metabolism (presuming seed oils do damage to your metabolism, of course), but he admits that this is “not exactly a slam dunk”. 

We take some issue with this interpretation. The mountain ranges definitely stand out as less obese, but the distribution of obesity is not actually a great match with altitude. Low-lying areas of Florida, Massachusetts, and California, for example, also have very low rates of obesity. 

This is why we prefer an interpretation based on the length of the watershed, which we think is a proxy for the levels of some contaminant in the water. Longer watersheds have more of a chance to pick up the contaminant, and to pick up more of it, assuming there is any contamination in their higher reaches. 

In this model, these regions of Florida, Massachusetts, and California are not obese because while they are low-elevation, they are also at the end of very short watersheds, which probably don’t contain much contamination. In some cases (like Boston and San Francisco), the water is piped from pristine wilderness reservoirs deep in the mountains. 

But that map is one thing. A theory of obesity should also be able to explain this map

Mystery 9 is that there is a lot of international variation — some countries are much more obese than others. The most obese nations on Earth are all tiny Pacific Islands. The Middle East is by far the most obese region in the world. The next runners-up are the USA, Canada, and Australia. And these are just the highlights — ideally a theory would be able to explain the whole pattern that appears on the map. 

Seed oils would seem to have a hard time accounting for this pattern, though of course we’re open to explanations. But if Kuwait loves seed oils in a way that Pakistan doesn’t, well, we haven’t heard about it.

In comparison, this mystery is one reason to prefer the lithium hypothesis. You see, fossil fuels are often accompanied by horrible brines, brackish and sometimes radioactive water that is brought to the surface as the oil and gas are extracted. Many of these brines, especially in arid regions, are extremely high in lithium. Despite industry promises, huge volumes of brine are regularly spilled or otherwise improperly disposed of (or sometimes just intentionally used to irrigate crops), and this is a huge source of lithium contamination. We cover this all in more detail in Interlude G, if you want to read more. 

So under the lithium hypothesis, the US, Middle East, Canada, and Australia are all unusually obese because they are all major oil producers, producing from oilfields in arid climates, which have brines high in lithium, leading to major contamination. Major oil producers like Russia and Norway are not very obese because their oilfields are not in arid climates, so their brines probably are not high in lithium, leading to much less contamination (and/or their oilfields are remote enough, or offshore enough, that the contamination doesn’t reach their populations). If this is the case, the map of obesity should roughly line up with the map of oil production, which it does:

The remainder of the international pattern can be explained by other fossil-fuel mining (coal, for example, is also often high in lithium), other forms of intensive mining that might also stir up lithium, countries importing most of their food from one of these high-lithium countries (remember that the US is a major food exporter), and possibly some other sources like desalination. 

Mystery 10 is the variation of obesity rates between professions. Some professions are much more obese than others. Truck drivers, mechanics, firefighters, and transportation workers, for example, tend to be especially obese. Meanwhile teachers, lawyers, engineers, and “health diagnosing occupations”, as four more examples, are much less obese than average. 

The two main sources for these patterns are this survey of more than 37,000 workers from the Washington State Department of Labor and Industries and this 2004-2011 NIH survey of US workers, if you want to take a closer look at the details. People often write this off as being about race or class, but the NIH analysis finds the same general patterns within each race, and many professions at similar class levels have very different rates of obesity.

Again, it seems difficult for the seed oil hypothesis to explain this pattern. Stereotypes about truck drivers aside, do we really think that mechanics consume that much more canola oil than lawyers? 

And again, we see this as another reason to prefer the lithium hypothesis. There are some exceptions, but overall the ranking of professions by obesity rates looks like a pretty good proxy for “amount of exposure to vehicles and heavy machinery”, and lithium grease is the most common lubricating grease used in vehicles and heavy machinery. 

We should be clear that this doesn’t leave the seed oil hypothesis totally dead in the water. A theory doesn’t have to fit all 10 mysteries to be correct. For example, the obesity epidemic could have multiple causes — maybe seed oils caused much of the baseline increase and something else is responsible for the variation internationally and between professions. It’s still possible that this is massively multicausal.

And as we’ve previously written about, reality is very weird and full of bizarre exceptions. Maybe truck drivers and other people who work around vehicles are more obese because ExFatLoss is right and oxygen levels make a difference, and people who are breathing exhaust all day get less oxygen. There’s always a way to add epicycles to save a theory, and sometimes those epicycles are actually correct. 

But that said, the fact that seed oils don’t fit these two mysteries is still a strike against the hypothesis. 

It Doesn’t Fit Case Studies

Our second gripe is that the seed oil hypothesis doesn’t fit a number of individual and population-level case studies.

N=1: Krinn & M 

The seed oil hypothesis doesn’t fit the self-experiment case study of Krinn, who has lost weight taking large doses of potassium. Krinn hasn’t changed her seed oil intake. 

The seed oil hypothesis doesn’t fit the successful half-tato dieters, the best example of which comes from our reader M. He ate more potatoes, but he was still consuming seed oils like normal, and he talks about this pretty explicitly in his report: 

I tossed my diced potatoes in olive oil before air frying, and more generally used olive oil, duck fat and avocado oil to cook other potato preparations. I probably used 1-2 “glugs” of oil per 1-1.5lb potatoes across these preparations (“lightly greased”, call it). And of course in my non-potato meals, I consumed whatever oil – and other ingredients – restaurants would be using to cook their food. Given my diet was substantially made up of non-potato meals that I actively tried to keep “as before”, I think it is a safe bet that there wasn’t any particular type of food (diary, oil, red meat, etc.) I stopped consuming, or even materially reduced my consumption in, as a result of potatoes by default (beyond the generic ~1/3 reduction from swapping out a third of my meals to be mostly potato). 

Pima

The seed oil hypothesis really doesn’t fit the case of the Pima (who we wrote about here and here). This group had a remarkably high rate of obesity in the 1960s, and we have no reason to believe they were exposed to any more seed oils than other Americans. However, we do know that their water contained 50-100x more lithium than the median dose in American municipal water sources at the time. At least one of their food plants was found to concentrate lithium in its berries, so they probably got an even higher dose from their food. 

Frankly this case study is hard to account for by anything but the lithium hypothesis, which is part of why we so strongly prefer that hypothesis. Sievers & Cannon, writing in 1973, even say, “It is tempting to postulate that the lithium intake of Pimas may relate … to relative physical inactivity and high rates of obesity and diabetes mellitus.” 

Fattest and Leanest Places in America

The seed oil hypothesis also doesn’t account for the pattern of fattest and leanest places in America. We can’t see any reason why Charleston, WV would be eating more seed oils than Bridgeport, CT. But we can see a reason why Charleston, WV would be exposed to unusual levels of lithium — because it’s a famous site for the prospecting of salt brines, including brines that as far as we can tell are unusually high in lithium. 

We are still kind of freaked out by how well the pattern of fattest and leanest places fits the lithium hypothesis. The #1 most obese community in America is downstream from three coal power plants that are well-documented to be leaking lithium into the groundwater. The #2 most obese community sits on an aquifer that is unusually high in lithium. The #5 most obese community is in an area with many oilfield brine spills. The #6 most obese community (Charleston, WV) is, as we mentioned, a famous brine extraction site. The #7 most obese community is the site of a lithium plant that recently exploded. So is the #10 most obese community — it’s home to another lithium plant that, yes, also exploded. 

Read our full report in Interlude I for all the gory details, but when you look at the most and least obese communities in America, you find a pattern that looks like fossil fuel activity and industrial lithium accidents. You don’t see a pattern that looks like canola oil taste testing.  

It Would be Easy to Test

No one believes that carrot juice can cure cancer. If it did, anyone could give some cancer patients a bit of carrot juice, effortlessly cure them, use those case studies to raise money for a clinical trial, then pass go and collect their $200 billion and Nobel prize in Physiology or Medicine. We can dismiss out of hand anyone who says that carrot juice does have such wonderful qualities — if it did, they would be out there demonstrating those qualities, not arguing with us. 

Our point is, the easier it would be to collect evidence that a theory is correct, the less seriously we should take the theory in the absence of that evidence. As far as we can tell, if the seed oil hypothesis were correct, it would be easy to get evidence for it. So until seed oil theorists can present that evidence, we’re not inclined to take the seed oil hypothesis very seriously.

Compare also XKCD #808

We’re not saying this as a dig — we’re saying this to encourage seed oil believers to go out there and collect that sweet, strong evidence, if they think they can get it.

The easiest test that comes to mind would be a variation of the potato diet. We know that people lose weight on the potato diet, and the seed oil theorists presumably think that this is because the potato diet is also a seed-oil-elimination diet. People on the potato diet do take some cheat days, but they’re surely consuming a lot less seed oil than usual, maybe close to zero.

It would be easy to run a variation of the potato diet where half the participants are randomly assigned to eat their potatoes with butter, and the other half are randomly assigned to eat their potatoes with sunflower oil. (Or substitute these for whatever fats the seed oil theorists think are best and worst.) If the seed oil theory is correct, then the participants eating potatoes + butter should lose weight much faster than the participants eating potatoes + sunflower oil. If the seed oil theory is wrong, there should be basically no difference.

Ideally you would go on to test more than just two fats — butter and sunflower oil differ in more ways than just how much linoleic acid they contain! But starting with two would be fine, and it would give us an idea of whether or not there’s anything worth looking into here.

If the potato diet offends you for some reason, you could do the same thing with any other elimination diet, or any other weight-loss protocol that we know to be effective. For example, ExFatLoss could add various fats to his ex150 protocol, the same amount of a new fat every week, and see if some fats stall his weight loss and other fats don’t.

Again, WE don’t think that this would shake out in favor of the seed oil hypothesis, which is why we don’t want to run the study ourselves. But if you feel differently, you should try to prove us wrong. 

We want to emphasize that even if one of these studies did find a difference between seed oils and other fats, that wouldn’t be evidence for a specific mechanism — it wouldn’t necessarily point to linoleic acid. For example, it could be pesticides; some of these crops like grapeseed and soybeans and sunflowers might be sprayed with the same pesticide, and that might be the cause of the difference. Hell, it could still be lithium. There’s some evidence that sunflowers concentrate lithium (though “the lowest concentrations [occur] in the seeds”), so it’s possible that there’s more lithium in sunflower oil than in butter. If we need to, we can test for these things.

So this kind of study should be able to point to seed oils pretty easily — and if you’re a seed oil believer, you should try to make one of these studies happen. But if it does point to seed oils, that still doesn’t provide strong evidence for why seed oils might cause obesity. That would remain to be seen, though we would certainly be closer to an answer. 

To recap: lots of things make the seed oil hypothesis an attractive explanation, and we’re still open to the idea. But right now it doesn’t seem very consistent with the evidence, and changing our mind would require addressing some of these apparent contradictions.

Your Mystery: Have Attention Spans Been Declining?

[This is one of the finalists in the SMTM Mysteries Contest, by a reader writing under the pseudonym Cennfaeladh. We’ll be posting about one of these a week until we have gotten through all the finalists. At the end, we’ll ask you to vote for a favorite, so remember which ones you liked.]

[UPDATE: Now that the contest is over, we reveal that the author of this post is niplav, who blogs at niplav.site]

I investigate whether the attention span of individual humans has been falling over the last two decades (prompted by curiosity about whether the introduction of the internet may be harmful to cognitive performance). I find little direct work on the topic, despite its wide appeal. Reviewing related research indicates that individual attention spans might indeed have been declining65%.

In what might be just the age-old regular ephebiphobia, claims have been raised that individual attention spans have been declining—not just among adolescents, but among the general population. If so, this would be quite worrying: Much of the economy in industrialized societies is comprised of knowledge work, and knowledge work depends on attention to the task at hand: switching between tasks too often might prevent progress on complicated and difficult problems.

I became interested in the topic after seeing several claims that e.g. Generation Z allegedly has lower attention spans, observing myself and how I struggled to get any work done when connected to the internet, and hearing reports from others online and in person having the same problem.

The exact question being asked is:

“Have the attention spans of individuals on neutral tasks (that is, tasks that are not specifically intended to be stimulating) declined from 2000 to the present?”

(One might also formulate it as “Is there an equivalent of the “Reversed Flynn Effect” for attention span?”) I am not particularly wedded to the specific timeframe, though the worries mentioned above assert that this has become most stark during the last decade or so, attributing the change to widespread social media/smartphone/internet usage. Data from before 2000 or just the aughts would be less interesting. The near-global COVID-19 lockdows could provide an especially enlightening natural experiment: Did social media usage increase (my guess: yes90%), and if so, did attention spans decrease at the same time (or with a lag) (my guess: also yes75%), but I don’t think anyone has the data on that and wants to share it.

Ideally want to have experiments from ~2000 up to 2019: close enough to the present to see whether there is a downward trend (a bit more than a decade after the introduction of the iPhone in 2007), but before the COVID-19 pandemic which might be a huge confounder, or just have accelerated existing trends (which we can probably check in another 2 years).

I am mostly interested in the attention span of individual humans and not groups: Lorenz-Spreen et al. 2019 investigate the development of a construct they call “collective attention” (and indeed find a decline), but that seems less economically relevant than individual attention span. I am also far less interested in self-perception of attention span, give me data from a proper power- or speed-test, cowards!

So the question I am asking is not any of the following:

  • “Does more social media/internet usage cause decreased attention spans?”
  • “Does more social media/internet usage correlate with decreased attention spans?”
  • “Does more social media/internet usage correlate with people reporting having shorter attention spans?”
  • “Did collective attention spans decrease?”
  • “Are people on average spending less time on webpages than they used to?”

How Is Attention Span Defined?

Attention is generally divided into three distinct categories: sustained attention, which is the consistent focus on a specific task or piece of information over time (Wikipedia states that the span for sustained attention has a leprechaun figure of 10 minutes floating around, elaborated on in Wilson & Korn 2007); selective attention, which is the ability to resist distractions while focusing on important information while performing on a task (the thing trained during mindfulness meditation); and alternating or divided attention, also known as the ability to multitask.

When asking the question “have attention spans been declining”, we’d ideally want the same test measuring all those three aspects of attention (and not just asking people about their perception via surveys), performed annually on large random samples of humans over decades, ideally with additional information such as age, sex, intelligence (or alternatively educational attainment), occupation etc. I’m personally most interested in the development of sustained attention, and less so in the development of selective attention. But I have not been able to find such research, and in fact there is apparently no agreed upon test for measuring attention span in the first place:

She studies attention in drivers and witnesses to crime and says the idea of an “average attention span” is pretty meaningless. “It’s very much task-dependent. How much attention we apply to a task will vary depending on what the task demand is.”

— Simon Maybin quoting Dr. Gemma Briggs, “Busting the attention span myth”, 2017

So, similar to comas, attention span doesn’t exist…sure, super-proton things come in varieties, but which varieties?? And how??? Goddamn, psychologists, do your job and don’t just worship complexity.

Perhaps I should soften my tone, as this perspective appears elsewhere:

[…] Gould suggests the metaphor of a dense bush whose branches are periodically pruned by nature. This allows for parallel evolutionary sequences, some of which are adaptive and others not — at any moment in time only the tips of aseledaptive branches are in evidence, the pruned ones cannot be seen. Thus rather than being direct descendants of primitive hominids, for example, huankind would have evolved along a separate but parallel line from other primates.

Might the ontogeny of selective attention recapitulate this theme? That is, rather than selective attention comprising a single construct with a fixed ontogenic plan, might it be better conceptualized as a multidimensional construct with separat, parallel developmental trajectories for different components. To carry the analogy still further, might the specific developmental progression for a particular component of selective attention be determined by the adaptive fit of that component with the individual’s ‘environmental press’? Although such a conjecture rekindles the tened of ontogeny recapitulates phylogney long since abandoned in physiological development (e.g., Dixon and Lerner, 1985), we suggest that it may nonetheless provide an overarching framework within which to cast life-span research and theory on the development of selective attention.

— Plude et al., “The development of selective attention: A life-span overview” p. 31, 1994

How Do We Measure Attention Span?

One of my hopes was that there is a canonical and well-established (and therefore, ah, tested) test for attention span (or just attention) à la the IQ test for g: If so, I would be able to laboriously go through the literature on attention, extract the individual measurements (and maybe even acquire some datasets) and perform a meta-analysis.

Continuous Performance Tests

For measuring sustained and selective attention, I found the family of continuous performance tests, including the Visual and Auditory CPT (IVA-2), the Test of Variables of Attention (T.O.V.A.), Conners’ CPT-III, the gradCPT and the QbTest, some of which are described here. These tests usually contain two parts: a part with low stimulation and rare changes of stimuli, which tests for lack of attention, and a part with high stimulation and numerous changes of stimuli, which tests for impulsivity/self control.

Those tests usually report four different scores:

  1. Correct detection: This indicates the number of times the client responded to the target stimulus. Higher rates of correct detections indicate better attentional capacity.
  2. Reaction times: This measures the amount of time between the presentation of the stimulus and the client’s response.
  3. Omission errors: This indicates the number of times the target was presented, but the client did not respond/click the mouse. High omission rates indicate that the subject is either not paying attention (distractibility) to stimuli or has a sluggish response.
  4. Commission errors: This score indicates the number of times the client responded but no target was presented. A fast reaction time and high commission error rate points to difficulties with impulsivity. A slow reaction time with high commission and omission errors, indicates inattention in general.

I’m currently unsure about two crucial points:

  • How much does any CPT measure the concept we naively call attention span? The papers I’ve read don’t refer to attention span per se, but a general capability of sustained and selective attention.
  • Are there any time-series analyses or longitudinal studies using a CPT, or alternatively meta-analyses using data collected from existing studies? I have not been able to find any.

Other Heterogenous Metrics

I also attempted to find a survey or review paper on attention span, but was unsuccessful in my quest, so I fell back to collecting metrics for attention span from different papers:

  • Gausby 2015
    • Three online tests (probably devised by the authors (?), since no source is given) (n≈2000 Canadians). Very little information about the exact nature of the tests.
      • Sustained attention span: “Counting the number of times responds correctly identified an X occurring after an A.”
      • Selective attention span: “Counting the number of times respondents correctly identified a change in the orientation of the rectangles”
      • Alternating attention span: “Calculating the difference in the time lapsed to perform a series of consecutive number or letter classification, compared to a mixture of number and letter classifications.”
    • Neurological research: The same games/tests as above with the participants being measured with an EEG (“Results were reported as ACE (Attention, Connectivity, Encoding) scores, as well as the number of attention bursts”) (n=112 Canadians)
  • Carstens et al. 2018 (n=209 American respondents to a survey)
    • Questionnaire developed by the authors based on Conners 2004 (reliability: α=0.786)
  • Wilson & Korn 2007 report several different measures of attention span during lectures: the amount of notes taken over time, observation of the students by an author of one study or two independent observers in another study, retention of material after the lecture, self-report in 5-minute intervals during the lecture, and heart rate. They also note that “Researchers use behaviors such as fidgeting, doodling, yawning, and looking around as indicators of inattentiveness (e.g., Frost, 1965; Johnstone & Percival, 1976).”
  • Plude et al. 1994 review how selective attention develops during a human life. For measuring attention, they mainly focus on studies using reaction time as a metric—the speed at which an action occurs as a result of a changing stimulus: eye movement patterns of infants, simple tests such as pressing a button on a changing (often visual) stimulus, the influence of irrelevant visual stimuli at the periphery on a task performed at the centre of the visual field, judging similarity of stimuli at various distances in the visual field, responding to a target stimulus surrounded by interfering distractor stimuli, and determining whether a visual target item is present or absent. They also mention skin conductance (measuring arousal).
    • They also mention studies investigating the time required for attentional switching in acoustic contexts: “Pearson and Lane (1991a) studied the time course of the attention-shifting process between lists and also found large age-related improvements between 8 and 11 years. Whereas 8-year-olds required more than 3.5 s to completely switch from monitoring one list to another, 11-year-olds and adults appeared to complete the switch in less than 2.5 seconds.”
  • Muhammad 2020
    • Time spent on websites on average.
      • This is not an adequate metric, I believe: It would also decline if people would become better at prioritising on which websites are more worthy of their attention.
  • Lorenz-Spreen et al. 2019
    • Time that specific pieces of information (hashtags/n-grams/Reddit submissions &c) were popular

As it stands, I think there’s a decent chance60% that one or several tests from the CPT family can be used as tests for attention span without much of a problem.

I don’t think a separate dedicated test for attention span exists45%: The set of listed measures I found (apart from the CPT) appears to be too heterogenous, idiosyncratic, mostly not quantitative enough and measuring slightly different things to be robustly useful for a meta-analysis.

What Are the Existing Investigations?

A lack of long-term studies means we can’t tell whether attention spans have actually declined.

—Bobby Duffy & Marion Thain, “Do we have your attention” p. 5, 2022

  • Gausby 2015
    • Questions answered:
      • Sustained attention:
        • Do younger people perform worse on the sustained attention span test?, Yes (31% high sustained attention for group aged 18-34, 34% for group aged 35-54, and 35% group aged 55+) (the methodology is wholly unclear here, though: how do we determine the group that has “high sustained attention span”? Did they perform any statisitical tests? If yes, which?).
        • Do people who report more technology usage (web browsing/multi-screen usage while online/social media usage/tech adoption) perform worse on the sustained attention span test?, Yes. Light:medium:heavy usage for web browsing has 39%:33%:27% users with high sustained attention span, 36%:33%:27% for light:medium:heavy multi-screen usage, 36%:29%:23% for light:medium:heavy social media usage and 35%:31%:25% for light:medium:heavy tech adoption (though these numbers are basically not elaborated on).
      • Selective attention:
        • Do younger people perform worse on the selective attention span test? No (34% high selective attention for group aged 18-34, 30% for group aged 35-54, and 35% group aged 55+).
        • Do people with high selective attention use fewer devices at the same time? Yes (details p. 31).
      • Alternating attention:
        • Do younger people perform worse on the alternating attention span test? No (36% high selective attention for group aged 18-34, 28% for group aged 35-54, and 36% group aged 55+).
        • Do people who report more technology usage (tech adoption/web browsing/multi-screen usage while online) perform worse on the alternating attention span test? No, they seem to perform better: Light:medium:heavy tech adoption corresponds to 31%:39%:40% having high alternating attention spans, light:medium:heavy web browsing to 29%:34%:37% and multi-screening while online to 27%:32%:37%.
        • Do people who use social media more have higher Attention/Connection/Encoding scores on EEG measurements?, Not quite: “Moderate users of social media are better at multi-tasking than lower users. But, when crossing into the top quartile of social media usage, scores plummet.”
    • This is a marketing statement wearing the skinsuit of a previously great paper, it would be awesome if they released their exact methodology (tests performed, data collected, exact calculations & code written). I can smell that they actually put effort into the research: Creating an actual test instead of just asking respondents about their attention spans, doing EEG measurements of over 100 people, for 3 different types of attention…come on! Just put out there what you did!
  • Carstens et al. 2018 (n=209 American respondents to a survey)
    • Questions answered:
      • Is self-reported attention span related to the number of social media accounts?, No, not statistically significant (F(2, 206)=0.1223, p>0.05) (via a one-way ANOVA)
      • Is self-reported attention span related to whether a respondent mainly uses a mobile phone or a computer?, No, not statistically significant (P(2,713)=0.923, p>0.05) (via a one-way ANOVA)
    • I do not trust this paper: Calling (what I think is) Generation Z “Generation D” (without source for the term), being clearly written in Word, and confusing grammar (I think the authors are all Americans, so no excuse here):

Users that are older such as late adolescents and emerging adults average approximately 30-minutes daily for just Facebook that does not calculate the time spent on all social media networks

—Carstens et al., “Social Media Impact on Attention Span” p. 2, 2018

Bakardjieva and Gaden (2012) examined the field of social interaction in general to the everyday chatter of unstructured and spontaneous interactions among individuals to highly structured and regulated interaction consisting of the military or the stock exchange.

—Carstens et al., “Social Media Impact on Attention Span” p. 3, 2018

  • Muhammad 2020
    • Question answered: How much time do people spend on a website, on average?, “if you look at the trend for mobile browsing between the years 2017 and 2019 you would see that there is a drop of about 11 seconds in the average time spent on a website.” and “The data suggests that the average amount of time spent on websites before navigating away for all devices has gone down by 49 seconds which is a pretty huge reduction all things considered.”
    • The data is from the right timeframe (up to but not including 2020), but the linked SimilarWeb report is behind a paywall, so I can’t confirm the numbers. Furthermore, the time spent on websites is a weak proxy: Perhaps people simply have become better at prioritising information sources.
  • Lorenz-Spreen et al. 2019
    • Questions answered:
      • How long does any particular hashtag stay in the group of the top 50 most used hashtags? Specifically, how has that number developed from 2013 to 2016?, “in 2013 a hashtag stayed within the top 50 for 17.5 hours on average, a number which gradually decreases to 11.9 hours in 2016”, and “The average maximum popularity ⟨L(tpeak)⟩

on one day tpeak stays relatively constant, while the average gradients ⟨ΔL⟩

  • in positive and negative direction become steeper over the years.”
  • Do things become more popular faster over time? That is, when e.g. a movie is gaining popularity, did it take longer to become popular in 1985 than it did in 2018?, Broadly yes (the trends holds for popularity of hashtags in tweets (2013-2016)/n-grams in books (1900-2004)/number of theaters that movies were screened in (1985-2018)/topics for search queries on Google (2010-2017)/Reddit comments on posts (2010-2015)/citations of publications (1990-2015)/daily traffic for Wikipedia articles (2012-2017)). Again the length of the time at the peak mostly didn’t change (except in the case of Wikipedia articles, where the time at the peak shrunk)
  • While it investigates a question different from the one I have, this paper seems good and trustworthy to me, while supporting a suspicion I’ve had (observing that the lifecycle of e.g. memes has apparently sped up significantly). I’d be interested in seeing whether the same process holds for internet communities I’m part of (for example on votes LessWrong and the EA Forum or forecasts on Metaculus).
Chart indicating how the speed at which hashtags become popular changed over the years. Four plots (yellow, green, blue and purple) which form a peak in the middle and fall off at the sides. The yellow line is highest around the peak, the green one is lower, blue even lower and purple the lowest.

Mark 2023 is a recent book about attention spans, which I was excited to read and find the important studies I’d missed. Unfortunately, it is quite thin on talking about the development of attention span over time. It states that

My own research, as well as those of others, has shown that over the last fifteen years, our attention spans have declined in duration when we use our devices. Our attention spans while on our computers and smartphones have become short—crazily short—as we now spend about forty-seven seconds on any screen on average.

—Gloria Mark, “Attention Span” p. 13/14, 2023

which is not quite strong enough a measurement for me.

In 2004, in our earliest study, we found that people averaged about one hundred fifty seconds (two and a half minutes) on a computer screen before switching their attention to another screen; in 2012, the average went down to seventy-five seconds before switching. In later years, from 2016 to 2021, the average amount of time on any screen before switching was found to be relatively consistent between forty-four and fifty seconds. Others replicated our results, also with computer logging. seconds. Others replicated our results, also with computer logging. André Meyer and colleagues at Microsoft Research found the average attention span of twenty software developers over eleven workdays to be fifty seconds.⁹ For her dissertation, my student Fatema Akbar found the average attention span of fifty office workers in various jobs over a period of three to four weeks to be a mere forty-four seconds.¹⁰ In other words, in the last several years, every day and all day in the workplace, people switch their attention on computer screens about every forty-seven seconds on average. In fact, in 2016 we found the median (i.e., midpoint) for length of attention duration to be forty seconds.¹¹ This means that half the observations of attention length on any screen were shorter than forty seconds.

—Gloria Mark, “Attention Span” p. 74/75, 2023

She doesn’t mention the hypothesis that this could be the symptom of a higher ability to prioritize tasks, although she is adamant that multi-tasking is bad.

Furthermore, this behavior displays only a decrease in the propensity of attention, but not necessarily one of capacity: Perhaps people could concentrate more, if they wanted to/were incentivized to, but they don’t, because there is no strong intent to or reward for doing so. Admittedly, this is less of an argument in the workplace where these studies were conducted, but perhaps people just care not as much about their jobs (or so I’ve heard).

when email was cut off, people’s attention spans were significantly longer while working on their computers—in other words, they switched their attention less frequently.

—Gloria Mark, “Attention Span” p. 97, 2023

She gives some useful statistics about time spent on screens:

Nielsen reports that Americans spend on average five hours and thirty minutes daily of screen time on their computers, tablets and phones8. […] But what is really astonishing is that when we add in the time watching other media like TV and films to this, then we see that our attention is fixated on some form of screen, in some type of mediated environment, nearly ten hours a day8.

—Gloria Mark, “Attention Span” p. 180, 2023

She connects attention span to shot-length in movies:

The type of motion within shots has been changing. According to film scholar James Cutting and his colleagues at Cornell, shots containing the onset of motion (like a standing person who then runs) have increased because filmmakers believe that it will better attract viewers’ attention. […] The average film shot length in 1930 was twelve seconds, but then began to shorten, reaching an average of less than four seconds after the year 2010, as measured by James Cutting and colleagues.12 Interestingly, the shot length for film sequels also decreased. For example, the shot length of the first Iron Man film averaged about 3.7 seconds; for Iron Man 2, 3.0 seconds; and for Iron Man 3, about 2.4 seconds.13

—Gloria Mark, “Attention Span” p. 180/181, 2023

Like in TV and film, shot lengths in television commercials also shortened over time. The average shot length of commercials in 1978 was 3.8 seconds, dropping down to an average of 2.3 seconds in 1991. […] It’s not just the shot lengths, though, that are short—the overall length of advertisements on TV has also decreased. The majority of ads started out as sixty seconds in length in the 1950s,26 but that length comprised only 5 percent of ads shown in 2017. In the 1980s, advertisers started experimenting with showing fifteen-second ads instead of thirty-second ads. They discovered that fifteen seconds was even more persuasive than thirty seconds, especially when the ads used elements expressing cuteness and humor.27 In 2014, 61 percent of ads were thirty seconds in length, but three years later, that percentage decreased to 49 percent.28

—Gloria Mark, “Attention Span” p. 189, 2023

Do People Believe Attention Spans Have Declined?

Half of the public feel their attention span is shorter than it used to be, compared with around a quarter (23%) who believe they are just attentive [sic] as they’ve always been.

Again, the feeling of is not just reported by the young — it’s also the dominant feeling among the middle aged too, with 56% of 35- to 54-year-olds thinking their attention spans have worsened.

—Bobby Duffy & Marion Thain, “Do we have your attention” p. 6, 2022

Even more widespread is the belief that young people’s attention spans in particular are worse than they were in the past—two-thirds of people think this is the case (66%).

Perhaps unsurprisingly, this belief is most common among the oldest age group surveyed, of those aged 55 or over — however, young people themselves also feel this way, with a majority of 18- 34-year-olds holding this view.

—Bobby Duffy & Marion Thain, “Do we have your attention” p. 7, 2022

Note that selective attention mostly improves with age, so the older age-groups might be comparing themselves now to the younger age groups now (as opposed to remembering back at their own attention spans).

The absence of long-term research means it remains unknown whether technology has caused a deterioration in the country’s ability to concentrate — but comparisons with survey data from previous decades indicate that, on some measures the public feel more pressured than they did in the past.

—Bobby Duffy & Marion Thain, “Do we have your attention” p. 18, 2022

In response to the questions (n=2093 UK adults aged 18+ in 2021):

  • “To what extent do you agree or disagree with the following statement? The pace of life is too much for me these days” (1983: 30% agree, 2021: 41% agree)
  • “To what extent do you agree or disagree with the following statement? I wish I could slow down the pace of my life” (1997: 47% agree, 1999: 51% agree, 2008: 45% agree, 2021: 54% agree)

What About Rates of ADHD?

Data from the CDC shows a clear increase in the percentage of children with a parent-reported ADHD diagnosis:

There has been a similar increase in the diagnosis of ADHD among adults, “from 0.43 to 0.96 percent” between 2007 and 2016.

However, this does not necessarily mean that the rate of ADHD has increased, if e.g. awareness of ADHD has increased and therefore leads to more diagnoses.

What Could A Study Look Like?

Compared to other feats that psychology is accomplishing, finding out whether individual attention spans are declining appears to be of medium difficulty, so I’ll try to outline how this could be accomplished in three different ways:

  1. Develop a good instrument for measuring attention span (optionally just use a continuous performance test). Once one has a suitable instrument for measuring attention span, one can every year (or every second year) for a couple of years pick a random sample from the population (not of the same set of people, though, since attention span increases with age), e.g. via the internet if the test can be done online. One could then apply a linear trend estimation or a fancier statistical technique I don’t know to find out whether attention spans have declined between the measurements.
    1. This could be done relatively cheaply: Let’s say we collect 50 datapoints a year, from Mechanical Turk workers at $10/hr. A conservative estimate is that the test takes ~30 minutes to complete, so for three years the cost of the data would be 50⋅3⋅10$/h⋅0.5h=$750. It looks like there are open-source implementations of the test available (Conners’ CPT 3 costs $1.5k), so the additional cost is for the researcher setting up the test and recruiting the participants, which could take ~30 hours, and another ~30 hours for analysing the data. So the total cost of the experiment would be, at an hourly wage of $15 for the researcher (come on, we can let a grad student do it), $750+60h⋅15$/h=$1650
  2. . Fudging upwards by taking the planning fallacy into account gives $2k for the experiment.
  1. Find someone who has been collecting data on attention span, ask them for it nicely, and analyse that data.
  2. Use the control groups from studies testing the effect of interventions on attention as data and then perform a meta-analysis. A lot of studies use some variant of the CPT, I started collecting such studies in Appendix B.

Conclusion

Given the amount of interest the question about shrinking attention spans has received, I was surprised to not find a knockdown study of the type I was looking for, and instead many different investigations that were either not quite answering the question I was asking or too shoddy (or murky) to be trusted. It seems likely to me that individual attention spans have declined (I’d give it ~70%), but I wouldn’t be surprised if the decline was relatively small, noisy & dependent on specific tests.

So—why hasn’t anyone investigated this question to satisfaction yet? After all, it doesn’t seem to me to be extremely difficult to do (compared to other things science has accomplished), there is pretty clearly a lot of media attention on the question (so much so that a likely incorrect number proliferates far & wide), it appears economically and strategically relevant to me (especially sustained attention is probably an important factor in knowledge work, I’d guess?) and it slots more or less into cognitive psychology.

I’m not sure why this hasn’t happened yet (and consider this text evidence for a partial violation of Cowen’s 2nd law—although, to be fair, the law doesn’t specify there needs to be a good literature on everything…). The reasons I can think of is that one would need to first develop a good test for determining attention span, which is some work in itself (or use the CPT); be relatively patient (since the test would need to be re-run at least twice with a >1 year pause, for which the best grant structure might not exist); there are many partial investigations into the topic, making it appear like it’s solved; and perhaps there just aren’t enough cognitive psychologists around to investigate all the interesting questions that come up.

So I want to end with a call to action: If you have the capacity to study this problem, there is room for improvement in the existing literature! Attention spans could be important, it’s probably not hard to measure them, and many people claim that they’re declining, but are way too confident about it given the state of the evidence. False numbers are widely circulated, meaning that correct numbers might be cited even more widely. And it’s probably not even (that) hard!

Consider your incentives :-).

Appendix A: Claims That Attention Spans Have Been Declining

Most of these are either unsourced or cite Gausby 2015 fallaciously (which Bradbury 2016 conjectures to be the number of seconds spent on websites on average).

Today, individuals are constantly on an information overload from both the quantity of information available and the speed of which information gets into the hands of individuals through advertising and multimedia. Attention deficits tend to be increasing as it is challenging to attract individuals and hold their attention long enough for people to read or watch messages such as work memos, advertisements, etc.

—Carstens et al., “Social Media Impact on Attention Span” p. 2, 2018

Big data plays an important role in the development of microlearning. In the age of big data, human’s attention span is decreasing. As per Hebert (1971), “what information consumes is rather obvious: it consumes the attention of its recipients. Hence a wealth of information creates a poverty of attention and a need to allocate that attention efficiently among the overabundance of information sources that might consume it” (p. 41). An example of short attention span in the age of big data can be found in the music industry, as per (Gauvin, 2017), the average time that passed before the audience would hear the vocals on any radio song was 23 s, today the average intro is just 5 s long. Wertz (2017) also suggested that 40% of users are likely to abandon a website if it does not load within three seconds or less. Furthermore, a survey (Gausby, 2015) conducted by Microsoft indicated that the average attention span of a human dropped from 12 to eight seconds, which means shorter than a goldfish. Given the average human attention span is decreasing, microlearning becomes more and more important because it emphasises short learning duration.

—Leong et al., “A review of the trend of microlearning” p. 2, 2020

Unfortunately, all too many of us are having “squirrel” days, according to Dr. Gloria Mark, a professor of informatics at the University of California, Irvine, who studies how digital media impacts our lives. In her new book, “Attention Span: A Groundbreaking Way to Restore Balance, Happiness and Productivity,” Mark explained how decades of research has tracked the decline of the ability to focus.

“In 2004, we measured the average attention on a screen to be 2½ minutes,” Mark said. “Some years later, we found attention spans to be about 75 seconds. Now we find people can only pay attention to one screen for an average of 47 seconds.”

Not only do people concentrate for less than a minute on any one screen, Mark said, but when attention is diverted from an active work project, it also takes about 25 minutes to refocus on that task.

—Sandee LaMotte, “Your attention span is shrinking, studies say. Here’s how to stay focused”, 2023

Tech-savvy users often say that the way the modern internet works has made it so that people’s attention spans are getting shorter every single day but the truth behind this story is rather tough to ascertain. However, recent data from SimilarWeb indicates that people definitely are suffering from shorter attention spans, and what’s more is that these attention spans are shortening at a pretty rapid pace when you take into account the numerous factors that are coming into play, all of which serve some kind of purpose in this trend.

If you look at the data for how long users spend on websites before navigating away, for the most part the trend has been that these times are remaining more or less stable on web based browsing, but if you look at the trend for mobile browsing between the years 2017 and 2019 you would see that there is a drop of about 11 seconds in the average time spent on a website. When you take into account the fact that mobile browsing is starting to become a lot more popular and in many ways has become the preferred form of browsing for people on the internet, the change is a lot more drastic.

—Zia Muhammad, “Research Indicates That Attention Spans Are Shortening”, 2020

However, as much as technology can be used as an effective learning tool inside and outside the classroom, there’s no denying that one of the biggest challenges faced by educators today is the distraction posed by social media. Students are distracted by their phones during class, and even without that distraction, the time they spend on social media outside the classroom has an impact on their attention spans.

—EU Business School, “The Truth about Decreasing Attention Spans in University Students”, 2022

(No link given.)

In 2015, a study commissioned by Microsoft and discussed in Time magazine found that the average attention span was in fact only 8 s. If indeed this is the case, then even participating in a 15-min lecture would be positively heroic. To place this in perspective, it was reported in the same Time article, that goldfish, of the piscine rather than snack variety, have an attention span of 9 s, one whole second greater than humans! It is perhaps rather premature to opt for an 8-s lecture format, as there are many caveats to the Time article, not the least of which is that no one knows how to actually measure a goldfish’s attention span. What has been measured is goldfish memory, which, according to researchers in the School of Psychology at the University of Plymouth, is actually quite good (7). Similarly the 8-s attention span for humans actually reflects the average time a person will spend on a web page before looking somewhere else.

—Neil A. Bradbury, “Attention span during lectures: 8 seconds, 10 minutes, or more?”, 2016

Appendix B: Studies for a Meta-Analysis

I’ll list the closest thing those studies have to a control group, list sorted by year.

Studies Using the CPT

Furthermore, “Is the Continuous Performance Task a Valuable Research Tool for use with Children with Attention-Deficit-Hyperactivity Disorder” (Linda S. Siegel/Penny V. Corkum, 1993) p. 8-9 contains references to several studies from before 1993 using the CPT on children with ADHD.

Appendix C: How I Believed One Might Measure Attention Span Before I Found Out About The CPT

Before I found out about the Continuous Performance Test, I speculated about how to measure attention span:

(Note that I’m not a psychometrician, but I like speculating about things, so the ideas below might contain subtle and glaring mistakes. Noting them down here anyway because I might want to implement them at some point.)

It seems relatively easy to measure attention span with a power- or speed-test, via one of three methods:

  1. Present a stimulus, change the stimulus and let the test subject report the change in stimulus; this results in two numbers: the time between the stimulus being initially being presented and the time it was changed (let’s call this value t_change), and the time between the change of the stimulus and the reporting of the change (calling this value t_report). Performing this test with different value of t_change should result in different values of t_report. There is a t_change for which t_report falls over a threshold value, that t_change can be called the attention span.
    1. This method has some disadvantages:
      1. It needs a change in stimulus that requires selective attention to notice, but changing e.g. visual stimuli involves motion, which direct attention. (Idea: have a colored stimulus continuously changing color, and a reference color, once the stimulus has the reference color, the subject is supposed to report; avoiding sudden changes in visual stimuli.)
      2. The method would require many samples to find the t_change for which t_report falls over the threshold value.
      3. Performing the test multiple times in a row might induce mental fatigue, decreasing attention span
  2. Let the test subject engage in a mentally draining exercise like the Stroop test with some performance measure. I would the performance to decline over time, and one could define a threshold value at which the subject “is no longer paying attention”.
  3. Let the subject observe a neutral stimulus while measuring some indicator of attention (such as arousal via skin conductivity or the default mode network being inactive), when the measured value falls under/over a threshold the subject has “lost attention”.
    1. This method has the major disadvantage that it requires special equipment to perform.

Such an instrument would of course need to have different forms of reliability and validity, and I think it would probably work best as a power test or a speed test.

I’m not sure how such a test would relate to standard IQ tests: would it simply measure a subpart of g, completely independent or just partially related to it?