
[PART I – MYSTERIES]
[PART II – CURRENT THEORIES OF OBESITY ARE INADEQUATE]
[PART III – ENVIRONMENTAL CONTAMINANTS]
[INTERLUDE A – CICO KILLER, QU’EST-CE QUE C’EST?]
[PART IV – CRITERIA]
[PART V – LIVESTOCK ANTIBIOTICS]
[INTERLUDE B – THE NUTRIENT SLUDGE DIET]
[PART VI – PFAS]
[PART VII – LITHIUM]
[INTERLUDE C – HIGHLIGHTS FROM THE REDDIT COMMENTS]
[INTERLUDE D – GLYPHOSATE (AKA THE ACTIVE INGREDIENT IN ROUNDUP)]
[INTERLUDE E – BAD SEEDS]
[PART VIII – PARADOXICAL REACTIONS]
[PART IX – ANOREXIA IN ANIMALS]
[INTERLUDE F – DEMOGRAPHICS]
[INTERLUDE G – Li+]
A while back, one of us was talking to a family member about the improperly sealed abandoned boreholes in the Gila River Valley, and how oilfield brines are really high in lithium. This inspired him to speculate that while most of us don’t live near improperly sealed abandoned boreholes, there is a different kind of hole in the ground that many of us interact with every day — the wells we draw our water from.
There are a couple of things that make water wells seem kind of suspicious. When it comes to obesity, we’re looking for something that’s really universal, something that would reach pretty much everyone, because every part of the world is becoming more obese all the time. Maybe some people have oilfield brines in their water, sure. But not everyone is downriver from a pipeline.
Well, back in the day, nobody got their water from deep, drilled wells. Nowadays, millions of people drink well water every single day. The USGS estimates that 115 million people, more than one-third of the nation’s population, rely on groundwater for drinking water, and that 43 million of those people are drinking from private wells. And just because you aren’t drinking well water doesn’t mean you’re not affected — when all those wells bring up water from the depths, it ends up mixing with the surface water.
This could represent a pretty big change in the ecosystem. You might think of groundwater as just normal water — maybe more pure, but still just water. But often it’s not like surface water at all. Some of the water flowing underground has been there only for a few weeks, but some of that water has been down there for hundreds, thousands, or even millions of years.
Generally speaking, the deeper the well, the older the water you’re drawing. But sometimes even relatively shallow wells draw from very old waters. For example, this analysis from Alberta suggests that in the Paskapoo Formation aquifers, “a very important source of water for irrigation and drinking in southwestern Alberta,” some water samples drawn from relatively shallow depths (less than 60 meters) are more than 1,000,000 years old.
Who knows what might be down there. The USGS helpfully notes, “old groundwater is more likely than young groundwater to have contaminants from natural sources, such as metals and radionuclides, because old groundwater can spend thousands of years in contact with and reacting with aquifer rocks and minerals that might contain these elements.” If water from drilled wells tends to have more lithium in it than water from shallow wells or surface water does, that would explain why people are exposed to more lithium now than they used to be, and could explain why the exposure is so universal.

Basic well-drilling technology first arose in the early 1800s. We can take as an example Levi Disbrow, who according to some sources drilled the first artesian well in the United States in 1824. Things took a leap forward in 1909 when a patent for the first roller cone drill bit was issued to Howard Hughes Sr. — but even then, drilling tools were all still platform-based, and impractical for homeowners. It wasn’t until the 1940s that portable drills became effective, and it took until the 1970s for drilled wells to become common for individual homes.
Most states keep pretty good records for drilled wells, so we’re able to confirm this with publicly available data. Rather than trying to hunt down data for every state, we did some spot checks. For example, Massachusetts keeps a database of wells dating back to 1962. Looking just at new, domestic wells, we see that about 96% were drilled in 1970 or later, and about 91% were drilled in 1980 or later. The two biggest decades for domestic drilling in Massachusetts were the 1990s and the 2000s, when about 37,000 wells were drilled each decade.
In Vermont, well drillers have been required to submit reports to the state on each well they drill since 1966, but there are some records dating as far back as 1924. We found that of the wells in the database, 96% had been drilled since 1970, and 83% had been drilled since 1980. Again, the two decades with the most well drilling were the 1990s and 2000s.
Since we mentioned bioaccumulation in plants last time, we also want to mention that a lot of crops these days are irrigated with water from drilled wells. Without getting too much into the details, it looks like most irrigation wells were also drilled pretty recently. In Kansas for example, it looks like only five of the irrigation wells on record were drilled before 1970, compared to about 22,000 wells drilled afterwards!
The timeline for drilled wells lines up pretty well with the timeline for the spread of obesity. These days lots of people get their water from drilled wells, but that’s historically weird. If well water contains more lithium than surface water does, and lithium causes obesity, that would explain why obesity is so widespread.
The second reason this seems plausible is that similar things have happened with well-drilling and other contaminants. Let’s look at one well-documented example (h/t Phil Wagner):
It was the best intentions of governments and world bodies in the 1970s to improve health that led to the crisis in Bangladesh. Until the 1980s, most villagers drew water from shallow wells, or collected it from ponds and rivers – and regularly suffered cholera, dysentery and other water-borne diseases.
In response to these preventable illnesses, the UN and many western donors advised Bangladesh to bore deeper “tube wells” into the underground water aquifers to draw clean, pathogen-free water. But the scientists and donors advised drilling to about 150ft (46m) – almost precisely the depth of arsenic-rich rock.
The first cases of arsenic poisoning were discovered in the early 1990s, and, in 1995, an international conference in Kolkata drew the world’s attention to the problem.
Efforts have been made to do something about this, but it still seems to be a huge problem. This report from the Human Rights Watch in 2016 says that “an estimated 43,000 people die each year from arsenic-related illness in Bangladesh”.
Similar contamination can be found elsewhere. In parts of India, wells are contaminated with uranium.
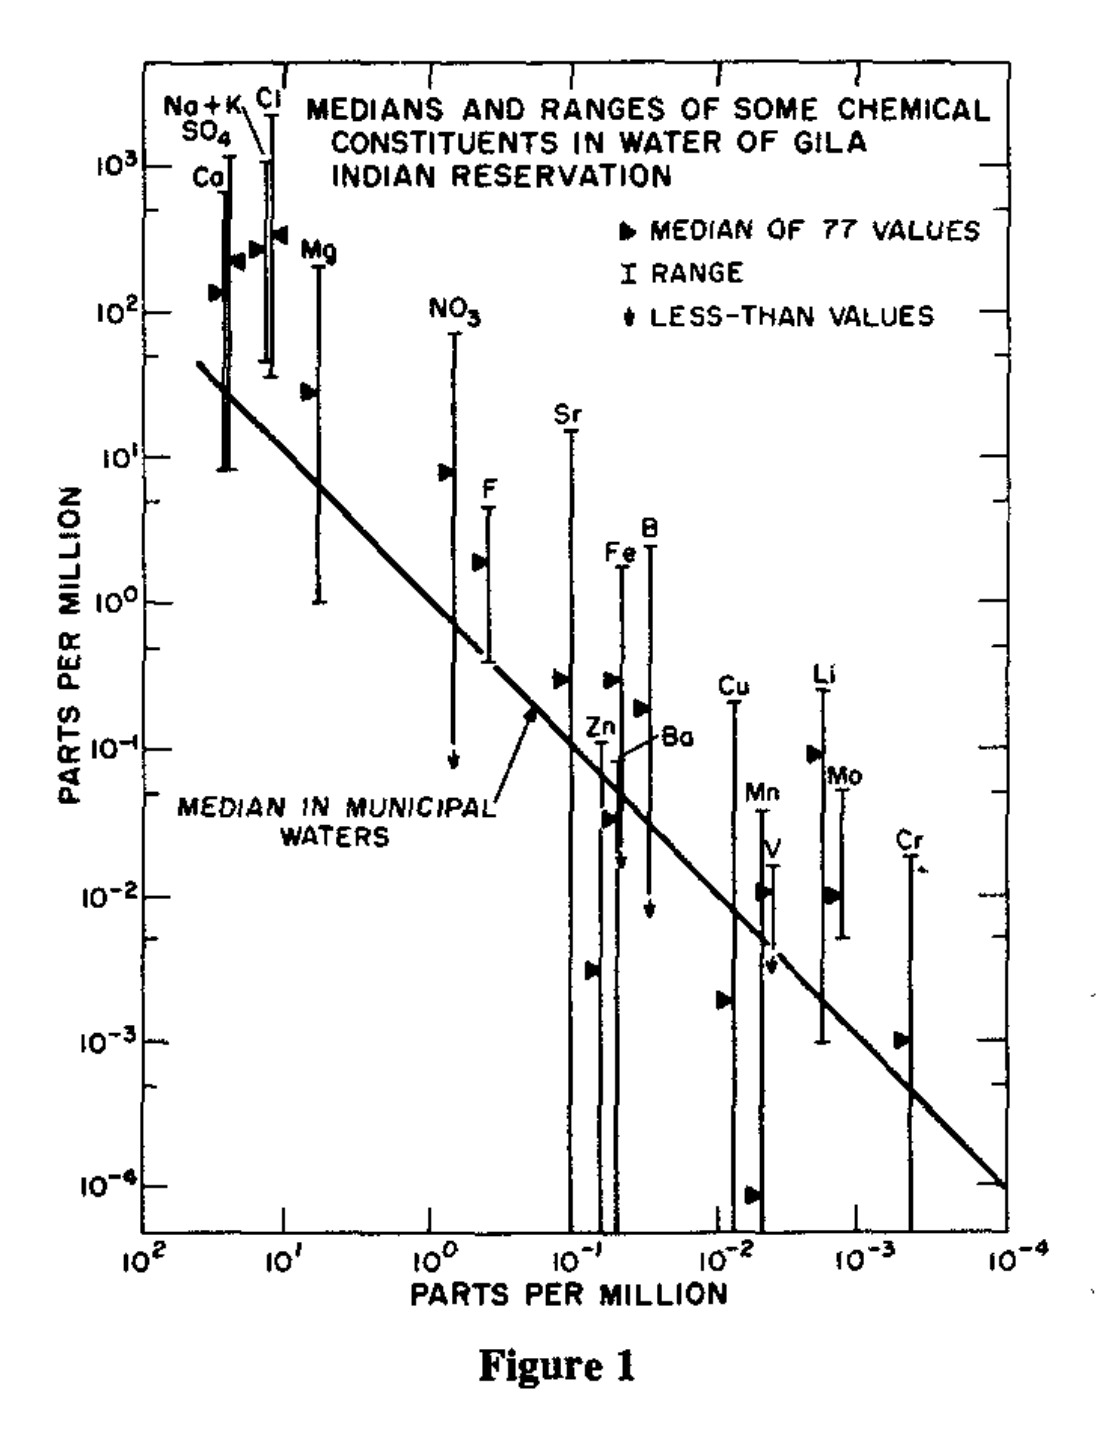
Third and finally, we want to point to a few examples that indicate that lithium specifically might be a problem in deep, drilled wells. The first is a passage from Sievers & Cannon (1973), the Gila River Valley paper, about where the Pima got their home drinking water:
Wells, the main source of domestic water, have needed deepening because the ground-water table has dropped at least 20 feet in the last few years. The lower aquifers now in use produce water of higher salt content than previously.
They don’t quite say it outright, but this suggests that the Pima wouldn’t have been exposed to as much lithium if they hadn’t deepened their wells. The lower aquifers have a higher salt content, and this likely includes dissolved lithium salts.
An even clearer example can be found in this paper about lithium levels in part of Maryland in 1976, where they found that deep wells had abnormally high levels of lithium compared to other sources:
Lithium levels varied by type of water source. The highest lithium levels were found in deep wells. Two thirds of the samples with concentrations greater than or equal to 10 [ng/mL] were found in deep wells, and 24% of the deep wells had concentrations greater than or equal to 10 [ng/mL]. City waters had no levels greater than 12 [ng/mL], and less than 2% had levels over 10 [ng/mL].
This all just makes the idea seem plausible. What we really want to know is, is there an appreciable amount of lithium in well water today?
Lithium in Modern America
The answer is yes!
The first time we wrote about lithium, we said we didn’t know if there was lithium in the groundwater, we didn’t know if groundwater concentrations of lithium had increased over time, and the USGS wasn’t interested. Well, we are happy to report that all of that has changed.
On February 11, 2021, the USGS released a report titled Lithium in U.S. Groundwater. The first conclusion they share is that “45% of public-supply wells and about 37% of U.S. domestic supply wells have concentrations of lithium that could present a potential human-health risk.” It doesn’t get any better from there. The header for the report looks like this:
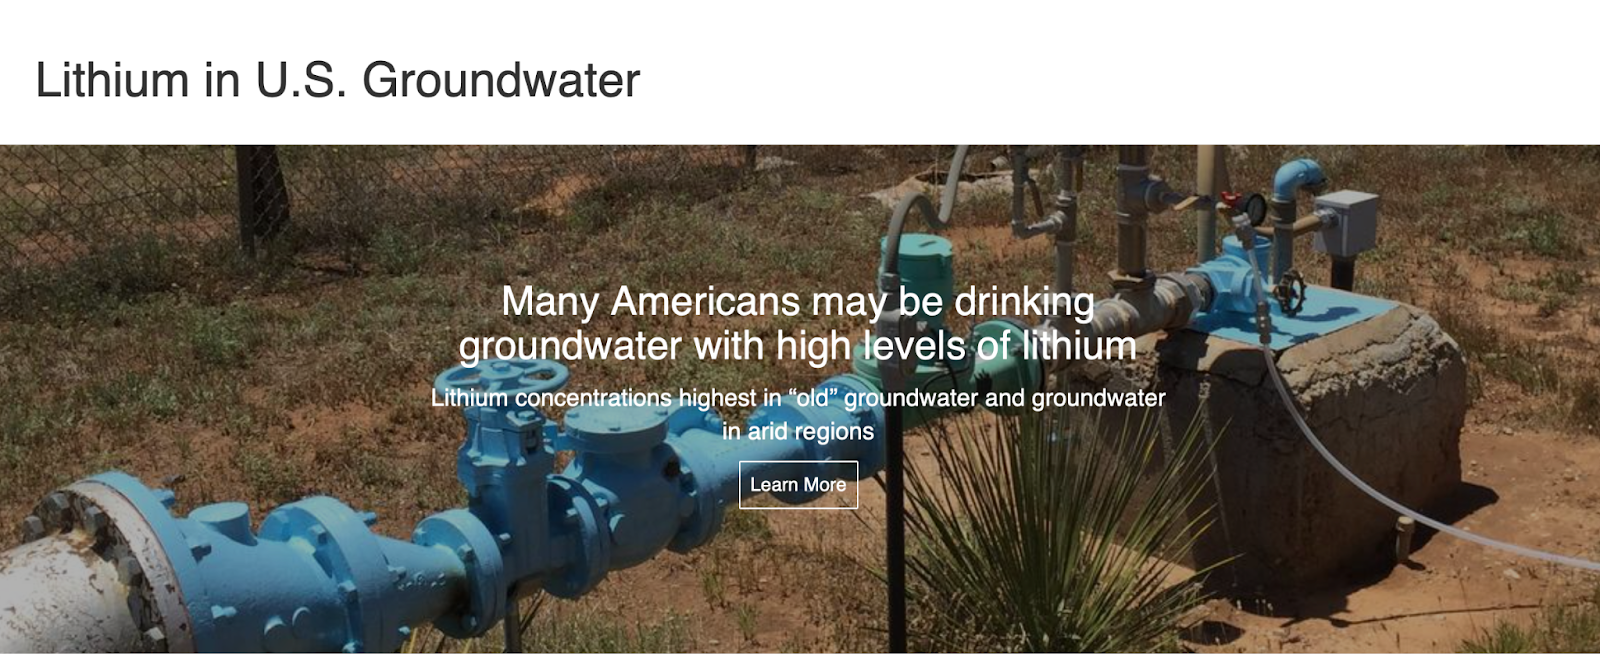
The report is backed by a paper released on May 1, 2021. The raw data is available here (see the two urls near the bottom).
There’s a lot of interesting stuff in this paper, but mostly we want to know if there are serious levels of lithium in well water, and if most Americans are getting lithium in their drinking water. The answer in both cases seems to be a pretty clear “yes”:
Concentrations nationwide ranged from <1 to 396 [ng/mL] (median of 8.1 [ng/mL]) for public supply wells and <1 to 1700 [ng/mL] (median of 6 [ng/mL]) for domestic supply wells. For context, lithium concentrations were compared to a Health Based Screening Level (HBSL, 10 [ng/mL]) and a drinking-water only threshold (60 [ng/mL]). These thresholds were exceeded in 45% and 9% of samples from public-supply wells and in 37% and 6% from domestic-supply wells, respectively
This dataset includes a few samples from as far back as 1991, but almost all the samples were collected after 2000, and the biggest chunk are all from 2010 or later, so this is a pretty modern dataset. As we can see, the median concentration in well water is about 6-8 ng/mL, though this kind of obscures the fact that about 40% of all wells contain more than 10 ng/mL of lithium. Since we have the raw data, we can clarify and state that the median for all samples was 6.9 ng/mL.
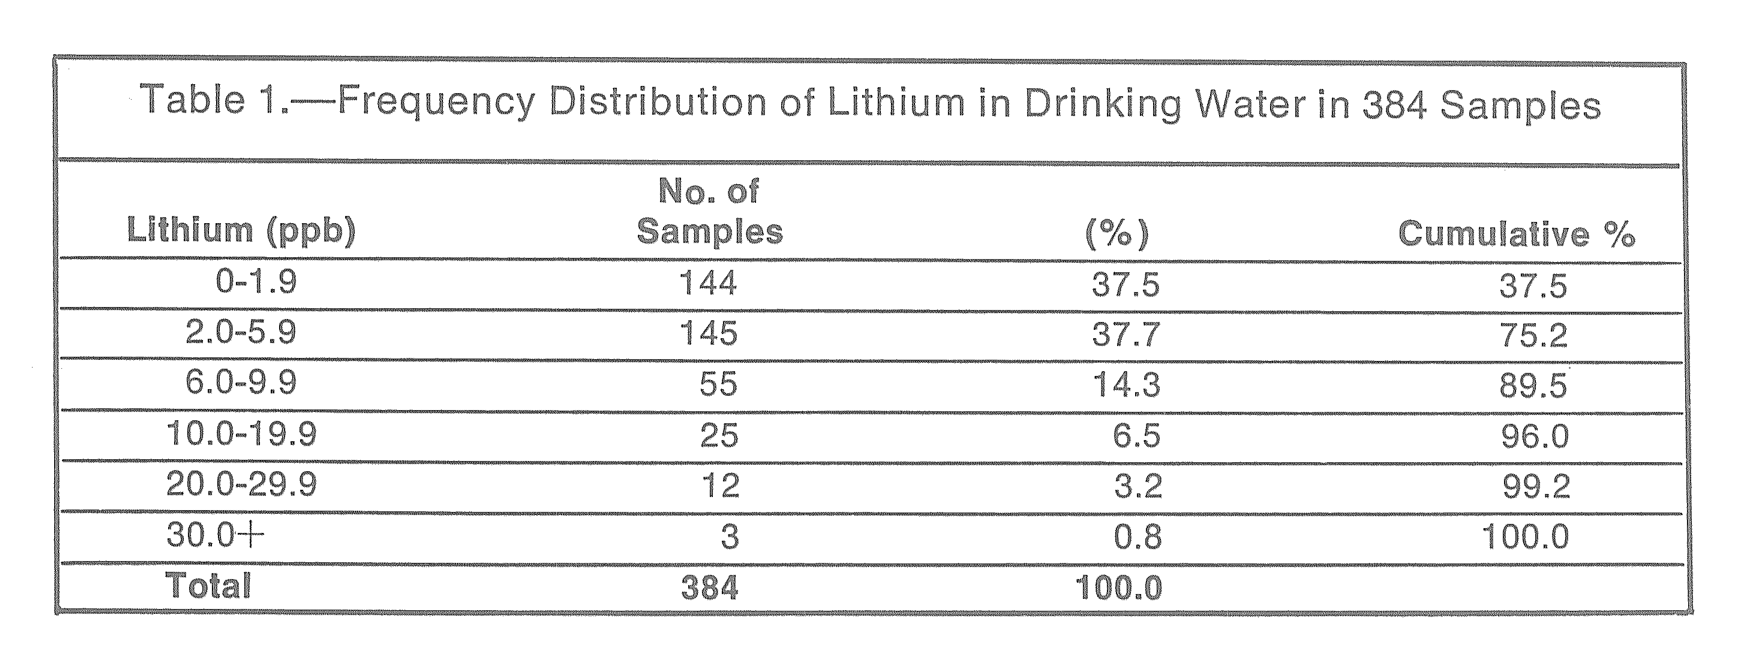
There are two comparisons we want to make. The first is to historical sources — are we being exposed to more lithium now than we were back in the day? Our best source for this is that 1964 paper, Public water supplies of the 100 largest cities in the United States by Durfor & Becker, which as you may remember is available on Google Books. They report a median level lithium concentration of only 2.0 ng/mL in the water supplies they analyzed. Based on this, the median level in US drinking water seems to have increased 3-4x since 1964. But this obscures the long tail of these data. Back in 1964, the maximum level they recorded was 170 ng/mL. In the modern data, the highest level is 1700 ng/mL, 10x higher.
We can also compare this to the Pima, who in the early 1970s were being exposed to about 100 ng/mL of lithium in their drinking water. This was very unusual back then but it is only somewhat unusual now — about 5% of the modern well water samples were in this range or higher, and about 1% contained more than 200 ng/mL.
The median level of contamination has increased somewhat, but the maximum level of exposure has increased by an order of magnitude. There’s definitely more lithium in the groundwater today than there was in the 1960s and 1970s.
(We also noticed that in this paper, they mention: “As the stream flows toward its mouth, many sources contribute dissolved and suspended matter to the stream. … It is not surprising that the raw water obtained by Minneapolis, Minn., from the upper reaches of the Mississippi River contains about one-half the amount of dissolved solids as the raw water used by New Orleans, La., near the mouth of the river.”)
The other comparison we want to make is to other countries. The United States is pretty obese, much more obese than most other parts of the world. So the next step is to track down some data and see if other parts of the world have more or less lithium in their groundwater and/or drinking water than we do.
We’ve found sources for a couple other countries, and we’re prepared to make some comparisons. These distributions are generally skewed, so the median is really the most appropriate metric here — but unfortunately some of these sources don’t report it and just report the mean instead. So to keep us comparing apples to apples as much as possible, remember — the US is about 36% obese, the median of lithium in the well water dataset is 6.9 ng/mL, and the mean is 19.7 ng/mL.
Greece is about 25% obese. In 2013, a team published this paper looking at lithium levels in 149 samples of drinking water from 34 prefectures of Greece. They found that the average level of lithium in the samples was 11.10 ng/mL, with a range from 0.1 to 121 ng/mL. (They also looked at 21 samples of different kinds of bottled waters and found mean lithium levels of 6.21 ng/mL) We can see that the average is lower than the average level in American well water, and that while there is quite a range of values, the range is also much more limited than the range in modern American water samples. We can also point out that the highest level for lithium in this sample (121 ng/mL) was on Samos Island, and in our first post on lithium, we found hints that people on Samos Island are about as obese as Americans.
Denmark is about 20% obese. In 2017, a team published this paper looking at lithium levels in 158 drinking water samples from 151 public waterworks supplying approximately 42% of the Danish population. Of these, 139 measurements came from “a drinking water sampling campaign, executed from April to June 2013, spatially covering the entire country”. They found an average level of lithium in their sample of 11.6 ng/mL (SD 6.8 ng/mL), with a range from 0.6 ng/mL in Western Denmark to 30.7 ng/mL in Eastern Denmark. This average is pretty high, though lower than the average in our American samples, but it’s also notable that the range and maximum levels are quite low. Even though the Greek and Danish averages are very similar, the Danish maximum value is about one-fourth the Greek maximum value. They also happily report the median value, 10.5 ng/mL.
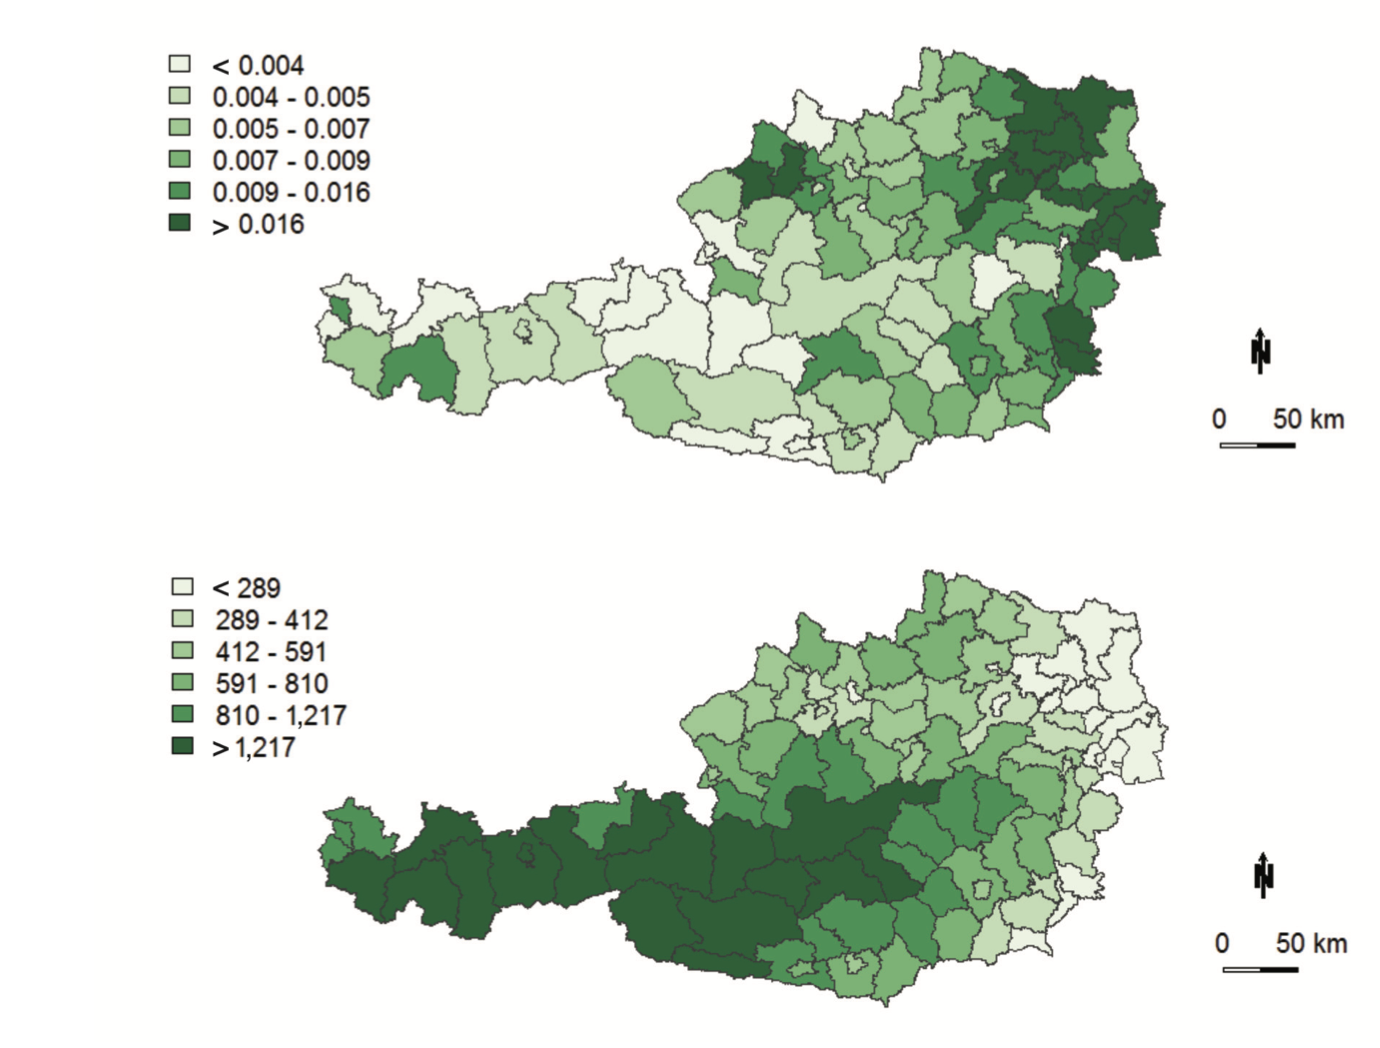
Austria is about 20% obese. In 2018, a team published this paper looking at 6460 lithium measurements in drinking water samples from all 99 Austrian districts. The average level of lithium was 11.3 ng/mL (SD 27 ng/mL), with a range from “not detected” to 1300 ng/mL.The authors mention that the measurements are extremely skewed — between this and that extreme maximum value, we expect the median is much lower than 11.3 ng/mL.
Italy is about 20% obese. In 2015, a team published this paper looking at lithium concentrations in drinking water at 145 sites in Italy. The average level of lithium in the samples was 5.28 ng/mL, with a range from 0.110 to 60.8 ng/mL. The mean and the maximum level are markedly lower than the levels found in American water.
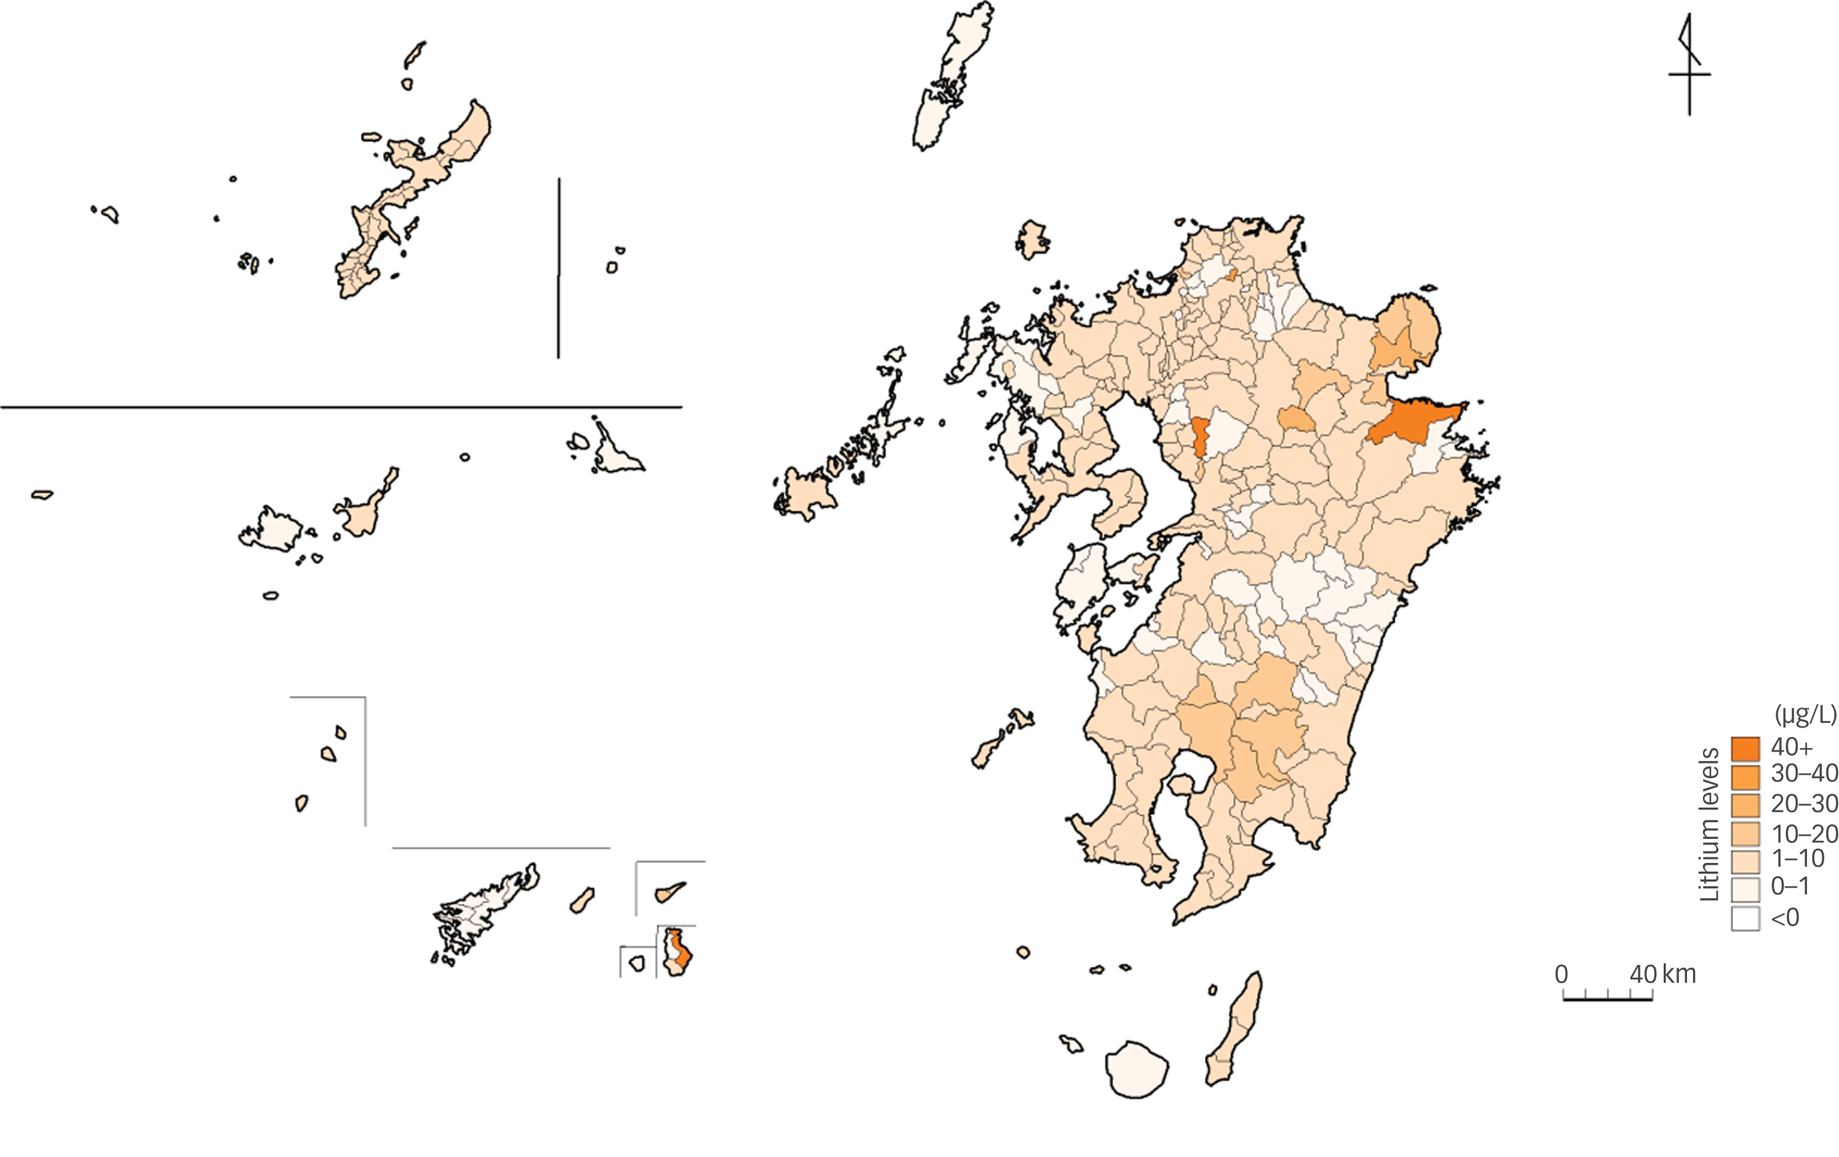
Japan is about 4% obese, making it the leanest industrialized nation in the world. In 2020, a team published this paper (h/t commenter Patrick Halstead) looking at lithium levels in 434 drinking water samples in the 274 municipalities of Kyushu Island, the third largest island of Japan’s five main islands, which is home to about 10% of the population. They found that the average level of lithium in the samples was 4.2 ng/mL (SD 9.3 ng/mL), with a range of 0 ng/mL to 130 ng/mL.
This average is lower than any of the other modern averages we’ve seen. If you look at the map below, you’ll see that only three municipalities had more than 40 ng/mL lithium in their water. Combined with the high maximum value of 130 ng/mL, this suggests an extreme skew, and suggests that the median value is lower than 4.2 ng/mL, maybe much lower. Unfortunately the authors haven’t publicly shared the raw data, so it’s hard to know what the median value really is.
There’s also this paper from 2020 (h/t commenter AJ), by some of the same authors, which looked at lithium levels in tap water samples across the 26 municipalities of Miyazaki Prefecture. Miyazaki Prefecture is part of Kyushu Island, so this is sort of zooming in on the result above. The average lithium levels in the tap water samples was 2.8 ng/mL, with a range from 0.2 ng/mL to 12.3 ng/mL. This time they also report the median, which is 1.7 ng/mL. Note that this median level is lower even than the median in the US in 1964.
There’s also this paper from 2009, again by some of the same authors, again looking at a prefecture on Kyushu Island. This time they looked at Oita Prefecture, which borders Miyazaki Prefecture to the south. The only difference is that the data are somewhat older, being collected in 2006. Unfortunately they don’t seem to report a mean or a median, but the range was from 0.7 ng/mL to 59 ng/mL, and the authors note that “the distribution of lithium levels was considerably skewed.” Reporting on this paper, the BBC said, “The researchers speculated that while these levels were low, there may be a cumulative protective effect on the brain from years of drinking this tap water.”
Taken together, these three papers strongly suggest that Japanese people have much lower levels of lithium in their drinking water than Americans, or indeed any industrialized population.
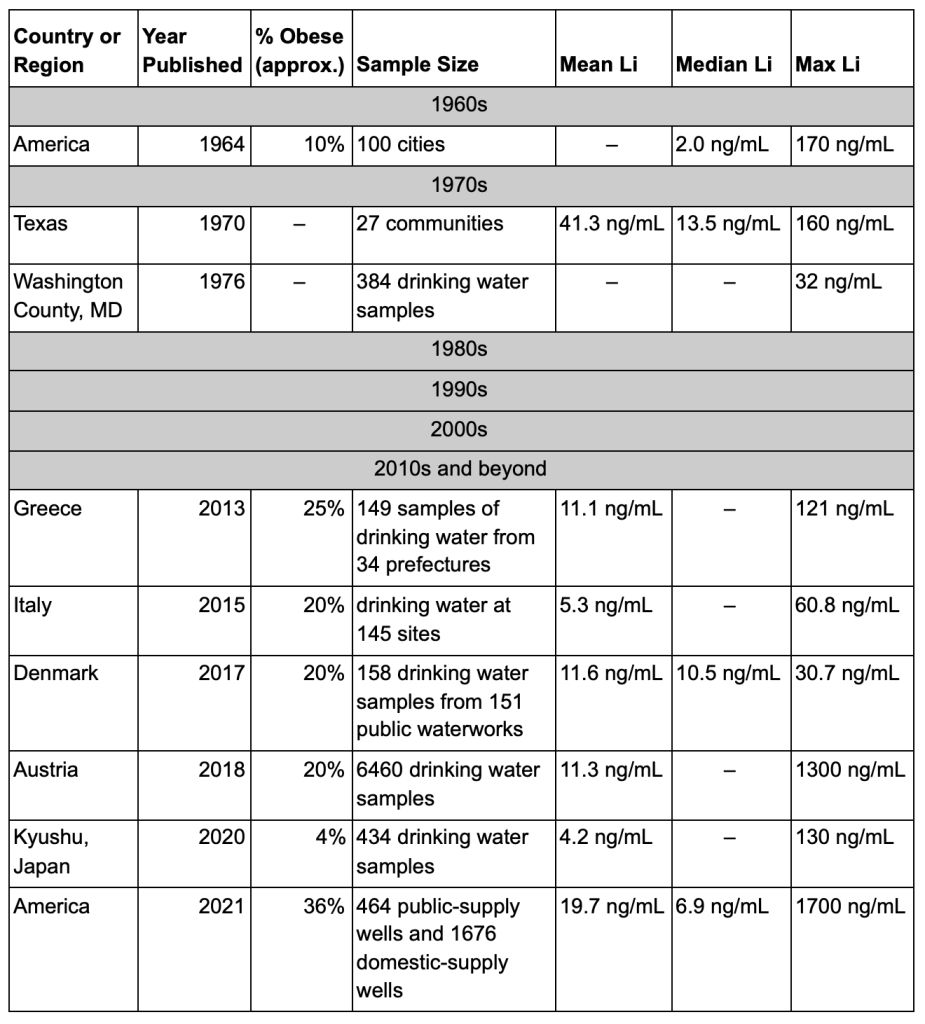
We’re comparing a lot of unlike things here. We’re comparing means to medians; comparing sources from different countries and across different years; comparing samples from “groundwater”, “well water”, and “drinking water” without knowing if these are meaningfully different. But even with these limitations, we see that drinking water in America clearly has higher levels of lithium than the drinking water in other countries. This is apparent in the average levels found in large samples, but even more impressive is the differences in extreme values. Most other countries see maximum values of not much more than 100 ng/mL, while the American maximum value recorded was 1700 ng/mL, and a full 1% of samples in our best dataset contained more than 200 ng/mL lithium.
There’s more lithium in American well water than there is in the drinking water of these countries. But there’s also more lithium in the drinking water of these countries than there was in America in the 1960s. Greece, Denmark, Austria, and Italy all have more lithium in their water today than America did in 1964. The median in the dataset for America in 1964 was 2.0 ng/mL — we only have averages for most of these countries, but they all are much higher than 2.0 ng/mL. Denmark, where they do report the median, has a median value of 10.5 ng/mL. The only exception is Japan, where the median (if we could calculate it) might be around 2.0 ng/mL. But modern-day Japan is leaner than America was in 1964 — they’re about as lean as America was in 1890!
Lithium and Depth
We can also look at the data from this new USGS report to see if there’s anything to our suspicion that drilling deeper and deeper wells is leading to more background lithium exposure.
The most basic thing to look for is just to see if deeper wells have higher concentrations of lithium, and the answer is a clear “yes”. The paper itself comments, “Lithium concentrations … are positively correlated with well depth”, and naturally we see the same thing in the raw data.
The relationship varies slightly depending on how you do the analysis, but however you slice it, well depth and lithium levels are correlated at about r = 0.2. Because the sample size is several thousand, these are always statistically significant. The relationship also remains significant, and about the same strength, when we control for other variables we expect to be relevant.
In the case of the arsenic contamination in Bangladesh, arsenic was concentrated at a depth of around 50 meters. Wells at around this depth tended to be heavily contaminated, but wells that were either shallower or deeper were generally fine. We thought there might be a similar “sweet spot” for lithium, but so far we haven’t found much evidence for this. Overall there is a weak but pretty constant relationship, where the deeper the well is, the more lithium it contains. There are some indications of a sweet spot for certain types of aquifers, but we’d need to do a more detailed analysis.
There’s even some evidence that wells have been getting deeper over the years. This dataset doesn’t contain information about when wells were drilled, but when they were tested is a proxy for when they were drilled — a well tested in 2003 couldn’t have been drilled in 2008. When we look at the data, we see that the depth of the wells being tested shows a consistent increase over time. In the 1990s they tested 39 wells, and the deepest was only 260 feet deep. In the 2000s, they tested 1,288 wells, and 313 were deeper than 260 feet. Only two of the wells tested in the 2000s were more than 2,000 feet deep. In the 2010s and on, 33 of the wells they tested were more than 2,000 feet deep.
This is supported by the publicly-available well data we pulled from Vermont and Massachusetts earlier, where we see moderate correlations (about r = 0.3) between the year a well was completed and the overall depth. This is omitting the wells in the MA dataset that were listed as being 4,132,004 and 10,112,002 feet deep — we think these may be typos.
What about the maps?
If there’s one thing we’ve learned from this project, it’s that people love maps. This paper contains a few, and they’re pretty interesting. This one is the most relevant:
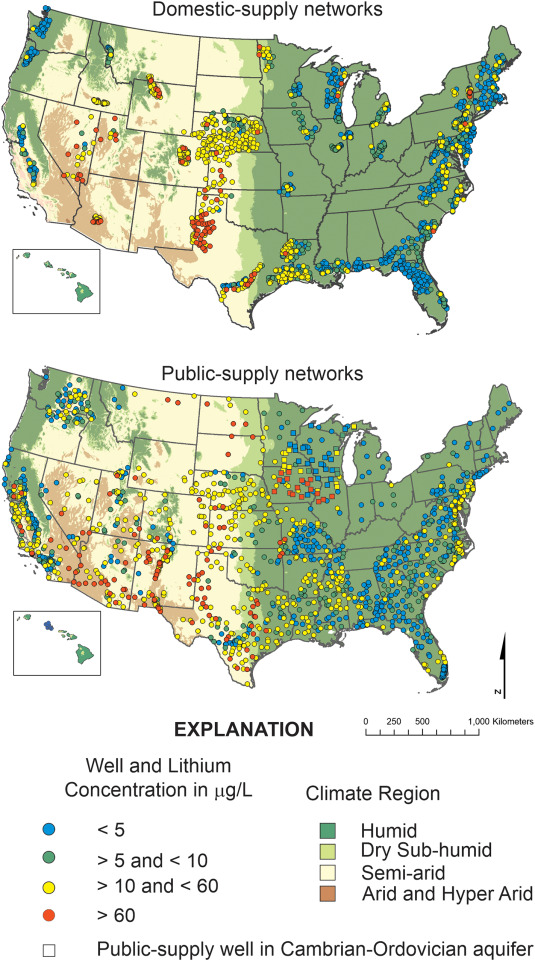
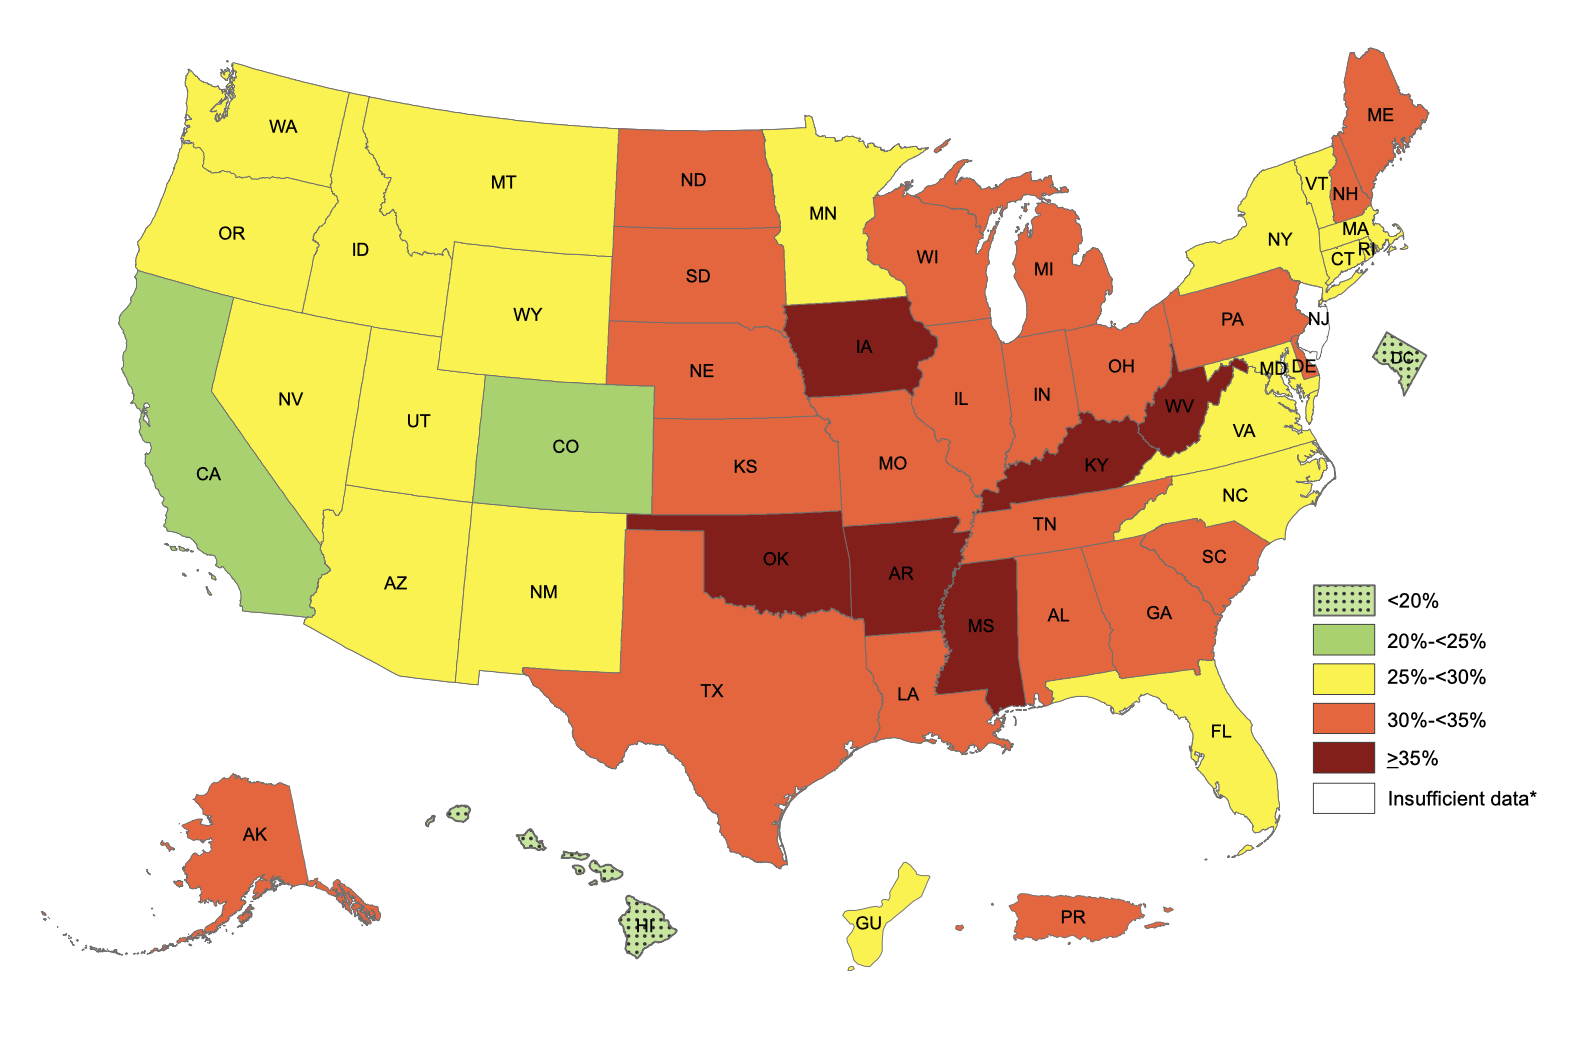
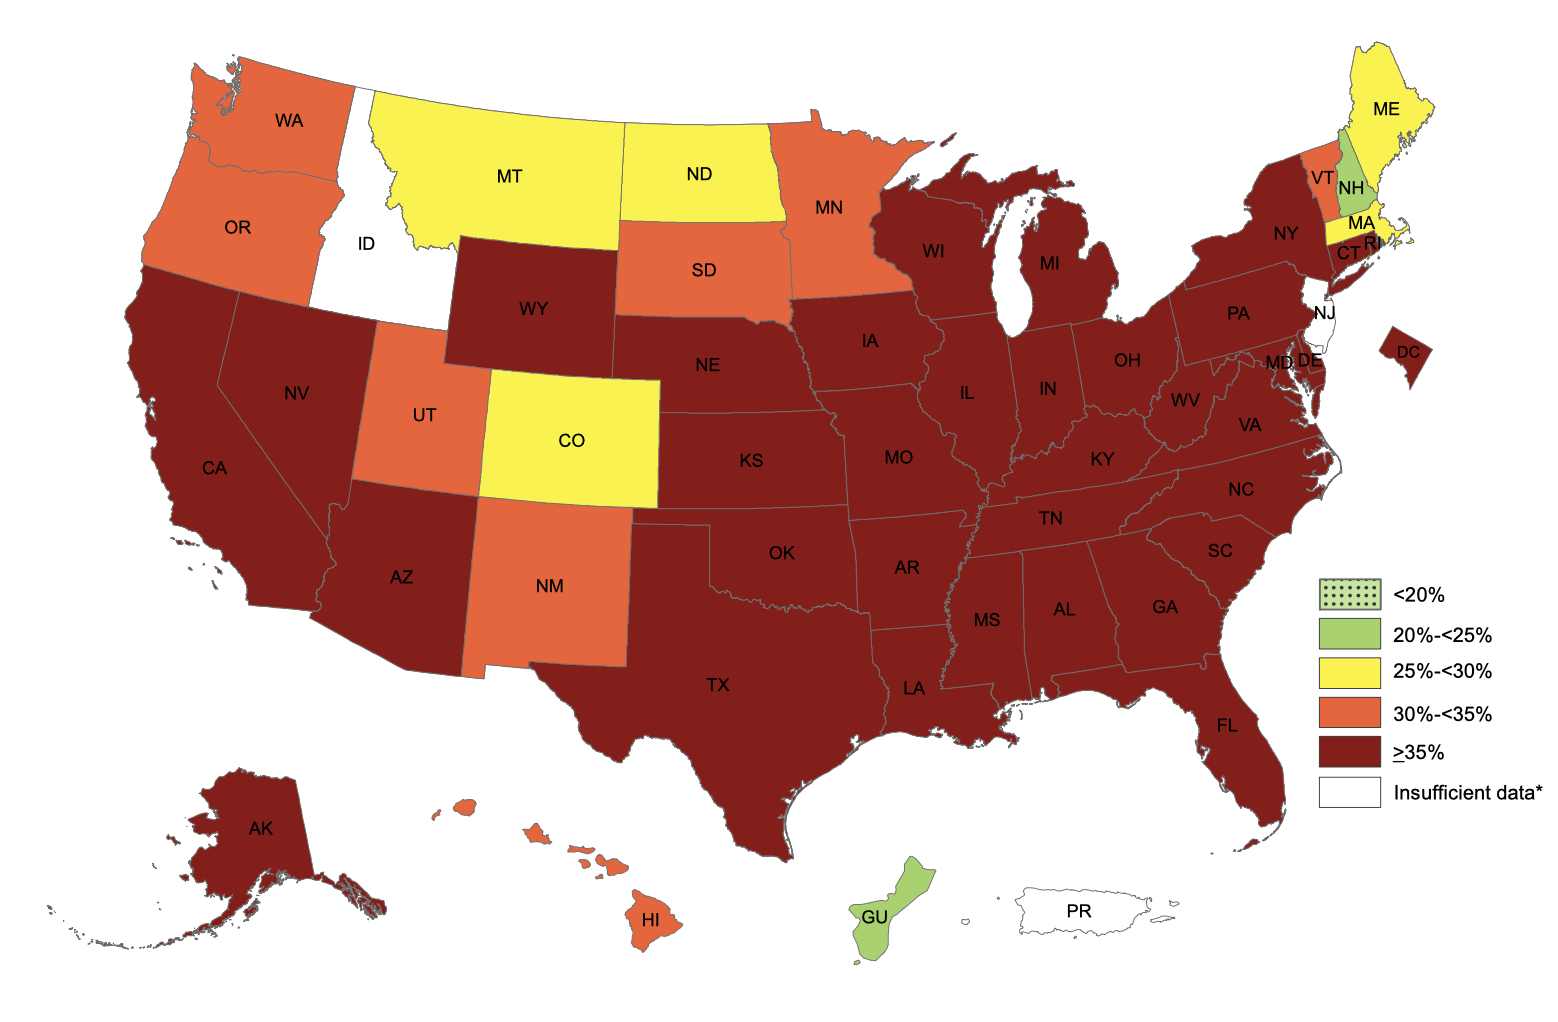
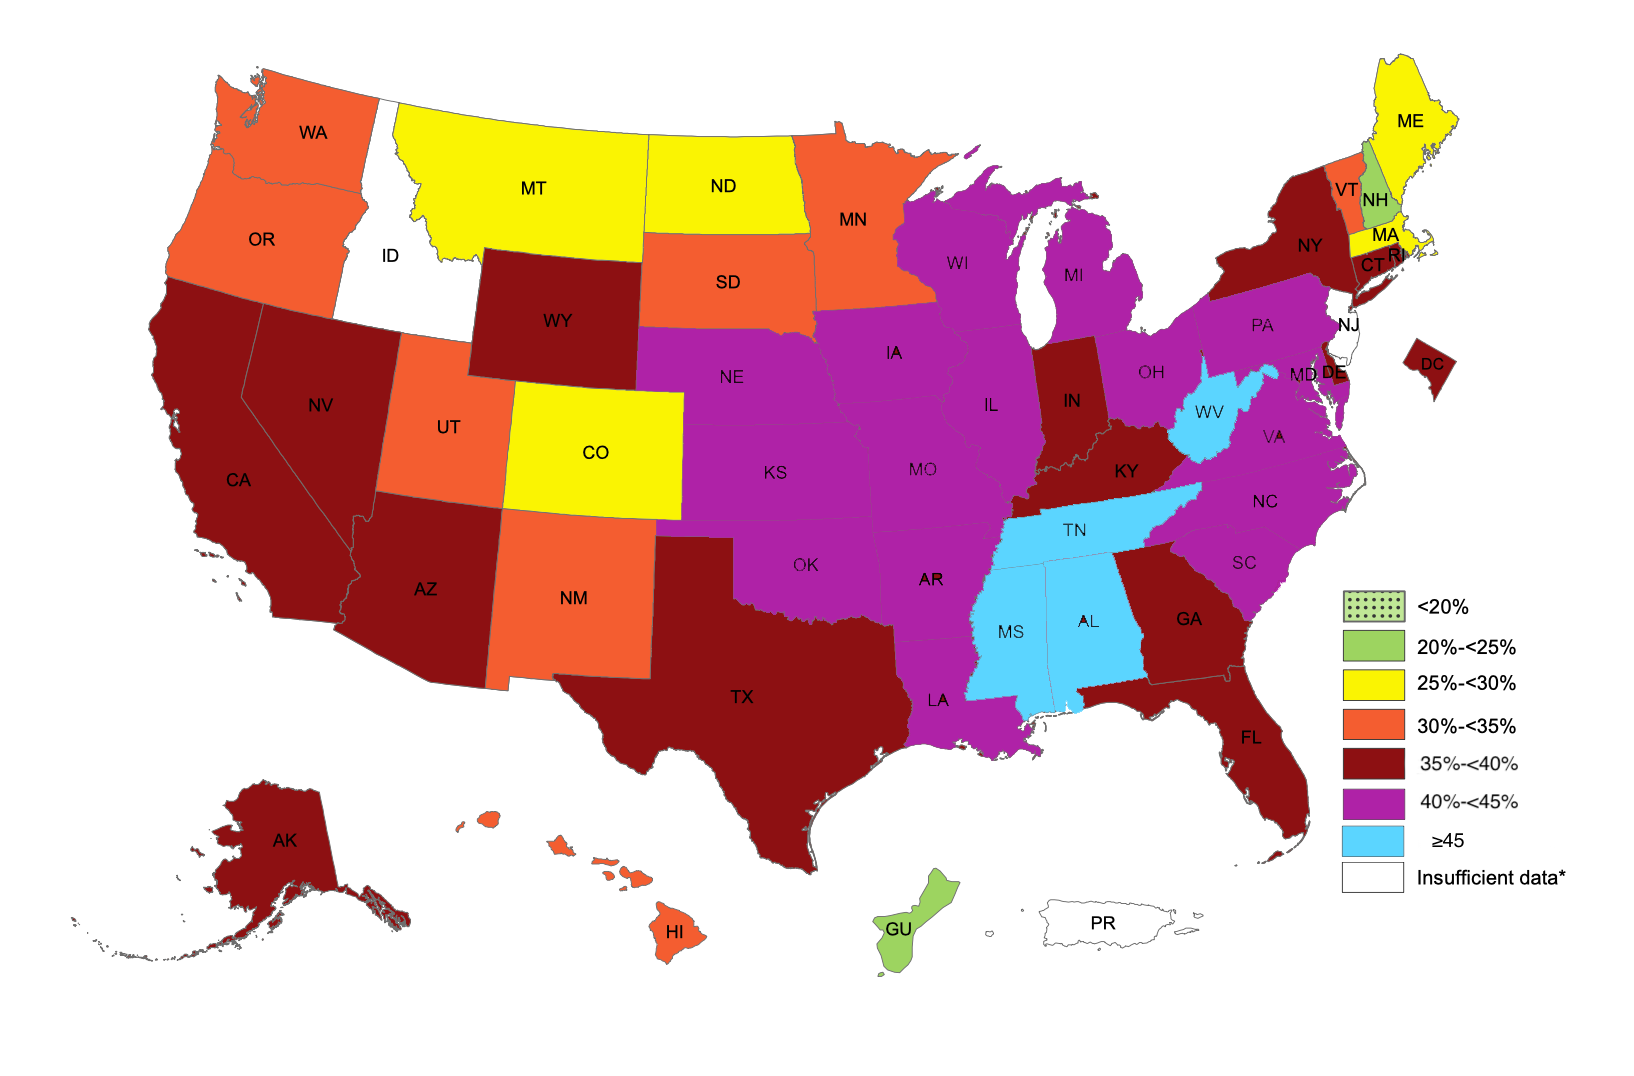
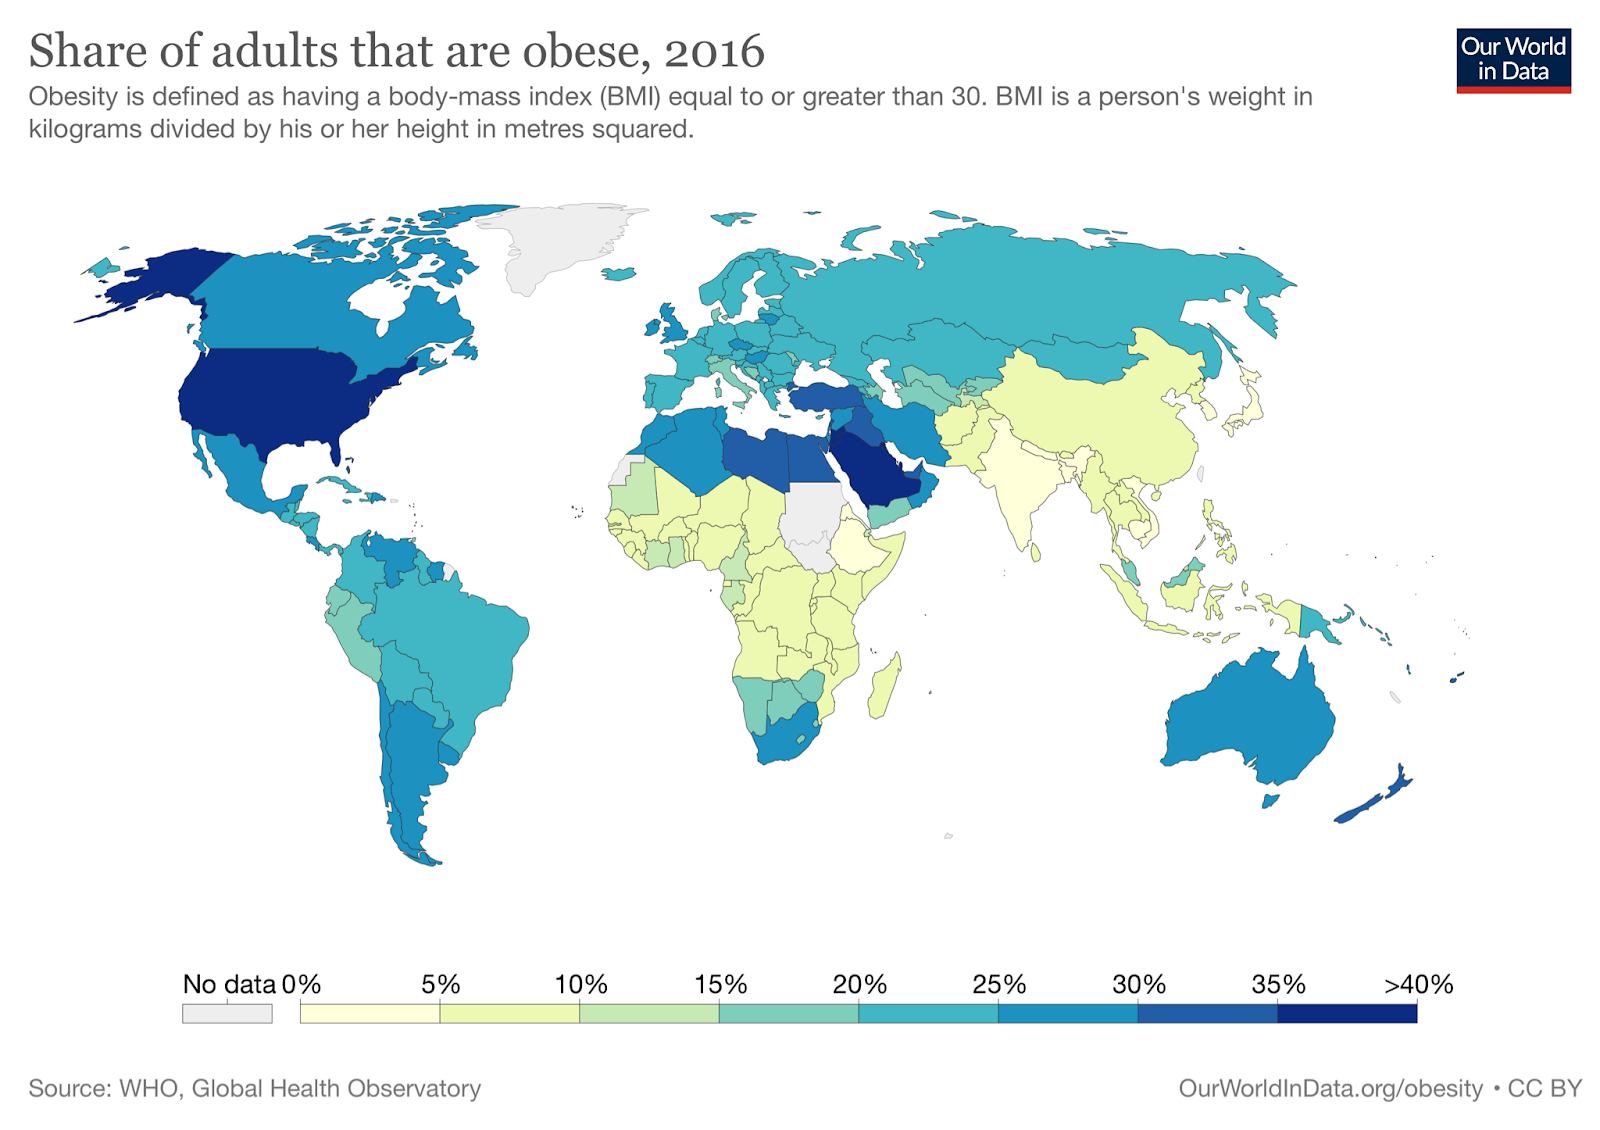
One thing that you’ll notice is that the distribution of lithium in well water doesn’t match up all that well with the distribution of obesity. Colorado is the leanest state but has pretty high levels of lithium in its well water. Alabama is quite obese but levels of lithium in the well water there are relatively low. What gives?
We think there are a couple of reasons not to be concerned about this. The first is that the sample is nowhere near representative. If you look at the map, you’ll see that the domestic-supply networks are thick around the coasts but thin in the interior of the country — except in Nebraska, where they are massively overrepresented for some reason. Only six wells were recorded in West Virginia and only three in Kentucky, which is too bad because those states seem pretty important. No effort seems to have been made to target population centers — this is a study by the USGS, so they are more interested in figuring out the features of major aquifers than of major cities. If a major city happens to be drawing from an especially contaminated source, they might have missed it.
The second is that there are big seasonal and weather effects, which they don’t adjust for. There’s almost no lithium in rain and snow — it’s essentially distilled water — so when it rains, lithium levels in groundwater drop as it becomes diluted with this influx of pure water. Similarly, there are seasonal effects — in part due to precipitation and snowmelt cycles — where lithium in the groundwater rises and falls over the course of the year.
But the third and most important thing is that all of these measurements are of well water, but many areas get their drinking water from surface sources rather than from wells.
Let’s start with Colorado, since it’s the clearest example. As you can see from the map above, the average level of lithium in Colorado well water is higher than the national average. We have the raw data, so again we can tell you that the median level in Colorado wells is 17.8 ng/mL, the mean is 28.0 ng/mL, and the max is a rather high 217.0 ng/mL.
But this doesn’t matter, because almost none of the drinking water in Colorado comes from wells. Instead, most of the drinking water in Colorado comes from surface water, and most of that water comes directly from pure snowmelt.
Denver is the largest city in Colorado and also the capital. A company called Denver Water, which is Colorado’s oldest and largest water utility, serves the city of Denver and surrounding areas. They have this to say about where they get their water:
Denver Water … relies on a system that collects rain and snow from across 4,000 square miles of mountains and foothills west of Denver. … On an average year, the utility captures 290,000 acre-feet of rain and snowmelt in its collection system. That’s roughly 94 billion gallons of water — or enough to fill up nearly 157 Empower Fields at Mile High. The water flows down rivers and streams, then through a network of tunnels, pipelines and canals to treatment facilities in the Front Range to be cleaned for delivery to homes and businesses. Because most of the water comes from mountain snowmelt in the spring, water is stored in mountain reservoirs until it is needed.
On another page, they say:
Denver Water is responsible for the collection, storage, quality control and distribution of drinking water to 1.5 million people, which is nearly one-fourth of all Coloradans. Almost all of its water comes from mountain snowmelt, and Denver is the first major user in line to use that water. Denver Water’s primary water sources are the South Platte River, Blue River, Williams Fork River and Fraser River watersheds, but it also uses water from the South Boulder Creek, Ralston Creek and Bear Creek watersheds.
Colorado Springs is the second-largest city in Colorado. Despite the name, they also get most of their drinking water from snowmelt. Per coloradosprings.gov:
Colorado Springs is a community that lacks a natural water source. 80% of our community’s water comes via pipelines from the western slope, 200 miles away.
And per waterworld.com:
Most of Colorado Springs’ current water comes from snowmelt, either on Pikes Peak or on the Western Slope. If snowfall is inadequate and precipitation falls as rain, the water is not easily captured in the high mountains where the Homestake pipeline begins. However, the Southern Delivery System (SDS) project would capture water as the flow emerged from the mountains as the Arkansas River and into Pueblo Reservoir.
Also enjoy this video from Colorado Springs Utilities called What it Takes to Drink Snowmelt.
Aurora is the third-largest city in Colorado (and right next to Denver). We bet you can guess where we’re going with this! From auroragov.org:
One of the benefits of living in a state that relies primarily on this surface water is that unlike groundwater, surface water is a renewable water source.
Aurora receives 95 percent of our water from surface water sources, with the remaining five percent coming from deep aquifer groundwater wells. Replenished each year through snowmelt, Aurora’s water supply is transported from 180 miles away through a complex and extensive system.
As we mentioned above, precipitation has extremely low levels of lithium because it’s basically been distilled. In one study of rainwater in Montréal, they found a mean level of only 0.48 ng/mL. This means that if you are drinking rainwater or snowmelt, you are getting less lithium in your drinking water than any other group we’ve seen — less than in Italy, less than the Japanese, and less than Americans back in 1964.
People in Colorado more or less are drinking nothing but snowmelt. It runs through rivers and reservoirs first, so it probably picks up some trace minerals and other contaminants from the slopes and riverbeds. But it doesn’t matter if the well water in Colorado is high in lithium — people aren’t drinking that, they’re drinking snowmelt.
Lithium aside, this is pretty interesting just from the perspective of Colorado being the leanest state. Snowmelt will be extremely low in pretty much every contaminant, so this seems to be additional evidence that obesity is caused by a contaminant that is carried in drinking water. We think you can still get exposure from other sources as well, probably your food — which is why Colorado is 20% obese, rather than 2% obese like premodern populations — but this seems like some evidence that drinking water alone makes some difference.
Other states also use surface water, but we’re pretty sure no one else is getting 95-100% of their drinking water directly from snowmelt. Utah is just on the other side of the ridge, but their Department of Environmental Quality says:
Utah’s drinking water comes from either surface water (lakes, reservoirs, rivers) or ground water (wells or springs), altogether 1,850 sources. Utah’s larger cities generally use surface water and wells while its small towns depend on springs that serve the system all year long, supplemented by wells during the summer months.
Nearby Nebraska seems to get most of their drinking water from wells. According to one source, about 80 percent of the population consumes drinking water that is pumped from groundwater sources; according to another source, 85% of the population does. So unlike Colorado, Nebraska should be concerned about the levels of lithium in their groundwater — a median level of 17.6 ng/mL and a mean of 21.7 ng/mL — because they’re actually drinking it. And the rest of us should be concerned as well, because Nebraska is #3 in the nation for agricultural production.
[Next Time: THE FATTEST CITIES]












 SLIME MOLD TIME MOLD