Extreme corn allergies aren’t common, but over the course of our lives we’ve happened to meet two people who have them. “Extreme” means they couldn’t eat corn, couldn’t eat corn products, and couldn’t eat any product containing corn derivatives. One of them was so allergic, she couldn’t even eat apples unless she picked them from the tree herself — apples in the store have been sprayed with wax, and some of those waxes contain corn byproducts.
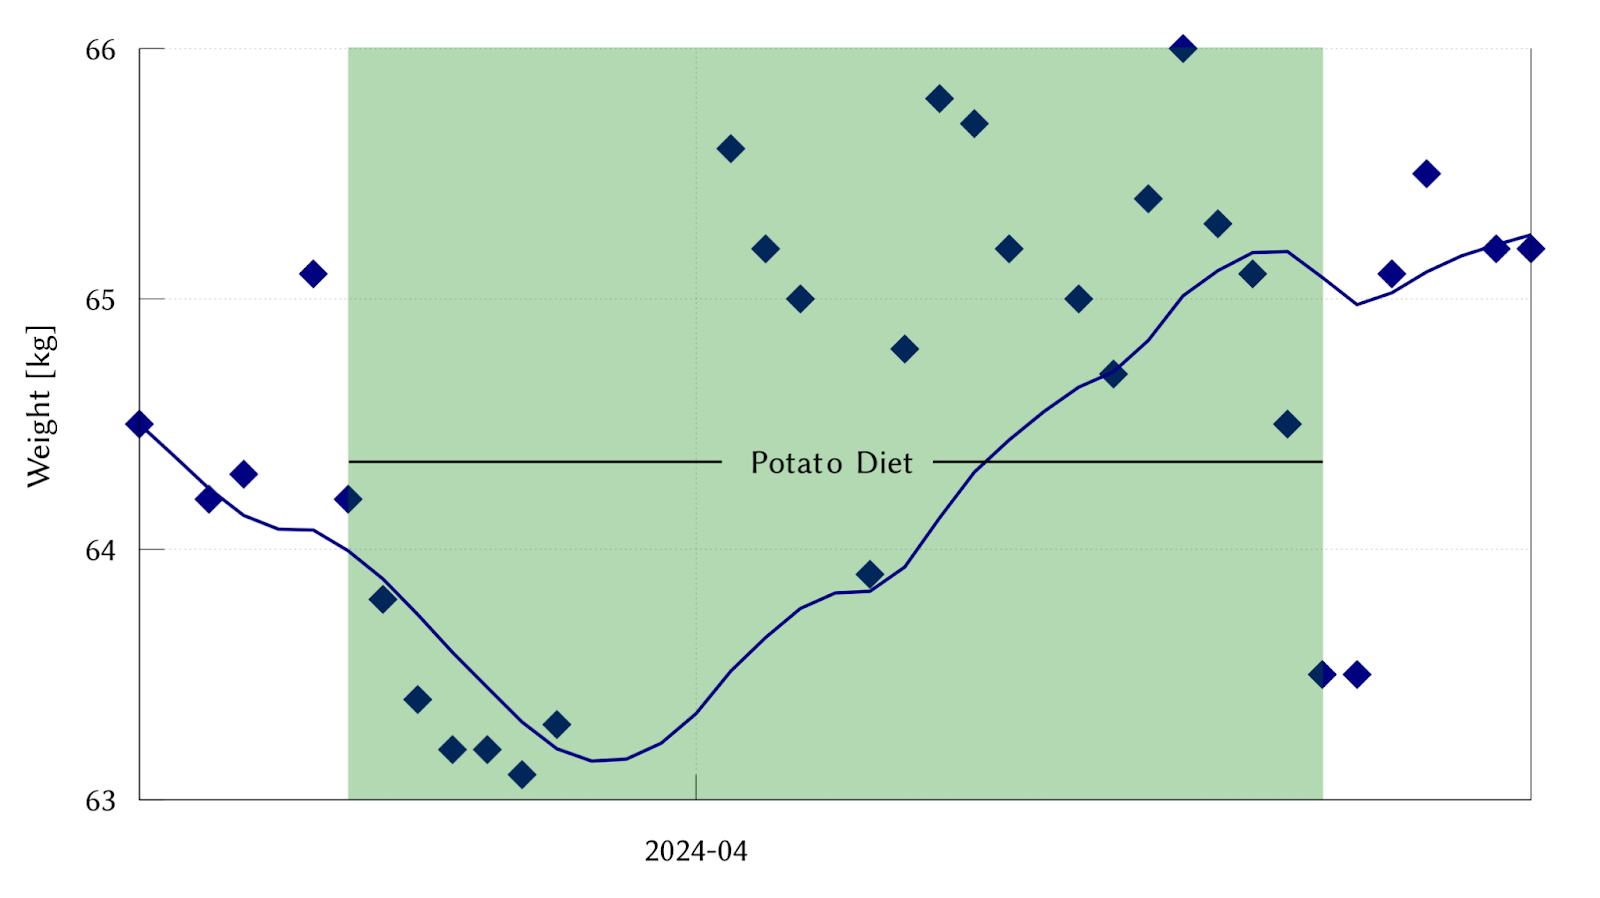
Both of these people were also extremely lean, we mean like rail thin. It’s easy to imagine alternative explanations for this — if you have to carefully avoid any food that has ever been within shouting distance of corn, it might be harder to get enough to eat. But there’s no rule saying you can’t grow fat on pork and rice, and it occurs to us that if corn were somehow in the causal chain that’s causing the obesity epidemic, this is exactly what you would see.
If corn were a direct cause of the obesity epidemic — maybe if it concentrates an obesogenic contaminant like lithium, maybe if obesity is caused by a pesticide massively applied to corn — then people with serious corn allergies should be almost universally thin, or should at least have an obesity rate much lower than the general population. Our sample size of two is far too small to draw this conclusion right now, but every sample of 100 or 10,000 passes through a sample size of 2 at some point.
Easy enough to test. So, if you or someone you know has a serious corn allergy, are you really lean? We would love to know! Do you have access to the talk.kernelpanic.zero mailing list? Is there a secret r/cornwatchers subreddit? Can we send them a survey?
Corn aside, we can generalize this argument. The obesity rate in the US is about 40%. If people with an allergy to soy, fish, sesame, etc. are less than 40% obese, that implicates the food they’re allergic to. And if their obesity rate is < 5%, that’s a smoking gun.
You could also say, maybe people with food allergies have a lower overall rate of obesity, on account of their food allergies. This is probably true. Let’s say that the general rate of obesity in people with serious food allergies is 25%, instead of the 40% of the general population. But if people with serious avocado, kiwi, and banana allergies are 27%, 23%, and 24% obese, and people with serious tomato allergies are 2% obese, that’s kind of a signal.
There are some complications, like the fact that people with one food allergy are more likely to have another food allergy. But let’s not worry about that until we have the data.
One of our most counterintuitive beliefs is that the obesity epidemic may not have much to do with what we eat. But if it does, there should be some signal in the allergy cohorts.
Scott Alexander recently named five criticisms of A Chemical Hunger,our series on the obesity epidemic, and asked for our responses. These criticisms come by way of a LessWrong commenter named Natália (see post, post).
We appreciate Scott taking the time to identify these as his top five points, because this gives us a concrete list to respond to. In short, we think these criticisms are generally confused and misunderstand our arguments.
Here they are:
1. Do you agree with the obesity increase being gradual over the course of the 20th century, rather than “an abrupt shift” as you describe in ACH?
If we’re talking about obesity rates, those increased abruptly around 1970. The increase was about 10 percentage points in the 60 years before the early 1960s and about 30 percentage points in the 60 years after the early 1960s. We’re all literally quoting the same numbers from the same sources (NHANES), there shouldn’t be any disagreement about whether or not there was an abrupt shift in obesity rates, unless we’re just arguing semantics over what counts as “abrupt”. Of interest in this point is that Natália agrees. She made a changelog to the relevant post where she wrote, “discussion in the comments made me realize that the argument I was trying to make was too semantic in nature and exaggerated the differences in our perspectives.”
Some people think that other measures, like average BMI, might have been increasing more linearly, that the abrupt shift in obesity rates are an artifact of the normal distribution in what is actually a gradual increase, that these other measures are therefore a better indicator, and that this suggests there was no special change in the obesity epidemic around 1970. This would be an interesting wrinkle, but we’ve looked at various models and we don’t think they support this interpretation (see the appendix for details). There’s even some data on average BMI over time, which also seems to show a shift. We still think there’s evidence of a change in the rate of change.
That said, we think this is the wrong question to ask. We highlighted the abrupt shift in obesity rates because we think it’s interesting, and maybe surprising, but it doesn’t do a lot to help us distinguish between different hypotheses, so it’s not very important. Contamination can happen either gradually or abruptly, so unless we’re asking about a specific contaminant that was abruptly introduced in 1970, whether or not the shift was abrupt has little bearing on whether the contamination hypothesis is correct. If anything, a gradual increase starting around 1950 is more compatible with the lithium hypothesis, because there’s some reason to think that lithium exposure increased gradually:
Graph showing world lithium production from 1900 to 2007, by deposit type and year. The layers of the graph are placed one above the other, forming a cumulative total. Reproduced from USGS.
2. Do you agree that even medical lithium patients don’t have enough weight gain to cause the obesity epidemic? If so, why do you think that getting a tiny fraction of that much lithium would?
This is a great question. Let’s say that on average, people have gained 12 kilos since 1970, but that patients only gain an average of 6 kilos when they start taking medical lithium. This would be some evidence that lithium exposure isn’t responsible for the entire change in obesity since 1970. But it would be quite consistent with the idea that lithium caused some of the change in obesity since 1970, potentially as much as 50%.
We’re comfortable with the idea that lithium may be responsible for only part of the obesity epidemic. Natália even mentions this, she says, “[SMTM] also think that other contaminants could be responsible, either alone or in combination” in footnote 1 of this post. Even if we assume the weight gained by medical lithium patients is an upper limit on the possible effect, it still seems consistent with lithium exposure being responsible for some reasonable percentage of the overall increase. If lithium caused “only” 50% of the weight gain since 1970, or even just 10%, that would still be a pretty big deal and we would still care about that.
That said, we do think there’s some reason to suspect that lithium might be responsible for more than 50%. If everyone is already exposed to lithium in their diet, then the amount of weight gained by medical lithium patients when they add a higher dose will underestimate the total effect. Extremely long-term trace exposure (and bolus doses, compounds other than lithium carbonate, etc.) might have different pharmacokinetics than medical lithium. And there’s at least one population (the Pima of the Gila River Valley) where long-term exposure to lithium in food and water was associated with striking rates of obesity and diabetes, suggesting that under some conditions, lithium levels found in food and water may be enough to cause serious weight gain.
3. Natalia lists several reasons to expect that trace lithium doses should have only trace effects – Gwern’s reanalysis showing few-to-no psych effects, some studies suggesting low doses have fewer side effects, and lack of any of the non-weight-gain side effects of lithium in trace users. What are your thoughts on this?
We think there are several reasons to expect effects from trace and subclinical doses, especially with extremely long-term exposure.
We’re only aware of one RCT of trace-level doses (Schrauzer & de Vroey, 1994), but this study found that taking 0.4 mg per day of lithium orally led to participants feeling happier, more friendly, more kind, less grouchy, etc., “without exception”, compared to placebo.
When we surveyed redditors who took subclinical doses of lithium as a nootropic (ballpark 1-10 mg/day), people commonly reported some non-weight-gain effects, like increased calm, brain fog, frequent urination, and decreased libido. And they rarely or never reported other effects, like eye pain, fainting, or severe trembling. This suggests that low doses of lithium are enough to cause some common effects of lithium, while not causing others.
Following chronic lifelong exposure to trace doses of lithium in their drinking water, and accumulation in some of their food, the Pima of the Gila River Valley ended up with high rates of obesity and diabetes. The Pima became obese and lethargic, but didn’t (as far as we know) suffer from hand tremors or nausea. Their example also supports the idea that lithium has some effects that kick in at psychiatric dose levels and others at groundwater levels, and that metabolic effects might be among the effects that can be caused by food and groundwater exposure alone.
These examples seem to address the concern of “some studies suggesting low doses have fewer side effects, and lack of any of the non-weight-gain side effects of lithium in trace users”. Lower doses do have fewer effects, and some effects do seem to go away as you lower the dose. But other effects seem to be fairly common, even at low doses, and others may manifest with long-term exposure. This question is especially hard to answer in just a few paragraphs, so take a look at the appendix for much more detail.
4. Do you agree that wild animals are not really becoming obese?
Following this source, in Part I of A Chemical Hunger we also use the terms “wild” and “feral” to refer to these rats. We say, “Humans aren’t the only ones who are growing more obese — lab animals and even wild animals are becoming more obese as well. Primates and rodents living in research colonies, feral rodents living in our cities, and domestic pets like dogs and cats are all steadily getting fatter and fatter.” Our use of the term followed our source, and while it’s natural that people misunderstood the term to mean something more broad, let’s clarify that we didn’t intend to imply we were making claims about mountain goats, sloths, or white-tailed deer.
But the broader question is definitely interesting, so let’s consider it now: have “truly wild” animals, living totally separately from humans, been getting obese as well? We think this is a point where reasonable people can disagree, because there isn’t much data about the weight of truly wild animals over time. There’s very little to go on. We can point to an example paper, Wolverton, Nagaoka, Densmore, & Fullerton (2008), where we find data that are consistent with the idea that some truly wild animals are getting heavier, so we think it’s possible. But we don’t claim it’s well-supported. The wildest animals we have good data on are probably those feral rats from above.
But we don’t make much of this either way, because it doesn’t seem like a crux. If pets, zoo animals, lab animals, feral animals, and/or truly wild animals are getting obese, that’s some evidence in favor of the contamination hypothesis. But the contamination hypothesis can still be true if some of those populations are not becoming obese.
5. Do you agree that water has higher lithium levels at high altitudes (the opposite of what would be needed for lithium to explain the altitude-obesity correlation)?
No. This claim is based on an analysis that contains several mistakes.
Natália conducted an analysis of this dataset from the USGS and elevation data from Open Elevation API, and found a positive correlation of 0.46 between altitude and log(lithium concentration) in U.S. domestic-supply wells. We replicated this analysis and can confirm that’s the correlation coefficient you get. But this analysis is mistaken, for two main reasons.
First of all, the statistical problem. Correlation tests estimate the population correlation by looking at the correlation in a random sample drawn from that population. But this sample isn’t random, and it’s not representative either. The data mostly come from Nebraska, certain parts of Texas, and the East Coast. Some states are not represented at all. Really, look at the map below; it’s so much Nebraska. Even if there is a correlation within this dataset, there’s no reason to expect it’s a meaningful estimate of the correlation in the U.S. as a whole.
But even if this were a random sample, this analysis would still be mistaken, because it’s a sample from the wrong population. Natália’s analysis only covers domestic-supply wells. It excludes public-supply wells, and it entirely omits surface water sources.
This is a problem, because many people get their drinking water from public-supply wells, or from surface water. And it’s a problem because if there were a correlation between lithium levels and altitude, we’d expect to see it in surface water, not well water. Water drawn from wells has often been down there for thousands of years, while surface water is directly exposed to runoff, landfills, brine spills, power plants, and factory explosion byproducts. So we’d expect surface water to drive any correlation of obesity with altitude.
This is a pretty strange set of errors for Natália to make, given that we discussed this dataset in A Chemical Hunger and specifically warned about both of these issues.
We also want to call attention to a 6th point that Scott doesn’t mention. If we were to phrase it as one of his questions, it might go something like this:
6. You did a literature review of lithium concentrations in food and found that some foods contain more than 1 mg/kg of lithium, which implies that people might be getting subclinical doses from their daily diet. Natália disputes this and says that the best available data shows less than 0.5 mg/kg lithium in every single food. Do you agree?
The truth is that there’s a split in the literature. The studies Natália cites consistently find low levels of lithium in food and beverages, as do some other papers. But other sources find much higher levels. These sources seem to contradict each other, in a way that seems like they can’t all be right. And there are other major gaps in our knowledge; Natália correctly pointed out that there are few recent measurements of lithium in the American food supply.
We went back and took a closer look at the study methods. What we noticed is that the studies that found < 1 mg/kg lithium tended to use the same technique for chemical analysis — ICP-MS with microwave digestion with nitric acid (HNO3). The studies that found more than 1 mg/kg lithium in food used a variety of other techniques.
This confirmed our hypothesis. Different analytical methods gave very different results.
When the foods were digested in HNO3, both ICP-MS and ICP-OES analysis mostly reported that concentrations of lithium were below the limit of detection. When foods were dry ashed instead, both ICP-MS and ICP-OES consistently found levels of lithium above the limit of detection, as high as 15.8 mg/kg lithium in eggs (which we replicated in a second study on just eggs).
This neatly explains the discrepancies in the literature. The lower results come from methods that yield very low estimates, often detecting no lithium at all, and the higher results come from other methods that give higher estimates. We think that the higher results are more accurate for several reasons (see our full reasoning in the original post) but the fastest way to make this case is that they show greater discrimination (better at distinguishing between samples). But even the lower estimates still support the idea that American foods sometimes contain more than 1 mg/kg, as they detected up to 1.2 mg/kg lithium in goji berries.
For more detail on all these points, see the Appendix. But first:
Why didn’t we respond earlier?
We love scientific debate. That’s why we respond to questions on twitter and have a long history of responding to questions asked on Reddit, as we did here. Sometimes we debate people over email; sometimes we write long response posts and make them public.
We can’t respond to everything, and we sometimes decline to respond to arguments we don’t understand, or conversations that don’t seem like they will be productive. This is definitely a judgment call, but it’s one we’re comfortable making. As a model, consider also this tweet from Visakan Veerasamy:
Our first experiences with Natália were of her, and her husband Matthew Barnett, being aggressive towards us for no clear reason.
Other people agreed with our interpretation. Dominik Peters said, “They’re planning to do further research about whether the theory is right or wrong, iiuc. Not sure it helps epistemically if they have a $2k incentive to find a ‘yes’ rather than a ‘no’ answer.” We tried to be as clear as possible. But Matthew didn’t seem to understand.
We responded to their comments for a while and continued to find them difficult to deal with, so we decided to stop engaging. Their comments were civil, but they were repeatedly confrontational, and our attempts to continue the conversation or explain our reasoning felt like they went nowhere.
If we couldn’t have a productive disagreement, it seemed like the most polite thing to do would be to not respond. We figured that not responding was a respectful way to decline further discussion. But they kept issuing public challenges, sending us DMs, comments, emails, for weeks. If you’ve ever stopped responding to someone and they continue sending you messages on every possible platform, you know what we mean.
So when Natália published her LessWrong posts, you can imagine why we weren’t interested in responding.
When you do science on the internet, you can see right away there are two kinds of responses. Most people want to help you get to the truth, even if they don’t necessarily agree with you. We’ve corresponded with several people like that: JP Callaghan, ExFatLoss, Jeff Nobbs, etc.
But some people want something else: it’s hard to tell what that thing is, because they seem to respond to what they imagine you said, rather than what’s actually there. It feels like they must have some motive you don’t understand — maybe they want to dunk on you, censor you, or promote you towards whatever strange goal. This isn’t a very charitable read and people who do this almost certainly don’t think of themselves this way, but that’s what it feels like on the receiving end.
And whatever, that’s the price of doing business on the internet. But you start to recognize pretty quickly whether someone is trying to help you or not, and if they’re not trying to help you, there’s really no reason to engage with them.
That’s why there’s no obligation to answer all objections. If you don’t feel like the objection was made by someone trying to get closer to the truth, and/or if you don’t feel like you’re going to get closer to the truth by answering it, why bother?
We feel like this is part of a pattern, because Natália and Matthew have acted the same way towards other researchers. They made a similar collection of arguments against the work of our one-time collaborator, Alexey Guzey. His response was “skimmed the post, tbh it seems weak”.
It’s not really that they are too aggressive. ExFatLoss is really aggressive, and we still talk to him. It’s more that discussions with Natália and Matthew never seem to get anywhere. Here’s a third party describing how Natália repeatedly edits or deletes her comments, which makes it hard to hold a conversation:
Mod note: I count six deleted comments by you on this post. Of these, two had replies (and so were edited to just say “deleted”), one was deleted quickly after posting, and three were deleted after they’d been up for awhile. This is disruptive to the conversation. It’s particularly costly when the subject of the top-level post is about conversation dynamics themselves, which the deleted comments are instances (or counterexamples) of.
You do have the right to remove your post/comments from LessWrong. However, doing so frequently, or in the middle of active conversations, is impolite. If you predict that you’re likely to wind up deleting a comment, it would be better to not post it in the first place. LessWrong has a “retract” button which crosses out text (keeping it technically-readable but making it annoying to read so that people won’t); this is the polite and epistemically-virtuous way to handle comments that you no longer stand by.
We want to be collegial, but Natália hasn’t treated us like a colleague. She often jumps straight to accusations, or just states single facts, or cites single articles as if they are a complete argument. She uses phrases like “extremely cherry-picked evidence” and accuses us of “subtle sleight of hand”. She says that our arguments are “misleading”, suggesting that any points of disagreement are both intentional and intended to mislead, without stopping to consider whether we might have simply made a mistake, or whether she might be misunderstanding our point.
Some people do use cherry-picked evidence, and we respect the desire to calls ‘em as one sees ‘em. But labeling something is a missed opportunity to describe the situation and let readers decide for themselves. And the principle of charity is also important — it’s not productive to nitpick, you should consider the best, strongest possible interpretation of an argument. Before you jump directly to accusations of cherrypicking, you should consider whether or not there are alternative explanations. Maybe you misunderstood the original argument, or made some other kind of mistake.
Maybe this is apocryphal, but we’ve heard that in medieval debate, you weren’t allowed to start criticising your opponent’s argument until you could re-state it to the point where they agreed, “yes, that’s my position.”
This is where Natália’s critiques really fail. We don’t recognize anything of our arguments in what she writes. It’s hard to respond when someone attacks a version of your argument that you didn’t make. We’re not really interested in responding to her in the future, but if she does want to offer a response, we’d like to see her at least start by re-stating what she thinks we believe. That way if she’s mistaken, it might be easier to clarify.
We believe in the principle of “focus your time and energy on what you want to see more of”. We don’t want more pointless internet arguments, more back and forths. We felt that our time was better spent elsewhere.
And this kind of disagreement does a disservice to the real issue, which is the science! We just don’t think the norms of who issued what kind of corrections when is all that interesting. We don’t want to spend our time fighting over procedure. We’d rather keep our eye on the ball, do more analysis, collect more data, and try to figure out the causes of obesity. That’s a conversation worth having.
Why Respond Now?
We didn’t respond to these arguments before, so why would we respond to them now? There are two main reasons.
First, Scott identified five points that he found interesting. When there were 101 points with no particular structure, it was hard to feel like it was possible to write a worthwhile response. No one wants to read a 101-item laundry list, and we sure as hell don’t want to write it.
But once Scott was kind enough to name his five points, we could focus on a small list of questions that a person of good judgment found concerning. That’s a discussion worth having, and tractable too.
Second, we have new data that can help resolve these disagreements. When you have the means to empirically test your disagreements, arguing is borderline unscientific. Debate is a waste of time, you should be running a study.
Instead of responding to criticisms with verbal arguments, we wanted to respond to them with data. We think this is good practice and we want to model it — we think everyone can agree that scientific debates on the internet would benefit if more people did empirical tests of their disagreements rather than forever dishing out verbal arguments and going in circles.
Now we have empirical results, so we can respond with the data. And we think it makes for a much more substantive response. Thank you for your patience. 🙂
Appendix
#1 Abrupt Shift
Do you agree with the obesity increase being gradual over the course of the 20th century, rather than “an abrupt shift” as you describe in ACH?
Much of this discussion is weird to us because, as far as we can tell, everyone is looking at the same data.
Natália wrote:
In the United States, the obesity rate among adults 20-74 years old was already 13.4% in 1960-1962 (a), 18-20 years before 1980. We don’t have nationally representative data for the obesity rate in the early 20th or late 19th centuries, but it might have been as low as ~1.5% or as high as 3%, indicating that the obesity rate in the US increased by a factor of >4x from ~1900 to ~1960.
We agree. Those numbers come from the same sources we used, like the NHANES and Helmchen & Henderson (2004). Natália quotes our sources back to us as if it contradicts what we said, which it doesn’t. It’s hard to know what to make of this kind of response.
Natália quotes us saying, “Between 1890 and 1976 … rates of obesity [went] from about 3% to about 10%.” She says, “the obesity rate in the early 20th or late 19th centuries …might have been as low as ~1.5% or as high as 3%”, and “the obesity rate among adults 20-74 years old was already 13.4% in 1960-1962.” Her numbers are also from about 3% to about 10%.
It’s hard to see how what we wrote “understates the meaningfulness and extent of the changes in average BMI and obesity rates that occurred before 1980.” Especially when Natália uses the same sources we used, and quotes the same numbers.
The important thing is that the obesity rate increased even more after 1960. See for example this graph we included in the original post:
Obesity rates went from something like 1.5%-3% around 1900 to something like 13.4% in the early 1960s. This is an increase of 11.9-10.4 percentage points over about 60 years. Then the obesity rate went from something like 13.4% in the early 1960s to something like 42.8% in 2017–2018. This is an increase of 29.4 percentage points over about 60 years. Based on these numbers, the obesity rate increased almost three times as much during 1960-2018 as it did from 1900-1960.
To us, this change looks both serious and abrupt. Per the CDC data, obesity rates for adults 20-74 years old went from 13.4% in 1960-1962 to 14.5% in 1971-1974, then to 15.0% in 1976-1980… then to 23.2% in 1988-1994, and then it keeps growing. A change of 1.6 pp from 1960-1962 to 1976-1980, a span of 20 years, followed by a change of 8.2 pp from 1976-1980 to 1988-1994, a span of just 14. You can see the slope of both obesity and extreme obesity change quite plainly on the figure. That seems like a serious change in the rate of change.
Is percentage points the wrong way of thinking about it? Natália says that “the obesity rate in the US increased by a factor of >4x from ~1900 to ~1960” when describing that change from 1.5%-3% around 1900 to 13.4% in the early 1960s. In comparison the change from 13.4% in the early 1960s to 42.8% in 2017–2018 would be about 3.2x. But intuitively, we think that a change from “for every 100 Americans you meet, about 3 are obese” to “for every 100 Americans you meet, about 10 are obese” is not as concerning as “for every 100 Americans you meet, about 10 are obese” to “for every 100 Americans you meet, about 40 are obese”.
To our mind, the strongest version of this critique is where you make the case that the rate of change in obesity rates is increasing, but not for the reasons you think. You could say, it’s true that the rate of change in obesity rates accelerated, but that might be an artifact of the distribution, while the rate of change in mean BMI was constant. And then you could make some argument about why rate of change in mean BMI is a better measure of the obesity epidemic than rate of change in obesity rates.
Having done some digging, we think this might be the argument Natália was trying to make in her original post. See in this comment thread, where Matthew Barnett, Natália’s husband, frames a version of this argument:
I think the relevant fact is that, based on the available data, it appears that average BMI increased relatively linearly and smoothly throughout the 20th century. Since BMI is approximately normally distributed (though skewed right), the seemingly sudden increase in the proportion of people obese is not surprising: it’s a simple consequence of the mathematics of normal distributions.
In other words, the smooth increase in mean BMI coupled with a normal distribution over BMI in the population at any particular point in time explains away the observation that there was an abrupt change centered around roughly 1980. It is not necessary to posit a separate, further variable that increased rapidly after 1980. The existing data most plausibly supports the simple interpretation that the environmental factors that underlie the obesity epidemic have changed relatively gradually over time, with no large breaks.
The OP of the Reddit thread, u/HoldMyGin/, said: ”My biggest criticism is the assertion that obesity rates started spiking around 1980 … isn’t that what one would expect to see if you’re measuring the percent of a normal distribution above a certain threshold, and the mean of that distribution is slowly but consistently inching upward?” We responded with a series of simulations that showed that the rate of increase in obesity rates is faster than what we would expect if the mean of the distribution were slowly increasing. For more detail on discussion of these models, definitely check out this great comment thread involving DirectedEvolution.
But all that said, we have some data about BMI, so why rely purely on models? Assuming that the data in this figure we adapted from Helmchen & Henderson (2003) are roughly correct, then mean BMI increase per year was about 0.04 points per year from 1890-1894 to 1976-1980 and about 0.11 points per year afterwards.
“You can see from the chart that (in this model) mean BMI didn’t really change until 1978. After this point it increased by ~4 points.”
And even if it’s true that the rate of change in obesity rates is an artifact of the smooth increase in mean BMI over time, this wouldn’t change the fact that there was a relatively abrupt change in the rate of change of obesity rates around the 1970s. People might still be surprised that the rate of change in obesity rates increased so much, that it went from 13.4% in 1960-1962 to 14.5% in 1971-1974, then from 15.0% in 1976-1980 to 23.2% in 1988-1994. We know that we were.
Natália brings in another source we want to talk about, from John Komlos and Marek Brabec. This does contest the pattern, saying:
The common wisdom, based on period effects, is that obesity as a public health problem emerged suddenly in the 1980s. However, the disadvantage of cross-sectional surveys, upon which all analysis has been based, is that the subject’s current weight does not reveal when that weight was actually reached. That weight could have been reached at any time before measurement and maintained thereafter.
Essentially, if we look at someone in 1990 and he’s obese, we don’t know if he just became obese, or if he actually was obese in 1970.
We’re not sure this logic makes sense. Let’s imagine a population of 100 people. We’re looking at them in 1990 and we see that 23 of them are obese. Komlos and Brabec say, “these guys are obese now, but that weight could have been reached at any time before measurement and maintained thereafter. Therefore we can’t use this to estimate the trend.”
But we can look at the data from 1970 and see that only 15 people were obese. We can say that there were more obese people in the later snapshot than in the earlier one. Even if we can’t necessarily say whether or not obese individual #12 from 1990 was obese or not in 1970, we don’t need to. The estimate of obesity rates at two points is independent of whether or not we can track any individual across the two points.
We’re skeptical of this analysis for a few other reasons. Collecting data is already hard enough; adding in a fancy statistical model gives you more places where something can go wrong. And there’s a lot of interpolation. We don’t have BMI data from before 1959, so many parts of the model are estimates, not real data. In general we think it’s better to trust measurements over models, unless it’s very clear why the model is better.
In this case, the justification for the model doesn’t make any sense to us, so we don’t see why you would prefer it. Per the CDC, a higher percentage of people were obese in the late 80s/early 90s than in the 60s and 70s, and the increase went from 1.6 pp between the 60s to late 70s, to 8.2 pp between the late 70s and late 80s/early 90s.
But even if we accept these models, it doesn’t look like a contradiction. When you look at the figures (though remember these lines are model estimates, not data), we see:
That looks like a change in the rate of change to us. And the biggest change in rate of change seems to be for the cohort born around 1960, i.e. people turning 20 around 1980. There are some interesting implications here — that growth in obesity rates are mostly driven by the top few deciles, that the bottom decile hasn’t seen any change since cohort 1935, etc. — but it doesn’t contradict the idea of a change in the rate of change.
Natália agrees, saying, “it does look like there has been an acceleration at the later birth cohorts for the few highest BMI percentiles, but a minor acceleration is arguably not the same thing as ‘an abrupt shift.’”.
It’s hard to tell what the argument is here. Are we disagreeing about what counts as a “minor acceleration” and what counts as an “abrupt shift”? Is this just semantics? There might be an argument about what is abrupt enough to be abrupt, and it’s fine if someone disagrees, but the numbers seem pretty distinct.
The first version of this blog post argued that, contra the SMTM authors, there wasn’t an abrupt shift in obesity rates in the late 20th century. Further discussion in the comments made me realize that the argument I was trying to make was too semantic in nature and exaggerated the differences in our perspectives. I changed this about 8 hours after the post was published.
More importantly, we think this shows a misunderstanding of the role this observation plays in our work.
In Part I of the series, we introduced the idea of an abrupt shift as Mystery #2, to help drive the intuition that the obesity epidemic is more surprising than people expect, that there’s a mystery here to be solved.
We still think the change in the rate of change is surprising. If you came to our work with the expectation that obesity has been increasing at a constant rate since the invention of the croissant, you would be pretty far off the mark.
This particular mystery is interesting, but it’s orthogonal to the contamination hypothesis. Contamination can happen either gradually or abruptly, so whether or not the shift was abrupt has little bearing on whether the contamination hypothesis is plausible or correct.
There are some contaminants that are much more plausible candidates if there was an abrupt shift around 1970. If we were considering two possible causes for the obesity epidemic, one potential cause that appeared abruptly around the 1970s and another potential cause that appeared on the scene more gradually, the abruptness of the shift could help us distinguish between them.
But a slow and gradual shift is compatible with many possible contaminants, including lithium. If anything, a gradual increase starting around 1950 is more compatible with the lithium hypothesis, because there’s some reason to think that lithium exposure increased gradually:
Graph showing world lithium production from 1900 to 2007, by deposit type and year. The layers of the graph are placed one above the other, forming a cumulative total. Reproduced from USGS.
#2 Medical Lithium Patients
Do you agree that even medical lithium patients don’t have enough weight gain to cause the obesity epidemic? If so, why do you think that getting a tiny fraction of that much lithium would?
As we understand it, the question here is this: The average American adult has gained something like 10-15 kg since the early 70s. But studies usually find that people on medical doses of lithium don’t get hyper obese, they gain only a few kilos on average. How can chronic, subclinical doses of lithium account for a gain of 10+ kg if acute, clinical doses don’t seem to cause more than 6 kg of gain?
First point here: We’re comfortable with the idea that lithium might not be the only factor causing the obesity epidemic. Natália knows this, she says, “[SMTM] also think that other contaminants could be responsible, either alone or in combination” in footnote 1 of this post.
Natália’s conclusion is, “lithium seems to cause an average of zero to 6 kg of weight gain in the long term. And strikingly, the upper end of that range, although large, is only half the amount of weight the average American adult has gained since the early 70s.”
To us, this doesn’t do anything to diminish the importance of this hypothesis. If lithium caused “only” 50% of the weight gain since 1970, or even just 10%, that would still be a pretty big deal. We should try to reverse it, so that everyone can be 6 kg lighter.
That said, let’s make the case that lithium might be responsible for more than 50%.
Modern people do tend to gain less than 15 kilos on clinical doses of lithium. But if we are already exposed to lithium in our food and water, we would expect that additional lithium would only top up the existing effect. If everyone’s on lithium already, then adding a bit more wouldn’t have the same impact as starting from zero, and will underestimate the total effect.
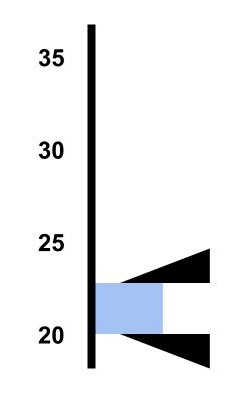
Think about the dose-response curve. For the sake of illustration, let’s imagine it’s like this, where the x-axis is dose of lithium per day, and the y-axis is extra weight gained from lithium exposure:
In the ancestral environment, everyone got less than 0.1 mg of lithium per day, and they had no extra weight from lithium. If you suddenly put one of these people on a clinical dose of 100 mg/day, they would gain 40 lbs.
Now let’s imagine that in the modern environment, everyone is getting 10 mg/day from their food and water. This would mean that everyone has already gained 20 lbs from chronic exposure. If we then put everyone on a clinical dose of 100 mg/day, they would gain only 20 lbs.
A person in this world might look at this and conclude that lithium doesn’t cause enough weight gain to cause the obesity epidemic. After all, adding a huge medical dose only makes you gain half of the observed effect. But in fact, lithium is causing the entire 40 lbs. It’s just that the background dose of 10 mg/day caused the first 20 lbs, and the 100 mg/day clinical dose is only topping up the remainder of the dose-response curve.
In fact, it’s kind of impressive that a clinical dose of lithium can cause like 6 kg more weight gain in an already obese population. If you gave the same dose to a hunter gatherer from 50,000 BC, he’d probably gain more.
In reality, everyone’s curve will be slightly different, the maximum effect will be slightly different, and so on. We discuss this at length in the introduction to our study, Subclinical Doses of Lithium Have Plenty of Effects. But the general logic still holds. If subclinical amounts of lithium are already causing weight gain, then adding more lithium on top will underestimate the total effect.
Scott also asks, “why do you think that getting a tiny fraction of that much lithium would [lead to weight gain?]”
One strong reason to suspect that trace or subclinical doses might lead to weight gain is the example of the Pima of the Gila River Valley in Arizona, who we’ve written about here and here.
The Pima were exposed to unusually high levels of lithium as the result of improperly sealed petroleum exploration boreholes that discharged salt brines to the surface. According to Sievers & Cannon (1973), the lithium levels in the Pima’s drinking water was 100 ng/mL, back when the average lithium concentration in American municipal water was about 2 ng/mL. Note that 100 ng/ml is a trace dose, but it’s 50x the level most Americans were getting in their water at the time, and it’s still a relatively high level for drinking water today.
Sievers & Cannon also found that lithium concentrated in some of the Pima’s crops. In particular, wolfberries were found to contain an “extraordinary” concentration of 1,120 ppm lithium by dry weight. We did some back-of-the-envelope math and estimated that the Pima might have been getting around 15 mg of lithium per day from wolfberry jelly. This is also a subclinical dose, but it’s still in the milligram range, even if our estimate is off by an order of magnitude.
The other notable thing about the Pima is that they were unusually obese, and had “the highest prevalence of diabetes ever recorded”, back before the general obesity rate had even broken 10%. We haven’t been able to find exact measurements of body weight, BMI, or obesity rate for the Pima in the 1970s, but all sources agree that they were unusually obese.
So, the Pima were exposed to chronic trace doses of lithium in their water and chronic subclinical doses in at least one of their common foods. The Pima were also unusually obese and had exceptionally high rates of diabetes. This doesn’t prove that the lithium exposure caused the obesity and diabetes, but it’s certainly consistent with that hypothesis, and it’s one reason to think that getting a tiny fraction of a clinical dose of lithium would lead to weight gain, especially with chronic exposure through food and water.
If lithium exposure was the cause, then that’s evidence that even trace amounts, when chronic, can cause more than 6 kg of weight gain, which supports the idea that lithium alone could explain more than 50% of the obesity epidemic.
You may suspect that this is us giving unfair weight to a piece of evidence that happens to closely fit a preferred hypothesis. Two reasons why you shouldn’t think that’s the case:
First of all, the Pima were brought to our attention as a counter-example, meant to challenge the lithium hypothesis. We were totally unaware of the Pima when we developed the lithium hypothesis, but during a discussion of these theories on the SSC subreddit, u/evocomp wrote,
The famous Pima Indians of Arizona had a tenfold increase in diabetes from 1937 to the 1950s, and then became the most obese population of the world at that time, long before 1980s. … What’s the chance that all these populations who lived under calorically-insecure evolutionary pressures are all independently highly sensitive and equally exposed to Lithium, PFAS, or whatever contaminants are in SPAM or white bread?
So the example was chosen to be adversarial, and u/evocomp was right to challenge us in this way. But when we looked into it, we not only found that the Pima were equally exposed to lithium, but that they were enormously exposed to lithium.
The rationalist citations here are Making Beliefs Pay Rent (in Anticipated Experiences) and Fake Causality. The core idea is that a good test of a theory is whether it makes accurate predictions about new, not-yet-seen data, not whether it can be made to fit old data retroactively. You develop a theory by fitting it to past data, which constrains the possibilities, but you can’t test it that way. You evaluate a theory by how accurately it predicts new, unseen evidence. This was an adversarial test with unseen evidence, and the lithium hypothesis scored almost perfectly on prediction. It’s a major reason we started preferring the lithium hypothesis over other contaminants!
Here’s a project we would love to see from a third party (Scott qualifies): Try to find other populations that were notably obese before the 1970s. We predict that if any such populations can be found, many of them will be found to have been exposed to high levels of lithium, or will have been found to be exposed to factors associated with high levels of lithium, like drawing drinking water from deep wells, early fossil fuel prospecting, other mining, seismic or volcanic activity, other water quality issues, etc. We say “many” rather than all because we don’t think that lithium is the only thing that can cause obesity. It would still be consistent with the lithium hypothesis if there were some early populations that were made obese by something else.
Second, back in the 1970s, Sievers & Cannon wrote:
It is tempting to postulate that the lithium intake of Pimas may relate 1) to apparent tranquility and rarity of duodenal ulcer and 2) to relative physical inactivity and high rates of obesity and diabetes mellitus.
Sievers & Cannon also suspected that lithium exposure might be responsible for the high rates of obesity and diabetes in the Pima. They couldn’t possibly have been said with the goal of explaining the obesity epidemic, because the obesity epidemic didn’t exist in the early 1970s when the quote was written. Sievers & Cannon had no idea it was coming.
Whatever factors you think might have misled us into thinking that lithium causes high rates of obesity and diabetes, they couldn’t have misled Sievers & Cannon. They came to the same conclusion independently, about fifty years before we did.
Finally, we think chronic exposure to low doses of lithium may build up over time, to the point where chronic trace exposure can eventually lead to clinical levels in your brain. It might take 10 or 20 years for trace levels in your water to lead to clinical levels in your brain, but we all spend 10 or 20 years consuming trace amounts in our water, so that’s no problem.
In our discussion with JP Callaghan, at the time an MD/PhD student with expertise in protein statistical mechanics and kinetic modeling, he put together a three-compartment model (gut -> serum <-> tissue) and found that, for plausible values of the parameters, “lognormally distributed doses of lithium with sufficient variability should create transient excursions of serum lithium into the therapeutic range” and “in that third compartment [brain], you get nearly therapeutic levels of lithium in the third compartment for whole weeks (days ~35-40) after these spikes, especially if you get two spikes back to back.”
There are limitations here, but they cut both ways. On the one hand, the parameters of both the system and the lognormal doses are plausible, but made up. On the other hand, it’s not clear if therapeutic ranges in the brain are needed to cause weight gain. Weight gain could start at brain levels well below the therapeutic.
The model is more of a sanity check, and it does support the idea that chronic exposure to trace or subclinical levels of lithium over a long enough time could lead to relatively high concentrations in the brain, thyroid, and/or bone. In addition, chronic effects may be different from acute effects. Take a look at our discussion with JP Callaghan to learn more.
#3 Trace Lithium and Trace Effects
Natália lists several reasons to expect that trace lithium doses should have only trace effects – Gwern’s reanalysis showing few-to-no psych effects, some studies suggesting low doses have fewer side effects, and lack of any of the non-weight-gain side effects of lithium in trace users. What are your thoughts on this?
Let’s start at the top. Natália writes, “Gwern has looked into this (a) and concluded that the evidence that such low doses of lithium cause psychiatric effects is actually fairly weak.”
This is a pretty rough gloss of what Gwern actually said. Gwern does say that the evidence is weak, but he doesn’t claim it’s nonexistent. Overall he takes the hypothesis seriously. His topline summary says:
Epidemiological research has correlated chronic lithium consumption through drinking water with a number of population-level variables … However, the evidence is weak.
But in the body of his article, he writes, “The criticisms of the trace lithium correlation seem weak to me”. So Gwern’s position is mixed: he thinks the evidence and the criticisms are both weak. He thinks we need to run more experiments, and we agree.
There is at least one existing RCT of trace-level effects. This is Schrauzer & de Vroey (1994). In this study, the researchers gave a group of former drug users (heroin, crystal meth, PCP, and cocaine), either 0.4 mg per day (a tiny trace dose) of lithium orally, or a placebo. Even on such a tiny dose, everyone in the lithium group reported feeling happier, more friendly, more kind, less grouchy, etc., “without exception”.
Gwern doesn’t mention this paper in his review (though he does cite other Schrauzer papers), so we assume he hasn’t encountered it. It’s a small study, just 24 subjects, but it’s a start in the direction he recommends, it provides a little experimental support for the correlational findings.
Gwern’s overall position seems to be one of cautious skepticism. On the one hand, there are lots of suggestive correlations. On the other, psychiatric doses are much higher than groundwater doses. He says, “one of the main problems with inferring that lithium causes these reductions [in various symptoms] is that it seems difficult to reconcile with how large the doses must be to treat mental illness”.
Gwern considers some ways to resolve this dilemma, and we want to focus on a few of them in particular. One option he considers is that:
…groundwater doses [may be] more effective than one would expect comparing to psychiatric doses of lithium carbonate (perhaps due to chronic lifelong exposure…)
This is one of the options we discussed with JP Callaghan. It seems plausible that with chronic lifelong exposure, lithium accumulates in the brain or thyroid, or possibly in the bones. If it does, that could lead to a reservoir. Gwern makes a similar point in the next paragraph, saying:
Ken Gillman … criticizes the correlations as generally invalid due to the smallness of the drinking water dose compared to the dietary doses of lithium; I disagree inasmuch as lithium doses are cumulative, Schrauzer 2002 reports an FDA estimate of daily American lithium consumption 1mg, points out that natural levels can reach as high as 0.34mg via drinking water
Gwern also considers this response:
…lithium may have multiple mechanisms one of which kicks in at psychiatric dose levels and the other at groundwater levels (somewhat supported by some psychiatric observations that depressives seem to benefit from lower doses but in different ways; negate #1 in a different way)
We agree this is plausible, and we found evidence for this argument in our study, Subclinical Doses of Lithium Have Plenty of Effects. We polled people on Reddit who took lithium as a nootropic, and asked them to tell us what lithium compound they took, how much they took per day, approximately how many days they tried the dose for, and what effects they experienced on each dose.
People reported many different effects of lithium at subclinical doses (ballpark 1-10 mg/day). Even in our limited dataset, our collaborator Troof found evidence for different effects kicking in at different doses, and sent us this figure:
Both of Gwern’s interpretations are supported by the example of the Pima.
Following chronic lifelong exposure to relatively high but still trace groundwater doses, the Pima ended up with very high rates of obesity and diabetes, despite getting what were small daily amounts compared to psychiatric doses of lithium carbonate.
Their example also supports the idea that lithium has some effects that kick in at psychiatric dose levels and others at groundwater levels. The Pima became obese and lethargic, but didn’t (as far as we know) suffer from hand tremors or nausea. We shouldn’t be at all surprised if a drug has some effects that kick in at one dose and other effects that kick in at other doses. See our arguments here for more detail.
Does that prove that the lithium in their food and water caused the high rates of obesity and diabetes? No, but it’s consistent with the hypothesis, and evidence in favor.
These examples also seem to address the concern of “some studies suggesting low doses have fewer side effects, and lack of any of the non-weight-gain side effects of lithium in trace users”.
The Pima were exposed to chronic trace amounts of lithium. They did have high rates of obesity and a few other possible symptoms. But they didn’t (as far as we know) experience other side effects like hand tremors, ringing in the ears, or “eyeballs bulge out of the eye sockets”. This doesn’t clarify whether or not the obesity was caused by the lithium, but it does clarify that chronic low doses of lithium don’t cause these non-weight-gain side effects.
And in our study, Subclinical Doses of Lithium Have Plenty of Effects, redditors who took subclinical doses of lithium did commonly report some non-weight-gain side effects, like increased calm, brain fog, frequent urination, and decreased libido, but rarely or never reported other side effects, like eye pain, fainting, or severe trembling.
In fact, the only three participants who reported tremors were all on clinical doses — 300 mg/day lithium carbonate, 600 mg/day lithium carbonate, and 50 mg/day listed as lithium orotate (we think this means 50 mg/day elemental). This suggests that tremors don’t kick in at subclinical doses. So from this example too, we see evidence that low doses of lithium cause some non-weight-gain side effects, but don’t cause many others.
We also think it’s possible (though not necessarily likely) that some non-weight-gain side effects of lithium exposure are widespread, and the change was just slow enough that people mostly didn’t notice. Consider:
A final thing to note here is that the EPA says they are concerned about lithium exposure, even at the trace levels found in drinking water. They write:
Although useful for treating mental health disorders, pharmaceutical use of lithium at all therapeutic dosages can cause adverse health effects—primarily impaired thyroid and kidney function. Presently lithium is not regulated in drinking water in the U.S. The USGS, in collaboration with the EPA, calculated a nonregulatory Health-Based Screening Level (HBSL) for drinking water of 10 micrograms per liter (µg/L) or parts per billion to provide context for evaluating lithium concentrations in groundwater. A second “drinking-water-only” lithium benchmark of 60 µg/L can be used when it is assumed that the only source of lithium exposure is from drinking water (other sources of lithium include eggs, dairy products, and beverages such as soft drinks and beer); this higher benchmark was exceeded in 9% of samples from public-supply wells and in 6% of samples from domestic-supply wells.
This strikes us as strange — 10 µg/L and 60 µg/L are higher than historical levels, but those are pretty trace amounts, even by our standards. In comparison, the Pima were exposed to about 100 µg/L. We don’t know why the USGS and EPA are concerned about these levels, or where those thresholds come from, but it’s notable that they are concerned.
If anyone can find out where they got these numbers, please let us know. The USGS people haven’t responded to our emails.
#4 Wild Animals and Obesity
Do you agree that wild animals are not really becoming obese?
This is a misunderstanding about the use of the word “wild”.
Our main source for animals becoming obese was Klimentidis et al. (2010), Canaries in the coal mine: a cross-species analysis of the plurality of obesity epidemics. This is a study of weight change over 20,000 animals from 24 distinct populations and eight species, and the top-line finding was that “In all populations, the estimated coefficient for the trend of body weight over time was positive (i.e. increasing).”
This paper uses the terms “wild” and “feral” to refer to a sample of several thousand Norway rats. Following this source, in Part I of A Chemical Hunger we also use the terms “wild” and “feral” to refer to these rats. We say, “Humans aren’t the only ones who are growing more obese — lab animals and even wild animals are becoming more obese as well. Primates and rodents living in research colonies, feral rodents living in our cities, and domestic pets like dogs and cats are all steadily getting fatter and fatter.”
This word seems to have caused a lot of confusion. Many people got the impression that we were claiming that rhinos on the Serengeti were becoming more obese. What we meant was that the obesity epidemic isn’t limited to humans. That’s consistent with the examples we used. We summarized this paper as: “Primates and rodents living in research colonies, feral rodents living in our cities, and domestic pets like dogs and cats are all steadily getting fatter and fatter,” and that’s exactly what the study says. Natália appeals to a dictionary definition to claim that we’ve said something wrong here, but the paper we cited literally refers to these rats as “wild”!
We talked about this study the same way every time we brought it up, in our posts or in conversations on Twitter. Natália selectively quotes one part of one of this sentence to make it look like we’re misrepresenting the results, but she leaves out the fact that we always included the context. We wrote:
Natália cuts off the first part and only says: “even wild animals have gotten more obese over the past several decades”, distorting the focus. We are not sure what more we could have done to make our meaning clear.
But the broader question is definitely interesting, so let’s consider it now: have “truly wild” animals, living totally separately from humans, been getting obese as well?
We think this is a point where reasonable people can disagree. There isn’t much data about the weight of truly wild animals over time, let alone good data that can distinguish how fat they are independent of other possible changes in their weight (e.g. they’re getting larger but not fatter).
When there’s not much data, you look for the data there is and see what it can tell you. In this case we don’t expect the data will be well-controlled or that it will do a good job accounting for alternative explanations. We just want to look and see if truly wild animals are heavier now than they were in the past.
There are alternative explanations for these trends of course — less competition for food, etc. — but at the very least these do seem to be animals eating pretty wild diets, and they do seem to be gaining weight
Basically, we find data that are consistent with the idea that truly wild animals are getting heavier. And we point out that there are alternative explanations.
So it’s pretty strange that Natália’s response is to point out there are alternative explanations. For example, she says:
Predation decreases their population density, which increases the amount of energy available for each individual deer in their habitat.
That’s the same alternative explanation we considered in the tweet: “less competition for food”. We know she must have read this tweet because she cites the thread in her post. We don’t know why she doesn’t mention that we highlighted the same alternative explanation. She’s framing it as though we thought this study was a slam-dunk, when we only ever said it was suggestive.
Better studies that control for confounds would be ideal. But there are always alternative explanations. In the absence of controlled studies, we use the best available data and evaluate how consistent it is with the hypothesis.
Certainly if we had looked for the weights of white-tailed deer and found that they were flat since 1970, or that their weights were decreasing, that would have been some evidence against the idea that truly wild animals are becoming obese, or at least inconsistent. So finding that weights are steadily increasing is some evidence in favor of the idea that truly wild animals are becoming obese, or at least it’s consistent with the idea.
Overall, this feels like an isolated demand for rigor, an “[attempt] to demand that an opposing argument be held to such strict invented-on-the-spot standards that nothing (including common-sense statements everyone agrees with) could possibly clear the bar”. To use Scott’s framing, “evidence consistent with a hypothesis doesn’t count if there are alternative explanations for that evidence” is a fake rule we never apply to anything else.
#5 Lithium at Altitude
Do you agree that water has higher lithium levels at high altitudes (the opposite of what would be needed for lithium to explain the altitude-obesity correlation)?
We believe Scott is referring to this argument from Natália:
Using publicly-available data from the USGS and the Open Elevation API, I found that across 1,027 domestic-supply wells (all wells whose coordinates were available), the correlation between altitude and log(lithium concentration) is 0.46. I also checked the correlation between altitude and topsoil log(lithium concentration) in the United States, with data I found here, and, again, it was positive (0.3). So lithium exposure is probably higher, rather than lower, in high-altitude areas in the United States (which, as a reminder, have lower obesity rates).
This criticism was pretty surprising to us, because we literally discussed it in the original series! In Interlude H (“Well Well Well”) we explored the same USGS dataset in depth and said:
One thing that you’ll notice is that the distribution of lithium in well water doesn’t match up all that well with the distribution of obesity. Colorado is the leanest state but has pretty high levels of lithium in its well water. Alabama is quite obese but levels of lithium in the well water there are relatively low. What gives?
…all of these measurements are of well water, but many areas get their drinking water from surface sources rather than from wells.
Let’s start with Colorado, since it’s the clearest example. As you can see from the map above, the average level of lithium in Colorado well water is higher than the national average. We have the raw data, so again we can tell you that the median level in Colorado wells is 17.8 ng/mL, the mean is 28.0 ng/mL, and the max is a rather high 217.0 ng/mL.
But this doesn’t matter, because almost none of the drinking water in Colorado comes from wells. Instead, most of the drinking water in Colorado comes from surface water, and most of that water comes directly from pure snowmelt.
We go on like this for a while.
Natália’s analysis only covers domestic-supply wells. These wells provide only part of our drinking water. It appears to exclude public-supply wells, and it entirely excludes surface water sources.
This is a problem, because we would expect the altitude-obesity correlation to mostly come from surface water contamination. Water from drilled wells has often been down there for thousands or hundreds of thousands of years, so lithium concentration in these aquifers is largely independent of human activity. But runoff from roads, landfills, brine spills, power plants, and factory explosions goes directly into surface water, and from there directly into people’s mouths. When we looked at the most obese communities in America, we found that many of them got their drinking water from surface water sources, often sources that have been exposed to lithium contamination from fossil fuels or from explosions at the local lithium grease plant.
It’s also worth restating that our position is that altitude is a proxy for “height in watershed”, which is itself a proxy for overall contamination. For example, West Virginia is relatively high elevation but also quite obese. In fact, it’s currently the most obese state of them all, at 41.2% obese. Why bother computing these correlations, doesn’t West Virginia disprove the theory all on its own?
Not at all, because despite being high-altitude and high in its watershed, West Virginia is home to an enormous amount of environmental contamination — especially from fossil fuels, which are a leading cause of lithium contamination. When you look at the local WV coal power plants, you find that they are leaking lithium into the surrounding water supply, sometimes at levels of above 100 ng/mL.
Even without these issues, this correlation can’t be a meaningful measure of the lithium-altitude question because the data aren’t at all representative. To extend correlation results to a population, the data should be a random (or otherwise representative) sample from that population. These data are not representative geographically or by population density. Here’s a map of the domestic-supply wells from this dataset (which Natália must have seen, because she has the same map in her post):
As you can see, the data mostly comes from Nebraska, certain parts of Texas, and the East Coast. Some parts of the country are barely represented; and some states, like Tennessee, are not represented at all.
So even if there is a small correlation within this dataset, it’s not an estimate of the correlation between lithium and altitude in the country as a whole, not even just within domestic-supply wells. Without a representative sample, we can’t reasonably infer that the same relationship in general would hold across the U.S.
#6 Lithium in American Food
Scott didn’t mention this one, but it’s the point that sparked Natália’s criticisms in the first place, so we think it deserves special attention.
This whole story begins when we put out a literature review of lithium levels in food. We concluded that, “There’s certainly lithium in our food, sometimes quite a bit of lithium. It seems like most people get at least 1 mg a day from their food, and on many days, there’s a good chance you’ll get more.”
The opening argument of Natália’s original post disputes this conclusion. Her argument is largely based on evidence from Total Diet Studies (TDS), which find less than 0.5 mg/kg lithium in every single food.
Natália prefers the TDS numbers, which is fine. But she says that our “literature review pretty much only includes studies that are outliers in the literature”. And she says that our review “largely relies on old data from a single author from Germany”.
This is not true. We cite more than 20 papers in that literature review, some of which are review papers that include other papers we didn’t cite directly. Only two of the papers we cite include this German author, Manfred Anke, as one of the authors — Anke, Schäfer, & Arnhold (2003) and Anke, Arnhold, Schäfer, & Müller (2005). We also mention two papers from Anke from 1991 and 1995, but we weren’t able to find them at the time, so they aren’t among the papers we cite and we weren’t able to include their data in the review. Are sources from 2005, 2003, 1995, and 1991 “old data”? They’re certainly not as old as many of the other sources we cited, like this 1941 Nature publication or this 1929 Science publication, which Natália didn’t complain about.
Maybe this is more of a concern about the number of times we mention Anke, rather than the proportion of papers he contributed. We do quote Anke a lot, but this is because he reports a lot of measurements in those two papers. Anke reported measurements for almost every food group, and we wanted to pass those measurements on to the reader. Omitting these measurements from our review would be a serious oversight.
We’d prefer to have more sources, but for some foods we could only find one or two sources besides Anke. We even complain in the post about having to rely so much on his data, saying “the bad news is that, like pretty much everything else, levels in animal products are poorly-documented and we have to rely heavily on Manfred Anke again.” This is why we conclude by calling for more research.
The truth is that there’s a split in the literature. The TDS studies consistently find low levels of lithium in food and beverages, as do some other papers. But other sources find much higher levels (not an exhaustive list):
Bertrand (1943), “found that the green parts of lettuce contained 7.9 [mg/kg] of lithium”
Borovik-Romanova (1965) “reported the Li concentration in many plants from the Soviet Union to range from 0.15 to 5 [mg/kg] in dry material”, in particular listing the levels (mg/kg) in tomato, 0.4; rye, 0.17; oats, 0.55; wheat, 0.85; and rice, 9.8.
Ammari et al. (2011), looked at lithium in plant leaves, including spinach, lettuce, etc. and found concentrations in leaves up to 4.6 mg/kg Fresh Weight.
Manfred Anke and his collaborators found more than 1 mg/kg in a wide variety of foods, in multiple studies across multipleyears, up to 7.3 mg/kg on average for eggs.
Schnauzer (2002) reviewed a number of other sources finding average intakes across several locations from 0.348 to 1.560 mg a day.
Five Polish sources from 1995 that a reader sent us reported finding (as examples) 6.2 mg/kg in chard, 18 mg/kg in dandelions, up to 470.8 mg/kg in pasture plants in the Low Beskids in Poland, up to 25.6 mg/kg in dairy cow skeletal muscle, and more than 40 mg/kg in cabbage under certain conditions.
Some of these measurements are of dry weight, so the fresh food would presumably have less. But others are fresh weight and still find > 1 mg/kg.
So, some sources find less than 1 mg/kg of lithium in food and beverages, others find more. The thing to do is to look at the totality of the evidence and try to figure out what’s going on. When results differ, it’s an opportunity to come up with hypotheses and do some testing to determine why.
We went back and took a closer look at the study methods. What we noticed is that the studies that found < 1 mg/kg lithium tended to use the same analysis technique — inductively coupled plasma mass spectrometry (ICP-MS) with microwave digestion with nitric acid (HNO3). The studies that found more than 1 mg/kg lithium in food mostly used a variety of other techniques. This made us suspect that the split in the literature is caused by the fact that different analytical methods give very different results, with some methods giving much higher and other methods giving much lower estimates.
To test this, we ran a study where we compared a couple different analytic approaches on a short list of diverse American foods. This confirmed our hypothesis. When the foods were digested in HNO3, both ICP-MS and ICP-OES analysis mostly reported that concentrations of lithium were below the limit of detection. And when foods were dry ashed first, both ICP-MS and ICP-OES consistently found levels of lithium above the limit of detection, reporting concentrations of several mg/kg for many of the foods we tested:
We think the higher numbers are more accurate — our full reasoning can be found in the original post. But even if you take the more conservative numbers as real, they still support the idea that foods sometimes contain more than 1 mg/kg, as these methods found up to 1.2 mg/kg lithium in goji berries.
The main finding of Study 1 is that that lithium was detectable in nearly all eggs:
Study 2 looked at egg-to-egg variation, finding less variation in samples from 1-egg batches than 4-egg batches, and generally confirming the results of Study 1:
A few general points here.
Don’t verbally disagree, empirically disagree. We could go back and forth for months, arguing about who is cherrypicking whom, which set of studies are really the “outliers”, whether SMTM relied too much on data from a single author from Germany, or whether or not four papers from 1991, 1995, 2003, and 2005 count as “old data”.
Why not run new studies to try to get to the bottom of things instead? Natália correctly pointed out that there was no lithium data from food from the modern United States. That was a big gap in our understanding, so we tested foods from the modern United States. Now those data exist.
Internet scientists can do more than comb over other people’s work and fight about it. It’s much better to settle confusion with data than with words, much more productive to fight over study design than over definitions. Let’s do that instead.
Analytical chemistry is not easy! People seem to assume that you can put a food sample into a machine and get an objective measurement of how much lithium is in that food out the other side. We know this because we kind of assumed the same thing before we did this project. Chemistry is one of those sciences that we have pretty well solved, right?
Turns out, it’s much more complicated. Different analytical techniques give different answers. And those answers aren’t objective, they’re just estimates. You realize that none of the measurements in the literature are any more objective than yours. They all require interpretation, and any of them could be wrong.
At some point we thought that the difference in findings was the result of different analytical techniques, so we were only going to compare ICP-MS to ICP-OES, with identical digestion. We happened to throw in different digestion techniques just in case. And it’s a good thing that we did, because that ended up being the main finding. It would have been easy to miss.
These two analytical techniques disagree, and it’s possible that one or both are overestimating lithium concentrations. But it’s also possible that they’re both underestimating lithium concentrations. We found up to 15 mg/kg lithium in eggs, but if the techniques are systematically underestimating the true concentrations, then maybe eggs contain more. Maybe they contain a lot more.
In fact, we think it’s more likely that these techniques underestimate lithium than overestimate. Lithium is especially tricky to measure because it is a tiny and extremely light ion that reacts differently depending on what else is in the sample. These kinds of problems tend to make tests read too low, not too high. Sources often emphasize how easy it is to run into these problems, like this article by environmental testing firm WETLAB which describes several potential problems in lithium analysis: “some of the limitations for lithium analysis are that lithium is very light and can be excluded by heavier atoms. … When Li is in a matrix with a large number of heavier elements, it tends to be pushed around and selectively excluded due to its low mass. This provides challenges when using Mass Spectrometry.”
So if our tests found 15 milligrams per kilogram in eggs, the real number could be even higher. And if that’s true, then we may still be underestimating how much lithium is actually in the food we eat.
This isn’t the end of the story, of course. We only tested a small number of foods, and we didn’t test many samples of each. We think this confirms that Americans regularly consume foods containing more than 1 mg/kg of lithium, but it doesn’t give a great sense of which foods contain the most lithium, or how much lithium might be contained at the upper limits. We found eggs that contain 15 mg/kg after looking at only a small number of eggs, so there are probably eggs out there that contain more, maybe a lot more. We haven’t tested wheat or soy, so if those contain 10 or 50 or 100 mg/kg, we wouldn’t know.
We’re currently fundraising to continue these studies, test more foods, and compare more analytical techniques so we can determine which technique(s) gives the most accurate measurements. We think it would be good to know how much lithium is in the American food supply, which foods have the highest concentrations, and how to measure these things in general.
If you’ve read to this point of the post you must be genuinely interested in this work, so please contact us. If you’d prefer the analyses to come from a third party, we would also love to see independent teams investigate these same questions and we’re ready to help.
Some Thoughts
Something about this whole discussion still strikes us as very odd.
Maybe it has something to do with how we think about science. Either the lithium hypothesis is already true, or it is already false. Arguments can change minds, and can shape how people decide to spend their time and energy, but the hypothesis is already true or false. If it is true, then all observations in the future will bend towards it. Otherwise they won’t. Argument can’t change that.
Any given hypothesis, we can take it or leave it. The real goal is to cure obesity, or at least figure out where the obesity epidemic came from. We give the lithium hypothesis a lot of weight because we still find it to be well-supported by the evidence — it’s not perfect, but it has predicted things that no other theory would predict (like that the Pima would have high levels of lithium in their water in the early 1970s) and it accounts for evidence that other hypotheses have a hard time accounting for (like why auto mechanics have such high rates of obesity).
We’re not on the “side” of the lithium hypothesis, but we’re happy to make the case for it as long as we think that it’s a plausible hypothesis. And as long as we think it’s the most likely hypothesis, we’ll keep looking for evidence that will help us clarify, like the studies of lithium in American food that we mentioned above.
If the lithium hypothesis is not true, or only accounts for a minor fraction of the obesity epidemic, we want to find out as soon as possible, so we can investigate other theories instead. For what it’s worth, we do think there’s some chance that the obesity epidemic is caused by pesticides, or something related to cars and heavy machinery, maybe in the exhaust.
We don’t understand why people think we are partisan in favor of the lithium hypothesis, but it’s a real stumbling block for these conversations. Good relationships are fundamentally based on the assumption of good faith, which means giving the other person the benefit of the doubt and believing they have positive intentions, even when their actions are unclear or confusing.
It is hard for us to know how to respond to people who start with the assumption that we are partisan and have bad intentions, for the same reason it is hard to productively respond to that schoolyard taunt, “does your mom know that you’re gay” — it is strongly and negatively framed, and any response plays into that framing. When people come at us asking us to defend a position rather than discuss it as colleagues, it’s a missed opportunity for everyone to work together.
We’d like to ask you to treat us like people rather than like opponents. There is a real mystery to be solved here, and our best bet at solving it is everyone working together and extending each other as much curiosity and charity as possible.
We can and should have fierce disagreements over the facts, but as long as our shared goal is finding the truth, we can have these disagreements in collaboration and good humor.
Today’s correspondence is from a husband and wife who wish to remain anonymous. This account has been lightly edited for clarity, but what appears below is otherwise the original report as we received it.
The potato diet has mostly been used for weight loss, but it’s also notable for involving mostly one food and being close to nutritionally complete, which means you can use it as an elimination diet to study things like food triggers. We’ve been interested in this idea for a long time, and we find this case study particularly compelling because it’s a rare example of someone doing just that!
Since around 2018, K had been suffering from stomach pain, bloating, gas, and chronic constipation. Chronic constipation worsened after two pregnancies, so K sought medical intervention again in Feb 2025. K was prescribed medication (Linzess) to treat the constipation, which initially improved symptoms but was unreliable and had unpleasant side effects. She had been on that medication for 1 month before starting the potato diet.
Family and friends were bewildered to hear our plan, warning us of muscle loss and blood sugar problems since potatoes are ‘bad’.
Her initial goal was to lose 5-10 pounds from a starting BMI of 23.4 and test out the claims we read online about the diet. K actually joked, “wouldn’t it be funny if this diet fixes my stomach problems?”
We started the diet on 21MAR2025. The first two and a half days were 100% potato for both of us. Morale was suffering by the afternoon of day 3, so we caved and had a potato-heavy dinner with our kids. Afterwards, we agreed to eat only potatoes until dinner so we could still have a normal family meal time. We did make sure potatoes featured heavily in the weekly meal plan.
Within a week, K noticed improved symptoms and regularity without any medication. Initially, she thought she might have a lactose intolerance, so she switched to lactose-free milk and quit the potato diet once we reached the end of our planned testing window.
Back on a regular diet (but still avoiding lactose), K’s symptoms came back worse, with constant stomach aches and bloating. K realized that she had unintentionally been on a low-FODMAP diet while on the potato diet and decided to do intolerance testing.
Her methodology for intolerance testing follows:
Ate a high-potato, low FODMAP diet until minimal symptoms were present.
Used NHS FODMAP rechallenging protocol to isolate FODMAP groups (lactose, fructans from wheat, fructans from onions, fructans from garlic, fructans from fruit, fructose, galactooligosaccharides, sorbitol, mannitol, fructose + sorbitol) and identify foods to use for testing each group
Spent 3 days of rechallenging per group: day 1 – small portion, day 2 – med portion, day 3 – large portion of challenge food (ex: 1/4 cup milk, 1/2 cup milk, 1 cup milk)
Kept daily log of symptoms and severity
Allowed 3 days of ‘washout’ after rechallenging
Rechallenged next food group, but did not incorporate challenged foods into diet to avoid multiple FODMAP effects
If symptoms appeared after a food challenge, waited till symptoms subsided and repeated the rechallenge over another 3 days
Incorporating lots of potatoes allowed K to test out food groups while still eating a well-balanced diet. The culprit for K is fructans from wheat, which is why cutting out daily servings of wheat has made her symptoms disappear.
K is finishing FODMAP testing (still a couple more groups to go), but has had reliable relief from all symptoms without any meds. Potatoes are a regular addition to meals these days.
This account has been lightly edited for clarity, but what appears below is otherwise the original report as we received it.
Hi Slimes,
I’ve recently wrapped up a year-long weight loss self-experiment. During this time I lost 50 lbs, most of it on a Potatoes + Dairy version of the potato diet.
This corroborates your recent case studies where Potatoes + Dairy caused just about as much weight loss as the standard potato diet. It certainly worked well for me. I found the diet really enjoyable, my meals were always delicious. I didn’t get tired of the potatoes, they remain one of my favorite foods. And there were a few other interesting findings as well, all described below.
I’m a longtime reader of the blog so this is me sending you my report, which you can publish if you like. Please list me as “Cole” (not my real name). I hope you find it helpful.
Background
First, my demographics. I’m a white male American in my early-mid 30s. I’m about 5 feet 11 inches tall, but I have a large frame. While you should feel free to calculate my BMI at any point, I don’t think it’s a very accurate measure of adiposity in my case.
My first baseline is in mid 2022, when I weighed about 220 lbs. I know this because I tried a version of the potato diet at the time and lost about 10 lbs over about 40 days. I wasn’t seriously concerned with my weight at the time, I was mostly just curious about the potato diet and what it feels like “from the inside”. But this turned out to be relevant later on because it let me know that I’m a potato diet responder.
In mid 2022 I was about to start a new job, one that involved a lot of hard work, stress, and late nights, and also a longer commute / a lot more driving than I am used to (I mention this because I’m sympathetic to the hypothesis that obesity is linked to motor vehicle exposure in some way).
I didn’t notice at first, but after starting this new job, I started to gain weight. Around April 2024, I realized that I weighed almost 250 lbs. This was heavier than I had ever been before, and also quite uncomfortable. For anyone who’s never gained 10+ lbs before, let me tell you, it makes everything in your life just a little more difficult, including things like sleeping, and that sucks.
But this crisis turned into an opportunity: I was about to change jobs again, this time to a job with much more reasonable hours and that required almost no driving. I wanted to lose the weight anyways, so I decided to take this opportunity to run a series of diet experiments and investigate some of the findings you’ve presented on the blog.
The Experiment
I began the study on May 12, 2024, with a starting weight of 247.6 lbs. Per previous potato diet experiments, I weighed myself in my underwear every morning for consistency.
To track my weight and my progress, I used a google sheet based on the one you shared from Krinn’s self-experiment with drinking high doses of potassium. I found her columns tracking 7-day average, personal best, and “ratchet” to be pretty helpful. Would recommend for anyone else trying a weight loss self-experiment.
I didn’t start any new exercise habit, though as I mentioned, I did start a new job and was driving less, I no longer had a weekly commute. So it’s possible that some of the weight loss is from “lifestyle changes” but I don’t think it could be much. According to my phone I’ve averaged about 7,000 steps per day the entire time, while gaining the weight and then while losing it.
The self-experiment can be broken into three main phases: the high-potassium brine phase, the Potatoes + Dairy phase, and a short run-out phase at the end.
For the first 147 days of the experiment, I tried different high-potassium brines, and lost about 12 lbs.
All brines started with a base of two 591 ml blue Gatorades, mixed in a liter bottle with whatever dry electrolytes or other ingredients I was trying. Potassium was always added as KCl in the form of Nu-Salt.
I tried a wide variety of different brine mixtures, using different amounts of KCl as well as NaCl, sodium bicarbonate (baking soda), magnesium malate, iodine (as Lugol’s 2% solution), and glycine powder. But I don’t think these mixtures are worth reporting individually, because I wasn’t able to seriously distinguish between them. Regardless of the mix, I mostly kept losing weight at a very slow pace.
My impression is that magnesium is important, and that brines with added sodium work better than brines without, but I’m the first to admit that the data isn’t strong enough to back this intuition up. The most I can say is that I seemed to lose weight in kind of a sine-wave pattern, which you can see on the graph. These ups and downs roughly lined up with the 14-day cycles where I tried different brine recipes (i.e. I tried most recipes for 2 weeks), but I might have imagined a pattern where in reality there were just natural fluctuations.
While I originally hoped to get around 10,000 mg a day of potassium from my brine, like Krinn did, this wasn’t possible. I found doses above 6,600 mg/day K hard to drink, so I settled at that dosage, reasoning that Krinn lost weight even at lower doses.
In general, the brines made me feel weird. I sometimes became anxious, sometimes fatigued, sometimes got headaches, and sometimes it did weird things to my sense of smell. I did sometimes feel very energetic, and sometimes it seriously reduced my appetite. Some days I ate almost nothing and had almost no appetite. But even with a clear reduction in my appetite, even when I was eating very little, I didn’t lose much weight. (This itself was kind of striking.)
In terms of results, 12 lbs isn’t nothing. But over 147 days, it’s only about 0.08 lbs lost per day. That’s not very much.
I take this as evidence in favor of the hypothesis that high doses of potassium are part of why the potato diet causes weight loss. Even on only 6,600 mg/day K, I experienced many of the effects of the potato diet (reduced appetite, weird anxiety) and I did lose some weight, though not much.
But I also think my results suggest that potassium may not be enough, and that the “potato weight loss effect” really comes from something like high doses of potassium plus something else in potatoes / with potatoes—maybe high doses of magnesium, maybe sufficient sodium to balance the potassium, etc.
Potatoes & Dairy
The brine seemed to work, but my rate of weight loss was really slow. It seemed like it was time to try the potato diet. In addition to hopefully losing more weight, I saw two benefits.
First, I could compare the effect of the brine directly to the effect of the potato diet, to see if I was already losing weight as fast as I could, or if there was something missing from the formula.
Second, I could test out the success of Potatoes + Dairy. The original potato diet was very strict, but by this point you had already reported a few case studies where people had lost a lot of weight on versions of the potato diet where they also ate various kinds of dairy.
My version of Potatoes + Dairy was decadent. Every meal was potatoes, but I always added as much butter, cheese, and sour cream as I wanted, which was usually a lot. For a while I made a lot of scalloped potatoes, but eventually I got lazy and from that point on I mostly ate baked potatoes or turned old baked potatoes into homefries. I didn’t get tired of this because butter is great.
When I didn’t have time to prepare potatoes, I would have cheese, milk, or ice cream as a snack. Yes, I ate as much ice cream as I wanted, and still lost weight (which is in line with the literature).
In case anyone wants to replicate my approach, my mainstays were:
Kerrygold salted butter, or occasionally Cabot salted butter
Cabot sour cream
Cabot cheeses, especially Cabot Seriously Sharp Cheddar Cheese
Ben & Jerry’s Ice Cream, most often Peanut Butter Cup
Despite this decadence, I lost about 40 lbs more over 187 days.
Looking closer, the weight loss really happened over two spans, one before the 2024 December holidays, and one after. I first lost about 16 lbs over 75 days, gained about 8 of that back during late December and January, then lost about 28 lbs over the next 86 days. At the point of greatest descent (early March 2025), I lost 10 lbs in two weeks.
I wasn’t very strict and I did cheat pretty often. My notes mention times and places that I had pizza, candy, or sometimes burritos. Sometimes I had cheat meals where I would go out to lunch or get hot pot with friends. Sometimes I went on dates, where I ate normal food. This mostly didn’t make a difference as long as I also kept up with the potatoes.
You might think that potatoes are a neutral food, and they just help you survive while your body returns to normal, or something. But my sense is that potatoes actively cause the weight loss. On days where I didn’t prepare potatoes, and mostly just snacked on ice cream and cheese, I didn’t seem to gain much weight back, but I didn’t lose it, either.
This leads to another counterintuitive recommendation: the potato diet can really reduce your appetite, sometimes to the point where you don’t want to eat. But I think that you actually lose more weight on days where you eat potatoes than on days where you don’t eat at all. So if your goal is to lose weight, don’t assume that not eating is a good strategy—eat your taters.
I’m pretty confident that the potato diet was causing the weight loss, in part because I started losing weight right when I switched from brine to potatoes. Also, when I cheated for more than just a meal or two, it was obvious on the graph. Halloween, Thanksgiving week, and the December Holidays stand out in particular. Here’s version of the graph with those days singled out:
My holiday weight re-gain continued well into January because I was travelling and helping to organize some professional conferences, and I wasn’t able to keep up with the potatoes very well. As soon as I got back on potatoes around Jan 20, my weight started dropping again, this time faster than before.
I was pretty surprised when I blew past not only 220 lbs, but 210 lbs. I had thought that 220-210 might be the healthy range for me, and expected the diet to stall out there. But instead I blew past those milestones. Turns out that 220 lbs is at least 20 lbs overweight for me. I had no idea, because I felt pretty healthy at 220, but I guess I had forgotten what it was like to be a normal weight.
Run-Out
I first dropped below 200 lbs on March 20, 2025. Soon after that, my weight started to plateau, never falling much below 200 lbs but showing no signs of increasing.
I also noticed that I suddently started craving foods that weren’t potatoes, something that I hadn’t experienced on the previous 170 days. First I started craving fruit, and the next day, I started seriously craving Mexican food. Soon I was craving broccoli and chocolate.
This made me think that I might have reached a plateau, possibly my “natural” weight. According to BMI I am still “overweight” at < 200 lbs, and I am definitely not “lean”. But I do feel trim, and the girl I’ve been dating keeps putting her hands on my chest and talking about how good I look, so I’ll take this as some evidence that “just under 200 lbs” is a reasonable weight for me.
Because I already seemed to have hit a plateau, I decided to spend the last 31 days on a run-out period to see what would happen as I eased off the diet. During this time I still ate potatoes pretty often, but I started bringing in other foods, and I went whole days without eating any potatoes at all. Somewhat surprisingly, I didn’t gain back the weight as I relaxed the diet.
I do kind of wonder if my weight would have fallen even further if I had remained on Potatoes + Dairy, but the fact that I was developing cravings for other food suggests to me that I had encountered a real state change. It might have been possible to force my weight lower, but the magic of the potato diet is that the weight loss happens without any force. If you start forcing things, you’re back in the territory of restriction diets.
I officially ended the experiment on May 12, 2025, 365 days after I started, weighing 198.8 lbs. This was down from an original high of 247.6 lbs, and my all-time low was 194.4 lbs on April 22nd.
I’ll probably keep eating a diet high in potatoes, since even after several months, I still love them very much (and you wouldn’t believe how much I’ve saved in groceries). But I seem to have reached a plateau and a healthy weight, and also, while potatoes are powerful, they come at a terrible cost (mostly joking but read on).
A Few Things People Should Know
Hair Loss
When you lose a lot of weight very quickly, you often lose some hair. I’d never heard of this before but apparently it’s common knowledge among women. Who knew? It’s called “telogen effluvium” and it definitely happened to me. In early January, after my first period of intense Potato + Dairy weight loss, I noticed my hair was seriously thinning on top and in the back.
The good news is that hair lost in this way usually grows back on its own, though it can take a couple of months. That seems to be happening for me too. My hair is clearly thicker now than it was in January. And it’s pretty weird: looking at my scalp, I can see short hairs and even some very short hairs mixed in among the long ones. While my head hasn’t returned to normal yet, the hair is clearly growing back.
So in the end this doesn’t seem to be a serious concern. And it’s not specific to the potato diet, this just happens when you lose weight really fast. Even so, anyone who wants to copy my results should be aware that this might happen, but also that it’s usually temporary.
Emotional Effects
Some people get really intense negative feelings of fear or anxiety while on the potato diet. This also happened to me.
To anyone who wants to do this diet, or is considering it after the benefits I described above: I encourage you to do it, but please be extra cautious that your mental state might be altered and that you are not necessarily in your right mind. The feelings you experience during this diet may not be how you actually feel.
Like I said above, potato diet is fucking weird. I mention this and the above because towards the end of the third week, I found myself crying every day. I was having actual meltdowns… five days in a row.
I am not talking “oh I am so sad, let a single tear roll down my cheek while I stare out of a window on a rainy day” levels of gloom and general depression. I am talking “at one point I couldn’t fold some of my laundry in a way that was acceptable to me, and this made me think I should kill myself, so I started crying”.
Is this a really dark to drop in the middle of a sort of lighthearted post about potato diet? Yes. I am sorry if you are uncomfortable reading it. Personally, I think I have a responsibility to talk about it, because the mentally weird aspect of this diet cannot be stressed enough.
My experience was somewhat different from Birb’s, manifesting more as a sense of overwhelming dread or doom than as a feeling of depression. And unlike Birb, I didn’t start to seriously feel this way until several months into the diet. But I definitely recognize her description.
As far as I could tell, these feelings were somewhat related to how quickly I was losing weight, though maybe not in the way you expect. The faster I was losing weight, the more of an overwhelming sense of doom I felt. Hooray. That said, it wasn’t a very strong relationship. I still felt the doom during times when I was cheating on the diet, and even when I was losing a lot of weight, I sometimes felt ok.
I suspect that these feelings may have something to do with how the body uses epinephrine and norepinephrine to release energy from adipose tissue, which would explain why you feel so crazy anxious and such intense dread when actively losing the most weight, but I’m not a doctor™.
The feelings might also be the result of a vitamin or mineral deficiency. We know that the potato diet is deficient in Vitamin A, and while I wasn’t rigorous about testing this, I found that eating some sweet potatoes (high in vitamin A) often made me feel better. I also found during the run-out period that eating mushrooms (selenium?), broccoli, and spinach (iron?) maybe helped as well. So if you’re having a bad emotional time on the potato diet, think about trying sweet potatoes or one of these other foods.
It’s interesting to me that these feelings of doom got stronger the further along I got in my weight loss. Maybe this is just because I was losing weight faster over time. But another (kind of crazy) possibility is that something is stored in our fat reserves and as I dug deeper into them, I released more of it. Or in general that something is flushed out from somewhere? I don’t know if I believe this but I wanted to mention it.
That’s just my speculation. It could also have been ordinary anxiety from other causes that happened to line up with the weight loss. I’ve got some personal things going on in my life right now, maybe the anxiety is coming from those. Plus, a few friends have recently had similar feelings of dread, and they’re not losing extreme amounts of weight on a highly unusual diet.
Conclusions
My results make me very confident that Potatoes + Dairy works. The potato diet makes you lose weight, and that still works even if you add dairy, including butter and ice cream, no matter if you’re eating as much of it as you want.
While my data can’t speak to how well Potatoes + Dairy will work for anyone else, I hope this ends the idea that the potato diet works because it’s unpalatable. I lost 50 lbs and every meal was delicious. I also hope this finishes the idea that the potato diet works because it’s a “mono diet”. You can’t reasonably call something a mono diet when it includes potatoes, sour cream, and ice cream with tiny peanut butter cups.
I also think this is some evidence for the potassium hypothesis. I lost weight when I was taking high doses of potassium, though not nearly as much as on the potato diet. Maybe this was because I was taking too small of a dose, and a higher dose would have caused a similar amount of weight loss as what I eventually saw on the potato diet.
But I suspect this is because the potato effect doesn’t come from potassium alone, but from an interaction between potassium and something else, possibly other electrolytes like sodium and magnesium.
If you could find the right mixture, maybe you could reproduce the potato effect in a brine. But if so, I wasn’t able to find it. For now, the state of the art is Potatoes + Dairy.
The riff trial is a new type of study design. In most studies, all participants sign up for the same protocol, or for a small number of similar conditions. But in a riff trial, you start with a base protocol, and every participant follows their own variation. Everyone tests a different version of the original protocol, and you see what happens.
As the first test of this new design, we decided to riff on one of our previous studies: the potato diet. For many people, eating a diet of nothing but potatoes (or almost nothing but potatoes) causes quick, effortless weight loss, 10.6 lbs on average. It’s not a matter of white-knuckling through a boring diet — people eat as much (potato) as they want, and at the end of a month of spuds, they say things like, “I was quite surprised that I didn’t get tired of potatoes. I still love them, maybe even more so than usual?!”
Why the hell does this happen? Well, there are many theories. The hope was that running a riff trial would help get a sense of which theories are plausible, try to find some boundary conditions, or just more randomly explore the diet-space. We thought it might also help us figure out if there are factors that slow, stop, or perhaps even accelerate the rate of weight loss we saw on the full potato diet.
In the first two months after launching the riff trial, we heard back from ten riffs. Those results are described in the First Potato Riffs Report. Generally speaking, we learned that Potatoes + Dairy seems to work just fine, at least for some people, and we saw more evidence against the idea that the potato diet works because you are eating only one thing (people still lost weight eating more than one thing), or because the diet is very bland (it isn’t).
Between January 5th and March 18th, 2024, we heard back from an additional seventeen riffs. Those results are described in the Second Potato Riffs Report. Generally speaking, we learned that Potatoes + Dairy still seems to work just fine. Adding other vegetables may have slowed progress, and the protein results were mixed. However, the Potatoes + Skittles riff was an enormous success.
Between March 18th and October 9th, 2024, we heard back from an additional eleven riffs. Those results are described in the Third Potato Riffs Report. Generally speaking, we saw continued support for Potatoes + Dairy.
The trial is closed, but since the last report, we’ve heard back from an additional two riffs, which we will report in a moment. This gives us a total of 40 riffs in this riff trial. Note that this is not the same as 40 participants, since some people reported multiple riffs, and a few riffs were pairs of participants.
Participant 87259648 did a Fried Potatoes riff, specifically, “mostly fried in a mix of coconut oil and tallow or lard” and continuing her “normal daily coffees with raw whole milk, heavy cream, honey and white sugar.”
Despite consuming only “around 30 percent potato on average”, she lost a small amount of weight and “found [the] diet to be easy and enjoyable, I never felt sick of potato although I did have a hard time getting myself to eat MORE potato each day.”
Participant 80826704 was formerly participant 41470698, but asked for a new number to do a new kind of riff. In Riff Trial Report Two, he had done Potatoes + Eggs as participant 41470698 and lost almost no weight. This time, he did a full potato diet and lost a lot of weight, more than 13 lbs:
Mean weight change was 6.4 lbs lost, with the most gained being 5.2 lbs and the most lost being two people who both lost 19.8 lbs. One person gained weight, one person saw no change, one person reported no data, and the rest lost weight. One person also gained 6.3 lbs on “Whole Foods” + Chocolate, but this was not a potato diet (only about 10% of her diet was potatoes).
Here are all the completed riffs, plotted by the amount of weight change and sorted into very rough riff categories:
There are also a large number of people who signed up, but never reported closing their riff. We’re not going to analyze them at this point, but all signup data is available on the OSF if you want to take a look at the demographics.
Things we Learned about the Potato Diet
The potato diet continues to be really robust. You can eat potatoes and ketchup, protein powder, or even skittles, and still lose more than 10 lbs in four weeks.
The main thing we learned is that Potatoes + Dairy works almost as well as the normal potato diet. There were many variations, but looking at the 10 cases that did exclusively potatoes and dairy, the average weight lost on these riffs was 9.2 lbs. This is pretty comparable to the 10.6 lbs lost on the standard potato diet, suggesting that Potatoes + Dairy is almost as good as potatoes by themselves (though probably not better).
We didn’t see much evidence that there might be a protocol more effective than the potato diet. This is sad, because it would have been really funny if Potatoes + Skittles turned out to be super effective.
That said, three riffs did do unusually well, and it’s still possible that there is some super-potato-diet that causes more weight loss than potatoes on their own, or that’s better in some other way.
There’s some evidence that meat, oil, vegetables, and especially eggs make the potato diet less effective. But with such a small sample, it’s hard to know for sure. This could be a productive direction for future research. You could organize it as an RCT, and compare a Just-Potato condition to a Potato + Other Thing condition. Or an individual could test this by first doing a potato diet with one of these extra ingredients for a few weeks, then removing the extra ingredient and doing a standard potato diet for a few weeks as comparison.
The strongest evidence is against eggs, because participant 41470698 / 80826704 did exactly that. First he did a Potatoes + Eggs riff and lost only 1.8 lbs. Then he did a standard potato diet and lost 13.2 lbs. That’s not proof positive, but it’s a pretty stark comparison. If that happens in general, it would be hard not to conclude that eggs stop potatoes from working their weight-loss wonders.
Current Potato Recommendation
If you want to try the potato diet for weight loss, our current recommendation is this funnel:
Start by getting about 50% of your diet from potatoes and see how well that works.
If you want to be more aggressive, switch to Potatoes + Dairy. Try to get at least 95% of your diet each day from potatoes and dairy products, but don’t worry about small amounts of cheating.
If you want to be more aggressive, switch to the original potato diet. Try to get at least 95% of your diet each day from potatoes, but don’t worry about small amounts of cheating.
If you want to be more aggressive, switch to a strict potato diet. Try to get almost 100% of your calories each day from potatoes, allowing for a small amount of cooking oil or butter, salt, hot sauce, spices, and no-calorie foods like coffee.
If dairy doesn’t work for you for some reason (like you’re a vegan, or you just hate milk), consider replacing Step 2 with a different riff that showed good results, like Potatoes + Lentils or Potatoes + Skittles.
Remember to get vitamin A. Mixing in some sweet potatoes is a good idea for this reason.
Remember to get plenty of water. Thirst can feel different on the potato diet, you will need to drink more water than you expect.
Remember to eat! In potato mode, hunger signals often feel different. But if you don’t eat you will start to feel terrible, even if you don’t feel hungry. If anything, eating a good amount of potatoes each day may make you lose weight faster than you would skipping meals.
If the potato diet makes you miserable, try the three steps above. If you try those three steps and you’re still miserable, stop the diet.
Things we Learned about Doing Riff Trials
This is the first-ever riff trial. But it won’t be the last. So for the next time someone does one of these, here’s what we’ve learned about how to do them right.
#1: It Works
We hoped that riff trials would use the power of parallel search to quickly explore the boundary conditions of the base protocol, and discover what might make it work better or worse.
This works. We had suspected that dairy might stop the potato effect, but we quickly learned that we were wrong. We saw that the potato effect is also sometimes robust to lots of other foods, like skittles. And we saw that other foods, like eggs and meat, seem like they might interfere with the weight-loss effect.
#2: You May Have to Encourage Diversity
That said, there was not as much diversity in the riffs as we might have hoped.
Most people signed up for some version of Potatoes + Dairy. This was great because it provided a lot of evidence that Potatoes + Dairy works, and works pretty damn well. But it was not great for the riff trial’s ability to explore the greater space of possible riffs.
In future riff trials, the organizers should think about what they can do to encourage people to sign up for different kinds of riffs. If you don’t, there’s a good chance you’ll find that most of your scouting parties went off in the same direction, and that’s not ideal if you want to really explore the landscape.
One way to do this would be to run a riff trial with multiple rounds. First, you have a small number of people sign up and complete their riffs. Then, you take some of the most interesting riffs from the first round and encourage people to sign up to riff off of those. You could even do three or four rounds.
In fact, this is kind of what we did. Since we reported the results in waves, and had rolling signups, some people were definitely inspired to try things like Potatoes + Dairy or Potatoes + Lentils because of what they saw from completed riffs. But we could have done this even more explicitly, and that might be a good idea in the future.
#3: Riff Trials Harness Cultural Evolution
There’s no formal skincare riff trial. But it does kind of exist anyway. People get interested in skincare, and go look at other people’s routines. They copy the routines they like, but usually with some modifications. This is all it takes for skincare protocols to mutate, combine, and spread through the population, getting better and better over time.
The same is true of any protocol floating out there in the culture, including the potato diet itself. Even if we hadn’t run the riff trial, people would have experimented with potato diets for the next 10 or 20 years, trying new variations and learning new things about the diet-space. But this process would have been slow, and it would have been hard to tell what we were learning, because the results would have been spread out over time and space.
The fact that we planted our flag and ran this as a riff trial didn’t change the nature of this exploration. But making it one study, clearly marking out its existence, definitely sped things up, and helps make all the riffs easier to compare and interpret.
87259648 – Fried Potatoes
Riff
Potatoes, mostly fried in a mix of coconut oil and tallow or lard. I will continue with my normal daily coffees with raw whole milk, heavy cream, honey and white sugar. Maybe occasional fruit on cheat days but mostly just potatoes, dairy, coconut oil, tallow, coffee and honey/sugar. 28 days. My reasoning for choosing this is that fried potatoes are delicious, i really don’t want to give up my coffee routine, or waste the raw milk that i get through a cow share, and anecdotally, coconut oil and stearic acid have both been reported to help with weight loss.
Report
So I didn’t lose a lot of weight, but I definitely lost somewhere between 3 – 6.5 lbs (hard to tell due to fluctuations in water weight) and an inch off my waist despite doing a pretty relaxed version of the diet.
What I ended up doing was a diet of around 30 percent potato on average (even though I only ate potatoes for dinner and “grazed” on smallish things throughout the rest of the day, it was hard for me to get past around 30 percent potato calorie-wise). The rest of my diet was mostly dairy (raw milk, heavy cream, sour cream, butter, cheese and occasional ice cream), fruit, sugar (and sugary drinks), honey, chocolate and saturated fats (coconut oil and beef tallow).
I rarely boiled the potatoes so the potato portion of the diet was mainly peeled yellow or red potatoes pan-fried in a mixture of tallow and coconut oil, baked russet potatoes with the skins, or roasted red and yellow baby potatoes with the skins.
I occasionally supplemented extra potassium, as well as other supplements. Around day 5 I started drinking coconut water in order to get extra potassium.
I found this diet to be easy and enjoyable, I never felt sick of potato although I did have a hard time getting myself to eat MORE potato each day. The skins didn’t seem to bother me. Something about the diet definitely seemed to have an appetite lowering effect, although my appetite did fluctuate from day to day. I never intentionally cut calories or deprived myself of anything I really wanted. So even on the very low calorie days I ate as much as I felt like eating that day. (i am used to doing extended fasts so this is not super unusual for me, but I DO think that the extra potassium or something DID result in more days than usual where I didn’t feel like eating as much).
I didn’t exercise any more or less than I usually do.
My husband and another male family member did even less strict versions of the diet along with me (potatoes for dinner, whatever else they wanted the rest of the day) and they both seemed to lose more weight than I did, but they didn’t keep track of any data. I’m a 49 year old female, the other two men are 49 and 66. In the last couple years it has gotten much harder for me to lose weight, and I have been pretty fatigued in general. I didn’t notice any extra energy on this diet, but appetite did often seem suppressed.
I didn’t observe any noteworthy reduction in pulse or body temperature over the course of the diet. Three weeks after finishing the diet I have not been able to keep the weight off and am back up to 190.
I kept track of everything in the Cronometer app, so if you have any questions I can access some data that’s even more specific from there, let me know!
80826704 – Only Potatoes
Riff
Formerly participant 41470698, who asked for a new number: “I would like to try the full potato diet at some point during 2024. Could you prepare a new Google Sheet for me for this purpose?”
Report
I completed the potato only version in August, but neglected to send you a report. Happy to report that I’ve completed it and filled the 4 week sheet.
In terms of feeling it was very similar to my riff experiment. In terms of results this has been completely different. One thing I am now throughly convinced about is the “ad libitum” part. I am hungry, I eat. It’s so simple it’s scandalous, but it’s been buried under years of well meant status quo advice.
From that point it simply matters which food types I eat. Even if the lithium hypothesis turns out wrong, this part I am thoroughly convinced about now.
Difficulty
In a way this was easier than potatoes + eggs. One reason I remember for this was the forced pre-planning. Because I knew I was going to eat only potatoes I generally tried to peel way more potatoes than I was hungry for. Because of this, for the next meal I would have potatoes already lying around. I could then eat those as-is, or more tasty, (re-)baking them in a frying pan.
Somehow I had less inclination to cheat.
I’ve also gone to McDonalds like 6 times, ordering only fries without sauce. And a lot of fries from a Snackbar (https://nl.wikipedia.org/wiki/Snackbar). It’s super convenient when going by train to just order a big portion of fries without sauce.
Fun stuff
Potatoes are fucking delicious by the way. I’ve taken to eating them without sauce, because now it just feels like potatoes with sauce taste like sauce. And then I’m missing the potato flavor. Maillard reaction for the win.
With a group of friends I did a “potato tasting”. I bought 8 breeds of potatoes and cooked them with the oven or boiled. So we tasted 16 different kinds. People were truly surprised by the amount of variation.
My surprise was mostly about how difficult the different breeds were to peel. Some potatoes are truly monsters.
Krinn also added an exercise habit that she described as a “naïve just-hit-the-treadmill exercise regimen”. Even with this in mind, her results still seem remarkable, because most people do not lose 50 lbs from starting a moderate treadmill habit:
We published a short review of that original post on this here blog of ours. That was in July 2023. Now, Krinn is back, and more powerful than ever, with an untitled post we’ll call A Year And Change After The Long Post About The Potassium Experiment (AYACATLPATPE).
The long and short of it is that Krinn kept taking high doses of potassium and kept losing weight, eventually reaching her goal of 200 lbs. There was a long plateau in the middle after she first brushed up against her goal, but she maintained the original weight loss and eventually lost the remaining weight:
In personal communication (see very bottom of this post), Krinn noted that:
One of the few things the graphs say really, really, really loudly is “Krinn lost 30+ pounds _and stayed that way for at least a year._” … one of the overwhelmingly common failure modes of existing interventions: people lose some weight and then gain some weight and end up fairly close to where they started. Whatever else happened in my experiment, it sure wasn’t that: I lost a significant amount of weight and then _stabilized._ That seems important.
This time we don’t have much to add, but as before we wanted to reproduce her post for posterity. And we do have a few thoughts, mainly:
This seems like more evidence that high doses of potassium cause weight loss. It suggests that potassium is probably one of the active ingredients, maybe the only active ingredient, in the weight loss caused by the potato diet. Krinn was taking about as much potassium as you would get if you were eating 2000 calories of potatoes per day, and experienced similar weight loss.
It’s good to be skeptical of single case studies, however rigorous and careful they may be, but here are a few things to keep in mind:
Remember that participants in the Low-Dose Potassium Community Trial lost a small but statistically significant amount of weight (p = .014) on a dose much lower than what Krinn was taking — only about 2,000 mg of potassium a day on average, compared to Krinn’s ~10,000 mg per day. This can’t confirm the effects of the higher dose, but it is consistent with Krinn’s results, and the final sample size was 104 people.
There’s also at least one successful replication. Inspired by Krinn’s first report, Alex Chernavsky did a shorter potassium self-experiment and lost about 4 pounds over a two-month period, otherwise keeping his diet and exercise constant. He also provided this handy table:
Finally, we know of two other people who are losing weight on high-potassium brines, at least one of them without any additional exercise. They’re both interested in publishing their results, probably in early 2025. So watch this space. :)
As before, we want to conclude by saying that Krinn is a hero and a pioneer. She is worth a hundred of the book-swallowers who can only comment and couldn’t collect a data point to save their life. If you want to do anything remotely like what Krinn did, please feel free to reach out, we’d be happy to help.
Here’s a reproduction of Krinn’s full report as it appears in her tumblr post:
A Year And Change After The Long Post About The Potassium Experiment
A year and change after the long post about the potassium experiment, I reached my weight-loss goal. This is a quick, minimally-structured thought-dump about it. As before, this is part of a wider conversation that starts with A Chemical Hunger.
Methodology: I mostly kept doing what I’d been doing. Turned up the exercise dial a bit, turned down the potassium dial a bit. Both still, AIUI, quite high compared to American baseline. Some bad news — in addition to whatever confounding factors were present last time, there’s a few extra ones now from my life in general going very poorly. As before, here’s the data, Creative Commons Zero, good luck with whatever you try on it. After making it to one year of being fairly diligent, I decided to let things vary and see what happened — on the one hand, I’d gotten far enough towards my personal goal that I wasn’t too fussed about the last 10%, and on the other hand, if this works in general and even work when you’re kinda half-assing it, that too is great news.
Interpretations: There’s multiple ways this could go. Here are a few that were easy to think of.
Potassium or potassium-plus-exercise caused me to lose weight
Exercise caused me to lose weight and potassium was irrelevant
Something else caused me to lose weight
I would prefer to believe that potassium-plus-exercise caused me to lose weight. The data I have and my experience of gathering/being that data, to some extent support that conclusion. Flipping that around, if I ask “does that data rule out this conclusion?” no it absolutely does not. But it’s important to note that the exercise-only conclusion is only slightly less-well-supported and the none-of-the-above explanation is much-less-well-supported but certainly not ruled out. I have a preferred explanation, but all three of these explanations are live.
My subjective experience of the thing was that there was an easy part and a hard part. In the easy part I lost weight at a pretty rapid and consistent pace. In the hard part, my weight changed less and went back and forth more than it went down. If you buy into SMTM’s “something is screwing up people’s lipostats” theory, this is very consistent with that theory: potassium reduced or removed the something, my weight briskly dropped back to a healthy range (the first 9 months of the graphs) and then stabilized. However, the competing theory of “Krinn was super out of shape and then she started exercising” is also supported by the graphs (not shown on the graphs: my fairly poor 2022 exercise habits — my long-term exercise habits have had some good stretches, but the plague years did not do good things for me there!). I’m not sure whether it matters that I shifted from mostly treadmill time to having a couple of walks around the neighborhood that I can do pretty much on autopilot (shout-out to Mike Duncan’s Revolutions, this show is the first time podcast as a medium has clicked for me and it’s a great show). I do think, though, that exercise is a bit more complicated than I was really grasping. That, in turn, makes me glad that I’m tracking three exercise metrics rather than just one — if I was going to track only one, it’d be exertion, but exertion, exercise minutes, and step count, together make it possible to at least take a guess at what qualities a day’s exercise had.
Regarding my own questions from the first post:
• How safe is this? When I made the first post I was antsy about “adding this much potassium to your diet is probably safe for people in generally good health” but now I’m pretty sure it’s true. Some health problems can take a long time to present themselves, but adding this much of something to your diet for two years and having it be fine, is pretty persuasive evidence that the thing is probably fine. It could still easily turn out to have negative health impacts that are important, but a huge swath of the things you’d be worried about, are vanishingly unlikely once you’ve hit the point of “I’ve been taking this for two years and I’m fine.”
• Does this replicate? Well, it’s self-consistent for me, and I don’t want to gain 50 pounds and try again. I did not like the shape of my body at +50 pounds from where I am now! So this is a question for others.
• How much do other nutrients matter? I don’t know. Mostly not equipped to rigorously check.
• Does HRT matter? I’ll let you know if I can get back on HRT. I would definitely like to investigate this.
• Does dieting matter? Probably: my diet changed involuntarily over the course of two years and that certainly matters to some extent, but one of my ground rules is that I’m focusing on controlling exercise and potassium, the things I can control. Diet is far more complex and also in my life particularly, more susceptible to unplanned, involuntary change, so I’m writing it off as a factor.
• Does this help with cannabis-induced hunger? I think I was off-base/over-optimistic with this one and it either doesn’t matter or matters a small amount.
• Is there a point where I get really hungry/tired or start accidentally starving? I did not reach such a point. I felt basically fine the whole time.
I was cooking with this though:
If you tell someone you want to lose weight and would like their advice, it is overwhelmingly likely that the advice will involve exercising more. Everyone has heard this advice. And yet, as Michael Hobbes observes in a searing piece for Highline, “many ‘failed’ obesity interventions are successful eat-healthier-and-exercise-more interventions” that simply didn’t result in weight loss. Even if we as a society choose to believe “more exercise always leads to weight loss, most people just fuck up at it,” that immediately confronts us with the important question, why do they fuck up at it? and its equally urgent sibling, what can we learn from those who succeed at it to give a hand up to those who have not yet succeeded?
Conclusion: I’m gonna keep writing things down in my spreadsheet for the same reasons as last time. I’m not sure what exactly I’m going to do as far as twiddling the factors, because now my main goal is somewhere between “don’t gain weight again” and “see what happens,” but I do know that writing down what happens is Good Actually, so I’m going to keep doing that.
Slightly after publication, Krinn sent us these comments, which she agreed we could publish:
Personal Communication
Dangit now I’m having the first draft effect: writing the first draft and sleeping on it tells me things I should have written. In this case, I think there’s a plausible reading that my experience supports the “potassium does something good at a high enough effect size to care about” line of argument because while the peaks of how much effort I put in were fairly high — the periods of combined high exercise and high potassium intake — the most noticeable effect was when I was ramping up on both of those in the first 9 months, and when I was in just-bumbling-through-like-an-average-human mode, the effect didn’t reverse itself. There were plateau periods and there were slow-reversion periods, but there was definitely no “you slacked off and now there’s rapid weight gain mirroring the rapid weight loss” effect. I think that’s positive? I think it’s plausible to read it as “once I got the majority of the weight loss effect, locking in that benefit was easy.”
In any case one of the questions I was interested in was “if this works, does it work well enough that an average person can successfully implement it?” and I am now convinced that that’s a clear “Yes”.
I wouldn’t say there’s any part of this experiment that I’m actively unhappy about, but I do find it a little frustrating that this is basically just another piece of evidence on the pile of “here’s something that is consistent with the lithium/potassium hypothesis, but that is also consistent with some other stuff, and my main observation is that Something Happened” — intellectually I feel sure that much solid science is built by assembling big enough piles of such evidence and then distilling it into “now we know Why Something Happened,” but putting one single bit of evidence on the pile is still something where I need to make my own satisfaction about it rather than having a well-established cultural narrative rushing to bring me “yes! you did the thing! Woohoo!”
Also thinking more about the potassium experiment I’m having one of those “hold on a minute, this should have been obvious to me” moments — one of the few things the graphs say really, really, really loudly is “Krinn lost 30+ pounds and stayed that way for at least a year.” That’s one of the crucial parts of the whole obesity thing, that second half, right? That’s one of the overwhelmingly common failure modes of existing intervention: people lose some weight and then gain some weight and end up fairly close to where they started. Whatever else happened in my experiment, it sure wasn’t that: I lost a significant amount of weight and then stabilized. That seems important.
Yessssss I get the smug clever-kitty feeling, this is exactly why I have that “ratchet” column in the spreadsheet: the last ratchet-tick day from more than a year ago (i.e. it’s locked in) was July 10th 2023, on which day my week-average weight was 212.4lbs, down 33.6lbs from the start of the year.
So that early period of dramatic weight loss is noteworthy because we can be confident that whatever the cause was — potassium, exercise, or something else — it caused durable weight loss, which is exactly the thing we are looking for.
This is a conclusion we couldn’t have reached in July 2023, with the major writeup I did, because at that point “something else happens and Krinn gains the weight back” was very possible, was one of the likely answers to “what comes next?”
For many people, eating a diet of nothing but potatoes (or almost nothing but potatoes) causes quick, effortless weight loss. It’s not a matter of white-knuckling through a boring diet — people eat as much (potato) as they want, and at the end of a month of spuds they say things like, “I was quite surprised that I didn’t get tired of potatoes. I still love them, maybe even more so than usual?!” And some people lose a similar amount even when eating only 50% potato.
Why the hell does this happen? Well, there are many theories. To help get a sense of which theories are plausible, try to find some boundary conditions, or just more randomly explore the diet-space, we decided to run a Potato Diet Riff Trial.
In this study, people volunteer to try different variations on the potato diet for at least one month and let us know how it goes. For example, they might eat nothing but potatoes and always cook their potatoes in olive oil. Or they might eat nothing but potatoes and leafy greens. Or they might eat nothing but potatoes but always eat their potatoes with ketchup.
The hope is that this will help us figure out if there are other factors that slow, stop, or perhaps even accelerate the rate of weight loss we saw on the full potato diet. This will get us closer to figuring out why potatoes cause weight loss in the first place, and might get us closer to curing obesity. We might also discover a new version of the diet that is easier to stick to, or causes more weight loss, or both.
In the first two months after launching the riff trial, we heard back from ten riffs. Those results are described in the First Potato Riffs Report. Generally speaking, we learned that Potatoes + Dairy seems to work just fine, at least for some people, and we saw more evidence against the mono-diet and palatability hypotheses.
Between January 5th and March 18th, 2024, we heard back from an additional seventeen riffs. Those results are described in the Second Potato Riffs Report. Generally speaking, we learned that Potatoes + Dairy still seems to work just fine. Adding other vegetables may have slowed progress, and the protein results were mixed. However, the Potatoes + Skittles riff was an enormous success.
Since then, we’ve heard back from 11 new riffs. (Specifically, these are the riffs we heard back from between March 18th and October 9th, 2024.)
A few riffs are ongoing, but signups have slowed to a crawl. So while there may be a few more riff trial results in your future, signups are now closed. We may do more potato diet studies in the future, perhaps even another riff trial, but we are going to wrap this one up for now. Expect a final riffs retrospective around January 2025.
But let’s see what we’ve learned so far. First we’ll review the overall results, and talk about our interpretation. Then, at the end we’ve included the actual riff proposals and reports from all 11 participants in an appendix, if you want to read about them in more detail.
Unless otherwise indicated, weight loss numbers are over a period of about 28 days, comparable to the original Potato Diet Community Trial.
Potatoes + Dairy
Participant 07566174 ate “Potato plus a bit of dairy, ice cream for a treat”. At the end they said, “overall very successful despite rampant cheating!” and you know what, that’s entirely right:
In this case, cheating wasn’t “take a day-long break from eating potatoes”, instead it meant more like “ate less than 100% potato”. For example, one cheat day entry said: “Had some cake, and a couple chocolates. Otherwise, potato. Plus a beer instead of ice cream.”
This participant actually gave us six weeks of data, here is the longer chart:
Participant 28818306 took to the true spirit of the riffs trials, “trying to combine what looks like working riffs (potatoes + dairy + lentils)” along with adding “some lettuce to the mix to see if it keeps working”.
This worked ok. “It went well in the first 2 weeks,” 28818306 reported, “the other 2 were kind of slow, and harder to follow.”
Participant 92679541 did a riff of potatoes + oil + dairy (mainly cream and butter), with a more casual protocol and cheating most days, but had to stop the diet early. Despite all this, he lost a couple of pounds:
Participant 97027526 did a riff starting with potatoes plus butter, ghee and spices, and added raclette cheese after a few days.
Chalk another one up for the potato diet making people fall even deeper in love with potatoes: “I discovered I LOVE baked potatoes (first cooked in the microwave then finished off in the oven to crispen them up) and over 70% of my potatoes were cooked like that. … I am surprised that after four weeks I still really like potatoes! I’m going to continue with the potatoes for a while”.
She lost exactly 10 pounds over 28 days:
We then later received an update, where she said, “I am almost at the end of 8 weeks and still going strong. … My diet now exclusively consists of baked potatoes, butter, salt (a few pinches once a day), pepper and sometimes garam masala. … I’m not nearly as hungry as I used to be.”
Between Day 1 and Day 53, she lost a total of 15.9 pounds:
Potatoes + Meats
Several people tried riffs that aimed for the most classic meat & potatoes.
50108266 and 20953986 are a husband and wife team who started with the plain potato diet then added organ-based meat. Their full protocol was a bit complicated, see the appendix for more detail.
The results: Two weeks of just potatoes, “lost weight, but hated it”. Two weeks of potatoes + organ meat, “lost less weight, enjoyed much more. We will keep going.” It’s interesting that such a small change could so strongly affect their perceived enjoyment of the diet, especially while not strongly affecting how quickly they lost weight.
54084282 said, “I feel a diet that I could stick to for 30 days would be potato, bacon, black coffee, and Guinness. The bacon would help supplement fat and protein missing from the potatoes and reduce the need for extra seasonings. The coffee and Guinness are mostly for personal preference.”
Thirty days later, we got this update: “I have modified from my original riff! I’d characterize my current plan as fermented food/drinks + potatoes, along with a serving or two of protein daily. It is resulting in steady weight loss while alleviating the bloating and unpleasant constipation feeling that I experienced initially. I have lost about 5 pounds this month while feeling generally satisfied and still surprisingly not tired of potatoes. Only real remaining issue is eating out. I just cannot bring myself to order only French fries for a meal (especially around the kids). I just cheat in those situations but still manage to steadily drop weight, lol.”
Checking the data now, we see that 54084282 kept recording data up to day 58, and continued the trend of losing weight:
83842317 says, “potato + meat (chicken, beef, pork, fish)”. Then after the diet, “The convenience of eating tater tots, hash browns, chips, fries, and meat has been very easy and I’ll be sticking to it”.
There was no weight entry for Day 29, so here’s 83842317’s data up to the last weight entry on Day 34:
Participant 22179922 did a riff she came to call “potatoes and cows”, starting with potatoes and ramping up to first include dairy and then include other animal products (see appendix for full details).
Chocolate-Style Riffs
Two people did riffs that sort of involved chocolate.
59960254 did something like “Potatoes with Fire in a Bottle Characteristics”, meaning potatoes and a small amount of fat from sources like butter, tallow, coconut, cacao, etc. and also including fruit, honey, dates, and dark chocolate. This lead to a weight loss of exactly 10 lbs by Day 29:
We actually have 12 weeks of data from this participant, here is the longer version. The fluctuations in the middle are a sad story that have little to do with the diet itself; his cat got sick around the three week mark.
95078099 followed a riff of “potato + soy products + chocolate”. Note that he started off quite lean, with a BMI of around 20, but that “this is the result of a long, hard calorie restriction. My personal aim is not to lose weight, but to keep the weight down. If I stay at the same weight, and not drift up by a few pounds, I’d consider that a success!” So in this case the question is not really whether 95078099 can lose weight on the potato diet, but whether he can maintain weight on the potato diet without calorie restriction.
Ultimately, 95078099 lost 1.5 lbs between the first and the last measurement over four weeks. But based on the moving average, he concludes, “for myself, and for the purpose of keeping my weight down, I’d consider my potato riff ineffective.” See the appendix for a lot more detail, including additional charts with several years of data.
Skittles Update
Previously, participant 22293376 tried a Potatoes + Skittles riff, and was “astonished at just how well it went.” Here are those original results:
This was in January 2024. By July, he had started gaining weight and decided to do a second run of the riff, with some minor changes. This time it was potatoes plus: butter, oil, sweet potatoes, “low-calorie vegetables (onions, peppers, broccoli, green chile, etc.)”, and “skittles (in moderation)”. And for this second round, the results look like this:
The y-axis is fixed to match 22293376’s previous graph.
22293376 says, “I generally didn’t eat more than 20-30 skittles a day, and sometimes none. I don’t really recommend eating skittles-only meals but you do you!” Also check out the appendix for more detail on this riff.
Interpretation
As before, Potatoes + Dairy seems to work for many people, and it seems quite resistant to cheating. Every Potatoes + Dairy riff in this roundup lost some weight, and some lost as much as 10 lbs.
People lost some weight on different versions of Potatoes + Meats, but this seems to be inconsistent. It’s possible that the kind of meat, or its origin, could make a difference.
“Potatoes with Fire in a Bottle Characteristics” worked quite well. While the sample size is only one, it’s a nice proof of concept. These various fats and sweets don’t seem to interfere at all with the potato effect, at least not for this participant.
It’s also wonderful to have a skittles replication. The results are still from the same person, which means we can’t be sure if it will work equally well for other people, but it’s nice to see that this can happen twice. And it’s certainly more evidence against the idea that the potato effect is purely the result of cutting out processed foods and sweets. If sweets were always a potato-effect-killer, they would have stopped the effect here. They didn’t, so they aren’t.
Of course, we’d love to see replications from other people too. So if you’ve been on the fence, consider trying potatoes + skittles.
If so, please let us know how it goes! But it will have to be your own self-experiment, because as mentioned above, signups for the riff trial are closed. Expect a final report and a retrospective some time around January 2025.
07566174 – Potato + Dairy (ice cream)
Riff
Potato plus a bit of dairy, ice cream for a treat
Report
Hello,
I’m emailing to share results after 6 ish weeks of potato diet. Overall very successful despite rampant cheating! I’ll be continuing for a few weeks more.
28818306 – Potatoes + Dairy + Lentils + Lettuce
Riff
I’m trying to combine what looks like working riffs (potatoes + dairy + lentils) and add some lettuce to the mix to see if it keeps working and makes it “healthier” (at least according to my wife :-))
Report
Hi just wanted to let you know that I ended the 4 week of the potato riff trial.
It went well in the first 2 weeks, the other 2 were kind of slow, and harder to follow.
My diet consisted of a lentils burrito for breakfast (lentils flat bread + cooked lentils as filling + cheese). A mix of baked potatoes + cheese during the rest of the day. I tried to keep it mostly potatoes and use cheese for variety or as a snack.
I usually cooked 2 big batches of potatoes every week and I reheated them on a pan with a bit of olive oil.
I happened to take a blood test at the end of the diet and notice a drop in a few markers.
I’ve attached 2 pdfs. One is the most recent and another was 6 months before for comparison.
You can use them in your posts if you anonymize them.
They were translated by AI but look ok
Cheers
92679541 – Potatoes + Oil + Dairy
Riff
My plan is potatoes + oil + dairy (mainly cream and butter)
Report
I’m stopping the diet early (after two weeks). I ended up doing a *very* loose protocol – basically potatoes + anything that would be fine on Keto (i.e. potatoes intended to be basically my only carb). As you can see from my entries, I cheated most days, typically with sweets, for which I experienced really wild cravings. I am down ~ a couple of pounds from my first weigh in.
97027526 – Potatoes plus butter, ghee, cheese, and spices
Riff
Not 100% decided yet! Perhaps potato + butter/ghee + spices or potato + butter/ghee + cheese + spices. Planning to do this with another person in my household. We intend to do this just for 4 weeks but if it is going really well and I don’t find it difficult I may continue for another few weeks
Report
Dear Slimemold Timemold team,
August:
I’ve just found the below updates in my drafts from months ago. Not sure if it’s still interesting, but I did eat the potatoes! I ended up going back to my normal diet and I am almost back to my starting weight now. Thinking of giving it another go in September.
February:
I saw your latest potato riffs article today and when I didn’t see my own results there I realised I forgot to send you the following email almost a month ago when I completed the four weeks… So here it is:
Note from the end of the first four weeks
I have completed the four weeks!
I initially planned to do potatoes plus butter, ghee and spices but ended up adding cheese after a few days. This added a bit of interest and I think made me more likely to comply with the diet. I am exclusively eating raclette cheese (a Swiss cheese normally eaten with potatoes). The first two or three days were a bit tough, but after that I had no problems. I discovered I LOVE baked potatoes (first cooked in the microwave then finished off in the oven to crispen them up) and over 70% of my potatoes were cooked like that. After reading about the increased resistant starch in cooled potatoes I decided to cook potatoes the day before. I only managed this sometimes so about 40%-50% of potatoes were pre-cooled. At the start of the diet I ate lots of spices on my potatoes (home ground garam masala and chili flakes) but as time goes on I find myself satisfied with butter and sometimes salt as flavourings.
I am surprised that after four weeks I still really like potatoes! I’m going to continue with the potatoes for a while (probably another 2 weeks maybe another 4) and will keep using the spreadsheet in case that’s useful.
Update from 21/03/2024
I am almost at the end of 8 weeks and still going strong. I have removed the cheese because I suspected it was behind some bowl complaints. No complaints since I stopped the cheese. My diet now exclusively consists of baked potatoes, butter, salt (a few pinches once a day), pepper and sometimes garam masala. Potatoes are about 60% pre-cooled 40% freshly cooked. I’m not nearly as hungry as I used to be.
Thanks for organising!
50108266 and 20953986 (Potatoes + Organ meat)
Riff
Hi!
We are planning to participate in a trial with my husband / wife. So, there will be two very similar applications. [SMTM’s note: as indeed there were!]
We want to start with the plain potato diet and then add organ-based meat to it.
Reasoning includes personal preferences and curiosity about BCAA and PUFA theories.
Our current diet is 70% “Steak and Salad,” “Fish and Salad,” or “Plain Yogurt, Steak and Salad.” Some days, we binge on processed sugary sweets, then do steak and salad again. Our main dietary sacrifice is starch. And despite most of the time having a “colorful and diverse plate,” straight from the dietary recommendations brochure cover, we both consistently gain weight. So now we want to try to revert our diet.
We both search for dopamine in food and have difficulties fighting cravings, so as a second ingredient, we need something we will be very interested in. We had two main candidates – something sweet or something meaty.
The results of the Potatoes + Beef riff were not good, and we already know that eating lots of beef doesn’t work for us either. So we had to find meat we like, but don’t eat often. In our case, it’s the organ-based meat. It is common in our home cultures but is absolutely not popular in the country where we live now. So, we did not eat organs and bones for a long time, but we used to eat them when we were thinner. And we really miss it, so it makes us excited.
Regarding the PUFA theory: to be consistent, we had to decide which type of fat to use for frying the potatoes. We decided to go with butter and leave seed oils aside.
The plan is the following:
1. We start with the 2 weeks plain potato diet
– We eat potatoes of all available types and in all forms, ad libitum
– We season the potatoes to make them tasty. It includes adding salt, garlic, different peppers, fresh dill. If the potatoes stop being tasty, we try to add something else in controlled amounts – parsley, soy sauce etc.
– We fry with butter, preferably ghee. We don’t cook with seed oils during the diet.
– We may eat restaurant fries, which probably will be cooked with seed oils, but we don’t make it the main part of our diet
– We may eat store-bought chips, but we don’t make it the main part of our diet
2. We drink our usual amounts of water, tea, Coke Zero, and coffee, but we don’t add milk to our coffee anymore.
3. We do our cheat meals on weekend breakfasts. Usually, it’s some kind of “balanced European breakfast” – avocado, egg, toast with butter and cheese, smoked salmon, croissant, orange juice
4. We keep taking the supplements we are used to take, which are
Wife’s case
Lion’s mane – 2500 mg
Vitamin B complex (includes 50 mcg B12)
CoQ10 – 200 mg
Liposomal vitamin C – 500 mg
Saw Palmetto – 500 mg
Myo-inositol – 1000 mg
Husband’s case
Lion’s mane – 2500 mg
Vitamin B complex (includes 50 mcg B12)
CoQ10 – 200 mg
Liposomal vitamin C – 500 mg
5. We stop taking
Omega 369 – 500 mg – Because it’s seed-oil based
Kalium-Magnesium Citraat – 270 mg – Because we increase potassium intake with the potatoes
6. We keep taking prescribed medications
Wife: I don’t have any
Husband: Fluoxetine
7. We follow the second 2 weeks by adding the protein but trying to keep it on the low-BCAA side. It will be beef and chicken:
– Bone broth
– Tongue
– Liver
– Heart
– Stomach
– Intestine
– Kidney
– Other organs we may find in the shop
– But not the muscle meat
8. We also intend to try to add the third component to the diet or change the component after 4 weeks, depending on the results of the first weeks.
Report
We, 50108266 and 20953986, did it. Here is our report!
TLDR
2 weeks potatoes – lost weight, but hated it
2 weeks potatoes + organs meat – lost less weight, enjoyed much more. We will keep going.
Report
We live in the Netherlands, another country of lean people (16% obesity rate) whose diet contains a significant share of bread and potatoes. The potato part of the diet was easy to organize, as there are tons of potato options in the supermarket, and french fries are available in any restaurant. For the first week, we bought as many options as possible – different brands of potatoes sliced for fries, more starchy and less starchy potatoes for baking and boiling, and potatoes sliced and mixed with various spices.
We ended up with a pretty stable diet. For breakfast, we ate air-fried fries. For lunch, we baked potatoes in the oven with their shells and seasoned them with salt, garlic, dill, and butter. For dinner, we baked potatoes again or boiled potatoes with the same seasoning. Usually, after dinner, we had one more snack with store-bought chips.
The first week was especially difficult, as we were constantly bloated, constipated, dehydrated, and hungry. We were eating smaller volumes than we were used to, feeling satiated by the meal’s end but also hungry shortly after. Because of our diet mood, on the first days, we were hesitant to eat more; also, despite our hunger, potatoes were not attractive enough to get up and cook some. Some nights, I was struggling to fall asleep because of growling hunger mixed with a heavy feeling of being bloated. Some nights, we were binge-eating a big pack of chips per person.
We both felt we were not losing enough weight for such a struggle. We both have experienced losing significant amounts of weight with calorie-restricted low-carb diets, and we both felt that “at that time we were losing more weight and faster.” However, I have weight records for myself for those times, and actually, weight-loss speed in absolute amounts was the same.
The second week was easier as we found preferred options and ate more boiled potatoes. In the middle of the second week, 20953986 started to add a little bit of mayonnaise “for the taste.” It’s an interesting choice, as he usually is a hot sauce person. Maybe mayonnaise was easier to reach, or perhaps he was attracted to protein in it. For me, 50108266, the smell of eggs in mayonnaise was extremely tempting, and I spent the whole 12th evening thinking about eggs obsessively. On the 13th day, I also accidentally felt sick at night, like I had food poisoning or a stomach bug; both are not common to me.
On the morning of the 15th day, 20953986 almost cried over his morning potatoes because he was hungry and disgusted at the same time.
I learned that I could not predict how much weight I was losing. I could not explain my weight fluctuations with bowel movements, water loss, water intake, or menstrual period. I also could not correlate how swollen I was with my weight. However, 20953986 sees the correlation between his bowel movements and weight. I also tried to find a correlation between weight loss and hunger and weight loss and eating processed foods. I was expecting to lose more weight after sleeping hungry, and less weight after eating a full pack of chips, but neither I nor 20953986 found such correlations for ourselves.
In the third week, we started with organs. Organ meat is not typical in Dutch culture but quite common in Turkish and Russian, so we love it and know how to cook it. We added pork liver sausage to our air-fried fries breakfast. For lunch, we usually had boiled beef tongue with boiled or baked potatoes. For dinner, we had either soup with chicken hearts, potatoes, and bone broth or fried beef liver with fries. The grilled liver was also relatively easy to find in Greek and Turkish restaurants, so we had quite a lot of it. We also tried kidneys and thymus, but we did not like them.
In the third week, our weight fluctuated in an unusual way. On the 15th day, the first day of the organ diet, I developed symptoms of an ear infection (even more unusual to me than a stomach bug) that lasted until the 17th day. On the 16th morning, I got +1 kg (2.2 lbs); on the 17th morning, my weight was the same, and after the infection symptoms were gone, my weight rapidly dropped. But the resulting weight loss in the third week was still a pitiful 0,7 kg (1.43 lbs). I assume the reason for the weight gain was an infection, but it could also be a change in the diet or a change in our cheating routine. On that day, we had our planned cheat moment, but because of how depressed 20953986 was, instead of cheat breakfast, we had cheat lunch, which, in my case, contained grilled chicken breast, bread, and yogurt mixed with spices.
20953986 also did not lose much weight that week, but he gained weight not at the beginning of the week, like me, but on the weekend. He also had a sick moment, but it was a chronic muscular pain problem that most possibly had nothing to do with the diet and weight.
On his rolling average graph, we see that there is no actual change in the weight loss velocity.
The fourth week was easy and enjoyable. We never felt too hungry, did not suffer from digestion problems, and got our second-best weight loss results in the four weeks.
The only thing that we noticed was a craving for vegetables and greens.
At the end of the report, I want to mention the cheat days. We were cheating on weekend breakfasts, as it is an important ritual for both of us. We went (except for one time that I mentioned) to the regular places where we go for breakfast; we always had several latte macchiatos and some kind of an assorted breakfast platter with greens, eggs, savory sandwiches, and pastry (you can imagine continental breakfast or Turkish breakfast). I noticed several things for myself that, however, did not work for 20953986:
I was less attracted to bread and pastry. Last time, I did not touch my bread at all. This also means that I ate less for breakfast than usual.
We had two breakfasts in a row, and every Sunday, despite the cheating, I had a weight decrease, but after the second breakfast on Monday or one time on Tuesday, I had a weight increase. This pattern included even the first Monday of a diet. We started our diet on Sunday; we ate a cheat breakfast, then ate only potatoes, and my weight increased the next day. I wonder whether it is a coincidence, whether something I eat stimulates some weight increase, or whether it is about waking up later on the weekend. When we had a holiday during the third week, I also had a weight decrease followed by an increase, although we did not cheat that day. But the third week was a mess anyway.
Because of this observation, we want to try some experiments around it. Considering that we are limited with our habits and working week, we can’t change much, but our current intention is to keep the same diet and try different times of the day on weekends for the cheat meals, which will also lead to different cheat foods. I am open to suggestions.
54084282 – Potato, Bacon, Black Coffee, and Guinness
Riff
I’ve recently been experimenting with potato dishes in anticipation of trying a potato diet to lose some weight I’ve gained in the past few years. I feel a diet that I could stick to for 30 days would be potato, bacon, black coffee, and Guinness. The bacon would help supplement fat and protein missing from the potatoes and reduce the need for extra seasonings. The coffee and Guinness are mostly for personal preference but also helps supplement nutrition. I plan to also use a variety of potatoes, including sweet and red with peel on.
Report
It’s now 30 days, just checking in but I plan to continue on my potato riff. I still hope to make it down to 135 lbs 🙂
I have modified from my original riff! I’d characterize my current plan as fermented food/drinks + potatoes, along with a serving or two of protein daily. It is resulting in steady weight loss while alleviating the bloating and unpleasant constipation feeling that I experienced initially.
I have lost about 5 pounds this month while feeling generally satisfied and still surprisingly not tired of potatoes. Only real remaining issue is eating out. I just cannot bring myself to order only French fries for a meal (especially around the kids). I just cheat in those situations but still manage to steadily drop weight, lol. Thanks for bringing this diet to my attention, it’s been good to me!
83842317 – Potato + Meat
Riff
potato + meat (chicken, beef, pork, fish). I had energy on the last round, but lacked the energy to continue heavy strength training and had to give up lifting the last two weeks. I’d like to see if having meat occasionally can help with recovery and keep my strength and training regimen up while losing weight.
Report
Done.
This was much easier. Strength and endurance workouts were fine and I never lacked for energy. I was lifting for maintenance and ramping up endurance for a marathon in October and never had to quit a workout for lack of energy.
There was a tracked 38h:32m:25s, 72.53 mi, 18856 kcal of workouts across hiking, walking, running, swimming, and various cardio machines during this period.
I had several trips throughout the period, so sticking to it was a challenge. I made do with bags of potato chips and cans of fish from grocery stores, but not always having access to an air fryer was tricky.
I took cream or half-and-half when available in my 1-3 coffees per weekday when in an office (maybe maybe 12 of the total days)
I caught a nasty cold on the 13th that kept me bedridden and alternating between eating and sleeping for days
Between all the travel, it was difficult to get access to a scale, so I wound up weighing myself on five different scales when I could find one.
The convenience of eating tater tots, hash browns, chips, fries, and meat has been very easy and I’ll be sticking to it out of mostly convenience. I’ll add in vegetables for other nutrients, but psychologically I haven’t craved variety in my diet for several years, and the convenience is unbeatable. All I need is a reliable option when traveling.
22179922 – Potatoes and Cows
Riff
I am primarily interested in learning more about how keto interacts with potatoes.
History: About a decade ago I lost weight, and kept it off, with keto (note: a sort of meat and veg keto, elements of paleo and Mediterranean, more butter and animal fats than vegetable oils, and lots of intermittent fasting). I felt great, and it removed the constant hunger that I didn’t even know I had (a commenter on your blog called it the Hunger). I then gained quite a bit of weight due to a high stress situation in 2020, and for various reasons (pregnancy, breast-feeding, loss of gall-bladder) have been unwilling to go back to that diet until now. Also my ancestors would have eaten a lot of potatoes and dairy, and it seemed to work for them.
Current situation: I need to lose 10-20 kg. I am still breastfeeding, and thus need more nutrients (particularly protein) than average. I also am often low on iron. There may be another pregnancy in my future, so I would like to lose this weight fast.
Riff: I will start with potatoes, dairy, salt, and spices at libitum for two weeks (to see whether potatoes works for me, and to put the diet most likely to work up front). I will then add in some animal products (especially fat, stock, and liver from beef, pork, lamb) for another two weeks.
After the four weeks are up, I would like to try alternating two weeks keto (as described above) with two weeks potato (potatoes + dairy + animal products) for as long as I need to (possibly two months).
If I become pregnant again, I would like to try keto + potatoes (at the same time, rather than alternating). I’m wary of doing any extreme diet during pregnancy in case hormones/epigenetics/etc affect the baby. However putting these two extreme diets together makes a diet that doesn’t seem extreme at all.
Reports
First Interim Email
Hello SMTM,
Participant number: 22179922
Riff: potatoes and cows (I think I called it something else when I first
pitched it, but this name is better).
I have finished the first four weeks of my riff. I intend to keep
going, but I’m sending you my interim report now. I’m not sure whether
you want to publish it now, or when I finish for good, or both, or
neither, but I’m at least sending you the interim report now since I
intend to keep going for the foreseeable future. It’s in txt format so
it’s easier for you to turn into whatever format you need, with whatever
formatting is required.
I’ve included some information in the report about my dieting history,
for context. I’ve also included my conclusions about obesity and weight
loss in general to get a better idea of how I felt over the course of
this diet and how it shaped my opinions. Should you prefer, you may
publish my report without those sections, but I’ve included them for
context; and as a reader I’d like to read similar things from others.
First Interim Report
Participant number: 22179922
Riff: Potatoes and cows
*The Riff*
I like dairy, so wanted to do potatoes + dairy. Aiming for potatoes garnished with dairy, rather than 50-50. But I am currently breastfeed and thus may need more protein than usual, as well as other micronutrients, so I decided to add in animal products too. I’ve heard rumours about too much protein, so I decided to focus on things like stock, fat, liver, and only eat flesh if I felt a craving for it. I’ve also been reading about seed oils recently, so I decided to focus on beef and lamb (yes, I know lamb is not from a cow) rather than chicken and pork (I rarely eat pork anyway). Since I’m allowed both butter and animal fat, there’s no point using any other sort of cooking oil.
But I also wanted to see whether potatoes would work for me at all, so I decided to start with two weeks of just potatoes and dairy, followed by two weeks of potatoes and cows. I did not end up following this to the letter, but I decided to split this diet up into multiple levels and record each day which level I did.
0 – Potatoes only (salt and butter allowed begrudgingly)
1 – Potatoes and dairy
2 – Potatoes and non-flesh animal products (i.e. fat, stock, organ meat)
3 – Potatoes and animal products
4 – Potatoes, animal products, and fruit and vegetables.
I never reached level 4 in the first month (unless you count cheat days), but I put it in because for the next few months I want to experiment with alternating between potatoes, keto, and keto+potatoes in two week blocks.
Some Q&A about this riff:
Why now? Baby is getting most calories from food rather than breastmilk, and I just came across the potato thing a few days ago, and I want to have another baby soon, so now’s my chance.
Why potatoes? Preliminary results seem pretty promising. Also I love potatoes. Also my ancestors ate lots of potatoes so they might work well with my genome.
Why dairy? Preliminary results seem pretty promising. Also I love dairy. Also my ancestors. But also, I’ve heard good things about butter in particular as a source of fat, and I love eating potatoes with cheese and/or butter.
Why add animal products? I need iron. Also frying potatoes in tallow. Also other animal nutrients.
Why not meat? I might add meat if I feel particularly protein hungry, but preliminary results for meat seemed not great, and I mainly wanted to test potatoes, rather than “meat and potatoes”. But someone (possibly me) should test “meat and potatoes” in the future. Or even “meat and potatoes and veg”/”meat and 3 veg”.
Why not chicken? Preliminary results for eggs seem bad, and also their high in lithium. I’ve heard rumours that chicken fat inherits its omega3/6 etc from its diet, and chicken diets are probably bad, so I think chicken might be a confounder that is worth testing separately. I’d like to test free-range vs feed lot chicken though.
Doesn’t pork have the same problems as chicken? Yes, but I rarely eat pork as I don’t particularly like it, and I especially avoid pork fat, so I’m not particularly fussed about it.
What about fish? I might add some fish as “meat” if I feel particularly protein hungry. But I don’t really eat fish stock, or want to fry potatoes in fish fat, etc.
*About me*
– I am female. Ever since puberty I’ve needed both red meat and iron supplements to stay ahead of deficiency.
– I’ve always been a bit on the chubby side, with my BMI hovering at the overweight border of normal all throughout childhood. I love food. Food makes me feel better and I stress eat and emotional eat and eat for enjoyment and very rarely forget a meal. (I suspect genetics makes some people feel this way about food more than others, and therefore people like me will overeat more than undereat, and thus will tend towards the overweight side of the spectrum, and will be more likely to be overweight/obese when there is an environmental issue. Whereas my husband often forgets to eat, so that probably counteracts whatever is in our environment)
– I need strict rules. I don’t do well with moderation.
– I need extrinsic motivation. I love food and don’t particularly care about appearance, and don’t really play sport. Being part of a study is particularly good for this.
– Related to the above, I am Catholic and find that I am able to “diet” during Lent in ways that I don’t have the willpower for during the rest of the year. I’ve recently been experimenting with trying to use this to help with both moderation and motivation, e.g. only having sugar on “Feast days”.
*My weight and dieting history*
Childhood: My normal/starting adult weight is 75kg. Both my parents have always been overweight. We would often flip flop between lots of take-away, and a strict wholefoods/mediterranean diet. My mother tried to be mostly low-carb, and used olive oil rather than canola/vegetable oil. We rarely ate wheat or junk food due to a coelic in the family. I never felt true satiety, but could feel physically full, and would also use social cues to determine when to eat or stop. I noticed a commenter on SMTM refered to “the Hunger”, and that’s exactly what I have. Eating Chinese take-away was an occasion for bingeing.
Anecdote about “the Hunger”: As and adult, I went to the USA with my family. I felt the Hunger stronger than ever before. At one point we’d just finished eating lunch and my (stick-thin) sister saw an interesting restaurant and decided to get a second lunch. I thought “Of course we could all eat a second lunch, but it’s not socially acceptable to admit that, and even less so to actually do it”. I now understand that not everyone feels this Hunger.
First weight gain: in my third year of uni I looked in the mirror and realised I’d gained a lot of weight. I was now 85kg. At the time, I attributed it to following my now-husband’s diet patterns (lots of carbs, we’d often share some hot chips together for lunch, very little meat or protein) rather than my mother’s (too many carbs are bad, eat some protein with every meal). However, having read “A Chemical Hunger”, I now see it could be due to moving house, moving daytime environment (from school to uni), the preponderance of on campus food options (pfas, seed oils), or even the increase in my wheat (glyphosate) or non-freerange chicken (antibiotics?) intake.
First weight loss (keto): I did a combination of keto and intermittent fasting. My keto diet was basically meat+veggies, with some dairy, as opposed to what I’ve heard called “Standard American Keto”. I never measured my ketone levels, but I determined ketosis based on how I felt, and in my opinion this was reasonably accurate. I would generally eat one meal a day, occasionally with one snack, occasional fast for the whole day, and every two weeks I would reintroduce carbs for two weeks. I rarely ate take-away, at mostly animal fats. I lost 20kg in 6 months and got down to my lowest adult weight (65kg). I very quickly gained those last 10kg back (within two weeks), and was stable at my old set point of 75kg for the next 5 years. For the first time in my life I no longer felt the Hunger. And even when I reintroduced carbs, I found the Hunger was still gone for the next week or so. I felt true satiety! And when the Hunger returned in force, I was able to kill it off with a week of keto, or stave it off with one day of keto/fasting every one to two weeks.
But this weight loss also co-incided with another change in environment, both moving house and moving workplace/school/uni.
Second weight gain (2020): I had a combination of a long term stressor, plus some acute stress, plus some physical influences, plus the covid lockdowns, all coalesce at once, and I gained about 15kg that year. But, having read “A Chemical Hunger”, I notice this weight gain also coincided with moving house, and a change in living arrangements (I got married), and a change in eating behaviour (I was now a short walk away from a supermarket that liked to mark down their products, so I would often go for a morning walk through the supermarket to grab a bargain, and ended up eating a lot of packaged and processed food (pfas? seed oils? glyphosate in wheat? etc).
Pregnancy etc: I was now 93kg and creeping up and up, and I became pregnant. Suddenly I couldn’t do keto (this is debatable, but I decided to be safe in case of hormones or epigenetics) or fast any more, so I could neither arrest this upward trend nor reverse it. Also I needed a lot of extra protein and extra nutrients (from what I understand, this is mostly for the mother’s sake, as the baby will generally steal her nutrients regardless). Morning sickness meant I could eat only carbs, fruit, and some dairy. I had strong cravings the whole pregnancy for carbs+dairy, and this continued into breastfeeding.
Gall bladder: a few months after giving birth, I went to hospital and needed my gall bladder removed. I did some research and realised that I needed the following diet for the rest of my life:
– high fibre (to slow down digestion and soak up gall that is produced)
– steady fat intake, so lots of small meals is better than one
– relatively stable diet.
– at first I thought I had to eat breakfast, but with some experimentation it seems that I can skip it as long as I’m consistent.
– I’ve heard rumours that different fats react differently (in particular, that coconut oil isn’t digested by gall, and that olive oil feels better the next day than fish and chips grease)
These rules are at odds with my previous success at keto and one meal a day. I was pretty scared to try anything slightly away from general medical establishment food recommendations, hesitant to try keto again, and scared to go too long without a meal, even when not hungry. I then gained another 10kgs, and ended up just over 100kg.
Second weight loss: I knew something had to be done, so I decided to try keto again. I kept starting and then cheating a day or two later, so I never made it to ketosis, but it did help me to feel comfortable with keto again, even without a gall bladder. I finally managed to reasonably consistently do keto during Lent (cheating every Sunday though), and I lost around 5kgs (from 102kg to 97kg). Then I discovered SMTM and the potato study a few months later. And if I can make keto+potatoes work, I can continue that through pregnancy and breastfeeding in the future. I lost about 2kg in a month with this riff.
*The month of potatoes*
I started off with just potatoes and dairy. I very quickly found myself eating a lot more dairy than envisioned, as a piece of cheese or a glass of milk made a good snack. I found myself always running out of potatoes at the beginning. Very excited, as potatoes and dairy are both delicious. At the beginning I would often find myself too hot, and fidgety, but as time went on I felt it a little less.
I started adding animal products earlier than envisioned, at day 5. Surprisingly, I didn’t yet have any cravings for them, but my husband wanted to feel included so I made us some sweet potatoes fried in animal fat. I also added meat earlier than expected, on day 8, due to wanting a bit more variety in my diet rather than a craving.
My typical meals were baked potato (usually microwaved, served with cheese and sour cream), soup (potato boiled in stock with cheese, often with lemon juice and pepper added, and usually with a potassium salt mix added too), fried potatoes (either fried in animal fat or ghee, sometimes steamed or microwaved before), and cepalinai (a lithuanian dish involving grated potato, wrapped around mince, boiled, then served with sour cream, onion, and bacon). I’d never made cepalinai before, and never did succeed perfectly, but I had a lot of fun this month trying very slight variations in the mixture to try to get them to work. Note that steaming, rather than boiling, is a great cheat’s way of cooking cepalinai without them falling apart.
I often had a bite of my child’s food when she wanted to share with me, but I didn’t count this as cheating. On Fridays I would eat a few bites of salmon with my potatoes. I would generally cheat when going out, which was mainly Saturday evening and Sunday brunch. Some days I would have a square of dark chocolate after dinner.
Early on, I tried two meals that I knew would have lots of leftovers (roast potatoes – potatoes that had been previously boiled with butter, garlic, lemon juice (I had been given lemons the day before I started this diet), herbs; and scalloped potatoes with a cream and garlic sauce). I gained 1.3kg, which is technically within uncertainty given how much my weight can vary day to day, but it was quite disheartening and I tried to troubleshoot. Here’s my diary entry from that day:
> Why am I gaining weight? Eating too much? Do I need less variety? Am I eating too much cheese? Does boiling reduce potassium too much? … I can gain/lose by up to 3kg just because (e.g. bloating, mensturation, etc), so idk.
From this point onwards I never boiled my potatoes unless I was going to eat the boiling water too. And I never made large oven tray meals either, or meals with garlic, because I noticed I overate those two meals.
From my fasting days, I had a jar containing a mix of potassium salt, sodium salt, and lemon-flavoured magnesium. The label has rubbed off and I no longer remember the quantities. I decided to try adding this to my food in case potassium made a difference. But I also hate the metallic taste of potassium and the weird fake lemon flavour of the magnesium, so I could only add this in small quantities, and only if I was also adding lemon juice, and practically this meant I only added it to soup.
On some days, especially day 8, I felt extremely hot and fidgety, and it was an internal heat, as though my metabolism was on fire. I started recording my daily morning temperature after that, but there was nothing out of the ordinary there. And on some days I was extremely cold, as though I was eating at a calorie deficit, but it was hard to say how much of that was due to the cold winter weather on those days.
Got sick around halfway through, but kept eating potatoes. Got very little sleep towards the end and probably overate.
While the Hunger never quite went away on this diet like it did during keto, I did get very attuned to noticing a certain variation on the Hunger, which I’ll call the Addiction. As far as I could tell, the Addiction cropped up whenever I ate seed oil (usually take-away foods like hot chips and Chinese, or packaged foods), but this could easily be confounded by pfas or some other problem. And when it cropped up, I felt a compulsion to eat that particular food, and never felt satiated by that food, and furthermore the Addiction seemed to hang around for about 12-24hrs.
I’ve realised that the Hunger seems to come in at least two parts, and on days when the Addiction wasn’t there I found myself occasionally feeling semi-satiated and happy to put my half-finished food away for later. If the seed oil blogs are right, I wonder if the Addiction is direct vegetable oil metabolic harm and the non-Addiction part of the Hunger is some sort of indirect metabolic harm from vegetable oil. Or they could be from at least two different sources of contamination etc.
I never got sick of potatoes, and in fact found a new appreciation for them. I particularly enjoyed feeling a connection with my european ancestors. However, towards the end I did feel a strong yearning to include other foods like onions, eggs, or a touch of flour. This was not a craving, but because I wanted to better emulate some of these ancestral recipes. In future I may decide to be a little more lax with things like that. On the other hand, I never managed to eat only potatoes (and salt). I tried eating only potatoes twice: the first time I caved and added butter at dinner, the second time I had butter with every meal and caved and added cheese and milk at dinner. I don’t think I could do a straight potatoes diet.
*My current theory*
I read “A Chemical Hunger”, and I generally agree that there is some sort of contamination in the modern world. Probably multiple. But I also think some things like seed oils and HFCS may be a problem too. It seems like certain diets (e.g. keto) may be a bit of a work-around for a broken metabolism, but I love carbs so I’d like to get to the bottom of this so I can eat carbs freely some day.
Mainly, I think that each of these issues probably causes obesity in some people, but none of them will be the cause of obesity in everyone. And if we remove one thing (e.g. pfas), some people will get completely better, and others will get a little bit better, and still others (hopefully very few) will have been permanently broken. For me personally, I think seed oils are one culprit, but I think there’s at least one other that I haven’t identified yet.
The fact that semaglutide has been found to work against addiction makes me wonder if one of it’s main pathways is preventing “the Addiction”, and thus that vegetable oil (or whatever similar thing in processed food (both ultra-processed packaged food and commercial restaurant/fast food)) is a culprit for many people.
*The future*
I’m going to have a few cheat days, maybe up to a week, and then try alternating between keto and potatoes+cow every two weeks. I may allow a few extra things like onions and eggs during the potatoes+cow phase. Next time I pregnant, I’d like to try some version of keto+potatoes, i.e. a sort of wholefoods diet that includes milk and excludes rice and wheat, so as to be sufficiently mainstream. I’d like to avoid vegetable oil, but that’s extremely difficult at the best of times. I’d also like to avoid packaged and ultra-processed food, and wheat.
Things I’d like to experiment with in the future (or see someone else try):
– Rice (I love rice and could eat it all day)
– Better bread (many variations, e.g. made without soy, without vegetable oil, from european wheat, etc)
– Free range vs. cage eggs (and chickens)
– Chicken (esp free range) vs. red meat
– Animal products vs. animal flesh
– Meat+veg+potato(+dairy)
– Alternating keto and potato, or keto and potato+keto
– Modern Catholic diet: preplan what fast (i.e. some sort of food restriction) and feast days mean, and preplan which days of the year are which (mix of long and short periods), and then follow that
– Medieval Catholic (or Orthodox) diet: as above, using medieval rules.
– Medieval peasant diet: as above, but with very little meat except on Sundays and feasts.
Second Report
Hello SMTM,
Here’s my next (probably final) report. This time there is less to say, so I’ll just say it here instead of attaching it:
————————————
Participant number: 22179922
After I completed 4 weeks of potato+cows, I decided to start alternating between 2 weeks “keto” and two weeks “potato”.
During my two weeks of keto, I tried to do something similar to ex150 from ExFatLoss. That is, one meal containing veggies + a limited amount of protein, and as much cream as I like the rest of the time. But because I don’t have a gall bladder, I require more fibre with my fat so I decided to add veggies or berries to the ad-lib cream. Overall, I don’t think this worked very well. When I exclude the initial water loss, I think I even gained weight here. And it took about a week for my gall-bladder to adjust, so I should have chosen a longer period. And towards the end I was craving carbs and protein and I had to switch to potatoes early.
I then intended to do a further two weeks of potato+cows, but it turned out I was pregnant. That probably caused the protein cravings, but I don’t think it caused the weight gain. Because I was pregnant, I decided to follow potato+cows very loosely, indulging in any cravings that came up ad lib. However, it turned out that most of my cravings were for meat, potatoes, and dairy anyway, so I actually followed my potato riff reasonably closely. Three common additions during this time were onions, eggs (free range), and flour (Italian to avoid glyphosate), mostly so I could follow certain potato recipes.
Overall, I didn’t seem to lose much weight in the initial 4 weeks, and to the extent that I did lose it I seemed to gain it all back in the following 4 weeks. I also felt very tired and hungry towards the end, but it’s unclear how much of that was due to a calorie deficit and how much was due to pregnancy. I would not attribute the weight gain to pregnancy though. It felt a lot closer to “weight loss by calorie deficit” rather than “weight loss by not feeling hungry”, both of which I have previous experience with.
I don’t think I’d try potatoes for weight loss in the future, but I did feel pretty good on them, discovered a few new satiety-related feelings, and I now have a new-found appreciation for potatoes. I’ve also made a big effort to avoid fast food, take-away, and packaged food, along with Australian and American wheat, and obvious sources of PFAS. And when I do buy pre-prepared food, I do my best to avoid fried food. I’m sure it’s healthier, but I’m yet to see an effect on my weight yet.
I will continue eating this way for the foreseeable future, but I don’t think I’ll fill in the spreadsheet – I’ve already noticed I’m putting in a lot less information than in the first month.
And I still haven’t managed to properly make cepelinai.
59960254 – Potatoes with Fire in a Bottle Characteristics
Riff
4 weeks. I am planning on incorporating the general idea/outlook of work like Fire in a bottle. So potatoes and a small amount of fat from sources that are not seed oils. Butter, tallow, coconut, cacao, etc.
Report
So my protocol was potato diet, low fat, low protein in the spirit of Brad Marshall’s “Fire in a Bottle” blog. So that meant the fat was generally saturated, and sources high in stearic acid. Fruit and honey were permissible, as well as dates for an evening sweet treat, or high cacao % dark chocolate. The one corner I cut on this was to frequently use this chili oil ( https://xiankits.com/products/xff-chili-oil-crisps-jar?Size=8oz ) to make the meals more palatable. In the spirit of FiaB this should be off limits because I’m sure the oil they’re using is some sort of seed oil but… can’t win them all.
For potatoes I tried a range of different styles, at first doing separate batches of regular and sweet, so that I had options. Eventually found I really enjoyed the yellow potatoes from Lidl and just make that. For prep/cooking I peel, boil, and mash all of them. At first I was weighing and tracking calories and titrating the amount of fat added to keep it below 10% of calories. After a week or 2 of this I got lazy and just eyeballed it. I experimented with all manner of combinations when eating. I found sweet potatoes often didn’t require the addition of anything beyond salt and pepper. Regular potatoes were eaten with various combinations of: butter, stearic enhanced butter (as Brad describes on his blog), chili oil, beef tallow, cacao butter, beef bone broth, honey, powdered glycine, and maybe something else I’m forgetting.
I found the diet reasonably easy to stick to, since I wasn’t eating strictly potatoes and could vary what I put in them. One concept that Brad has talked about is the idea that saturated fat causes a feeling of satiety much quicker than PUFA and why, down to a mitochondrial level, that might be. I really buy that argument now after the last several months. The speed and intensity of satiety I get when using tallow or cacao butter is a lot. I found my perception of hunger changed whenver I had a good stretch of following the diet strictly. I wouldn’t really feel actaul hunger, I would just at some point realize I was daydreaming about how good an entire pizza would be, or a steak, or piece of cake, whatever, and know that meant I was hungry.
Any time I’ve restarted the diet after a cheat day I find it takes at least a day to feel the effects kick in. Between potato diet and not drinking (which is still kinda a new thing for me) I find I wake up early and have good energy throughout the day. I’ve experimented with eating early in the morning to kickstart metabolism, another thing I believe I’ve heard Brad talk about, and at the other end of the spectrum waiting till at least noon or later to actually eat a substantial meal. The second option is more fun mentally because the morning fast allows me to log a lower weight for the day, and I’ll take any psychological trick that works. I found blood pressure improved pretty quickly with some weight loss and a few days into potato diet. Blood glucose was less quick to make changes, but perhaps I need to lose more weight.
I often cheated when going out to dinner with the wife, since in my mind eating fries in a restaurant is also a bad option due to the frying oil, so in those situations I just went with the flow and ordered what I wanted. I found between weight and waistline I could see some sort of progress near daily, however that progress would be quickly and temporarily undone by a cheat day or meal. Every cheat was reversed by getting back on the diet, but conversely, you could say as soon as I stopped the restrictive diet I immediately started reverting to the mean, which for me seems to be over 220.
I only ended up losing 10# during the month in part because of cheat meals, with a few days of travel, and my favorite cat getting sick at the 3 week mark, which threw everything out of whack for the 2 weeks that he was ill before we had to put him down. Since completing the month I’ve tried to stay on the diet however it’s summer time and there’s tons of plans and it’s hard not to cheat when out and about.
My interpretation of Brad and others work is that the increased PUFA in diet throws off a variety of mechanisms that disable or alter the lipostat and cause weight gain. If Brad is right then this is in part because the body normally sees PUFA as a sign of scarcity and depresses metabolism as part of a survival mechanism. My understanding of all that is that in theory if I could purge the excess PUFA from body fat, which would likely also mean losing quite a bit more weight, that maybe then I wouldn’t so immediately start putting weight back on when I stop eating potato diet.
At time of writing I’m at 213, up from a low of 207 after a week and a few days of being off diet. Will be interesting to see how long it takes to get back to 207 and make a new low. I am having a hard time of breaking and staying under 210, and I have not weighed less than 200 in over a decade. My goal weight is still < 180, and I plan to evaluate how much further to go when I get to that point. And while this has not been as immediate a change as I’d like, I am still 20# lighter than my heaviest weight.
Also today I shared a different version of the potato diet chart/vitals with you. I don’t love the horizontal scroll to fill in the info. Will be continuing on with the V2 I shared. This was a kinda free form rambling recollection of the experience. I should have done it sooner after the completion of 1 month but ya know, was dealing with the cat and life in general. Please hit me up with any followups as needed.
95078099 – Potatoes + Soy + Plain Vegan Chocolate
Riff
My riff is potato + soy products + chocolate! Sounds delicious, and will give me plenty of protein.
My main hypothesis for why the potato diet works is that it’s relatively bland, leading to less calorie intake. My chosen riff will hopefully not be very bland, though, and if it works, would make my hypothesis seem less likely to me.
Note that my starting weight is quite low, with a BMI of ~20. This is the result of a long, hard calorie restriction. My personal aim is not to lose weight, but to keep the weight down. If I stay at the same weight, and not drift up by a few pounds, I’d consider that a success!
I participated in the half-tato trial last year (participant ID 81471891), with a highly calorie-controlled approach, and I didn’t see a significant difference in weight loss speed between the baseline weeks and the potato weeks. This time, I plan to not count calories or track what I eat, but just to eat what I feel like, within the constraints of my riff.
Report
Hey SNTM 🙂
I finished my “potatos + soy products + plain vegan chocolate” riff!
Found it pretty enjoyable! I stuck to my riff very consistently, and didn’t break the diet.
– Potatos: Most of the time, I microwaved them, which I found extremely convenient! But I also ate them baked, fried, mashed, and as soup. I also occasionally ate french fries, potato dumplings, and store-bought hash browns. Once, I tried making “potato cookies” from potato starch.
– Soy products: This included soy milk, soy yoghurt, soy-based cream, lots of tofu, fermented tofu, tempeh, some soy-based meat substitutes, soy flakes, and soy flour. I was really happy with the variety here!
– Chocolate: I restricted myself to plain, dark, vegan chocolate, so I wouldn’t over-indulge. But I didn’t hold back here, and ate as much chocolate as I wanted. In the end, I was a bit bored by plain supermarket chocolate. I also put cocoa powder into my soy milk sometimes.
– Oil: This was allowed per the base protocol. I mostly had canola oil, olive oil, coconut oil, and — of course — soybean oil.
– Spices: A per protocol I also added spices to my food: Salt and pepper, herbs, garlic and onion powder, chili and paprika powder.
– Sugar: On two days, I made caramelized potatos, and some of the soy milk and soy yoghurt I ate had sugar in it.
So, what were the outcomes? It is important to mention that, because of my already low starting weight, my goal was not weight loss, bug weight maintenance. Between the first and the last measurement over the course of the four weeks, I lost 0.7 kg (1.5 lbs). However, as weight measurements have a high degree of noise to them, looking at a moving average of the data seems more meaningful.
This becomes especially clear when zooming out. I have *a lot* of data on my weight, and attached some graphs: Of the last two months, of the last 1.5 years, and of all data I have (12 years). As you can see, I did a calorie restriction diet for most of 2023, where I ate 1200-1800 kcal per day. Now, I’m trying to stay inside the 64-67 kg range by resuming that restriction once I hit the upper boundary of that range, until I hit the lower boundary again.
I started the potato diet immediately after such a calorie restriction phase. This way, I could compare how effective it would be in keeping my weight down. Overall, in the moving average, it looks like I gained about 1 kg of weight during the month. This seems typical for a phase where I’m not counting calories. So, for myself, and for the purpose of keeping my weight down, I’d consider my potato riff ineffective.
Finally, here are some suggestions for how I think you could improve your approach:
– Ask people to track their weight for one additional week before and after the potato period, to be able to build better moving averages, and to see how starting/stopping eating potatoes affects the weight.
– Have participants fill out a survey at the end of the four weeks, asking for more data. Questions like “How many meals were deep-fried potatoes?”, “What total volume of oil did you consume?” or “What food did you miss most?”
– Do yearly follow-up surveys with all participants (of all previous trials)! Ask for current weight, their current potato consumption, and other dieting experiences. This would allow you to see the long-term effects of the potato intervention.
I have a followup with results from a second round to share – feel free to post it if you want to.
It’s me, Skittles guy* again. I’m back to report on my second round of the potato diet. After my successful first attempt in January, I decided to give it another go this summer.
Quick Recap of Round One (January):
– Duration: 4 weeks
– Weight loss: 12 pounds (187 to 175 lbs)
– Protocol: Potatoes, fats, and Skittles (consumed in moderation)
The Interim Period:
After the initial success, I maintained my weight without much effort. However, by June-July, I noticed the scale creeping above 175 lbs, accompanied by some compulsive eating behaviors. So, I broke out the potato peeler once again…
Round Two (July 22nd – August 17th):
– Starting weight: 176 lbs
– Ending weight: 166.4 lbs
Modified Protocol:
This time, I allowed myself the following foods ad libitum:
– Butter and oil
– Sweet Potatoes
– Low-calorie vegetables (onions, peppers, broccoli, green chile, etc.)
– Skittles (in moderation)
Additional Factors:
– I’m in the midst of training for an Ultramarathon and averaged ~30 miles of running per week
– Allowed fresh fruit as a treat after runs of 2 hours or longer (4-5 times during the diet period)
– One cheat meal after a particularly long run
The Experience:
While not quite as enjoyable as the winter edition (hot potatoes are probably just less appealing in the summer?), the diet was still effective and compliance was relatively easy. Hash browns and mashed potatoes were my go-to meals, often with generous helpings of green chile. I had no particular difficulty running, and my estimated VO2Max (per Apple Watch) improved from 43.5 to 45.
Key Takeaways:
1. The potato diet once again proved effective, even at a lower starting weight.
2. Adding other vegetables was not incompatible with weight loss.
2. The diet is compatible with endurance training, supporting both weight loss and performance improvement.
The potato diet has been a game changer for me. It’s a real psychological comfort to know that I can drop weight (or even just reset my eating behaviors) with a simple protocol that doesn’t require a great deal of mental effort.
* I generally didn’t eat more than 20-30 skittles a day, and sometimes none. I don’t really recommend eating skittles-only meals but you do you!
This account has been lightly edited for clarity, but what appears below is otherwise the original report as we received it.
From April 21 of this year until today (August 5), I’ve been on a potatoes-by-default diet. This was inspired by the email by M (Philosophical Transactions: M’s Experience with Potatoes-by-Default). In that time, I went from a weight of 173.0 pounds to a weight of 155.4. I’m giving myself a slight handicap, because I actually started the diet about two weeks earlier and my weight was ~180, but I didn’t track my meals or get a digital scale until the 21st and my analog scale was unreliable. Depending on how robust you want to be about it, I’ve lost 17 or 24 pounds in 107 or 121 days. About half of that weight loss was concentrated in the first few weeks, but I kept it off and continued losing over the rest of the diet period.
The most interesting thing I have to say about this is that I have nothing interesting to say. My experience matches what I expected from reading this blog and other sources. I’ve lost weight, and noticed no adverse health effects. That made me almost not want to share here, but it’s important to share replications!
The Details
Here are the eccentricities of my particular case:
1. The diet variation I chose.
I chose “potatoes by default” because I was interested in testing it, and because my social life puts me in group meal settings regularly. And then I added sauce because I had some sauce in the fridge I was hoping to use up. Initially I was going to discontinue the sauce after finishing it up, but I realized it wasn’t adding very many calories and I was curious whether it would affect the diet. My usual meal was a bowl of potatoes with roughly 2 tablespoons of sauce for dipping.
My favorite sauces after four months include the Zesty Secret Sauce by Marie’s, the Creamy Buffalo Sauce by Sweet Baby Ray’s, and the Gold BBQ Sauce by Kinder’s. Sometimes I would add some everything bagel seasoning and melted butter to the buffalo sauce – absolutely amazing!
One question discussed on the blog has been whether some ingredient serves as a blocker, and these sauces contained a whole lot of supposed blockers, which I think is interesting data. The percent of my meals with/without potatoes was inconsistent over the course of the diet, but sauce with potatoes was a constant, so if there’s a complete potato-diet-effect blocker, it wasn’t in the sauces.
I cooked the potatoes by cutting off the skin, cutting them in half or thirds depending on the size, and baking them in the oven on parchment paper at 425 for around 70 minutes. Potato varieties used were mostly russet and gold, sometimes red, and “baby” varieties if they were on sale.
The rest of my diet was very standard – all the normal-American-diet ingredients that might be blockers were involved, and there was no particular portion control beyond not eating when I was full.
2. Exercise.
I don’t believe exercise played a substantial role in the weight loss, but I had two exercise habits going on during this experiment and I did lose weight, so it’s worth reporting on them.
First, I walked a minimum of 10,000 steps each day, although that actually undersells the average (15,313).
Second, roughly 10 times during the experiment period, I played dance video games (DDR or Just Dance) for a minimum of 2 hours at a relatively intense difficulty mode. These mostly happened in the first two months, and were discontinued for personal reasons and not for diet or health-related reasons.
“I Could Never Do That,” Said The Person Who Never Tried
Some friends I discussed this diet with said they were interested, but could never do it, because they get cravings for specific foods when they’re hungry. I find this absolutely unpersuasive. The rules I followed let me have snacks when I got cravings; I still lost weight, and the cravings were less common than before the potato diet.
Some people in previous experiments writing on this blog noted that their desire to have junk food largely subsided while in “potato mode”. It was pretty easy for me to control what I ate at home. But sometimes I would be outside the house, and I would be a little bit hungry and get a small meal at a restaurant, and then I was in trouble! Because if I ate something small, I suddenly found myself hungry for dessert too. But if I didn’t eat out, and I went about my day, I would be perfectly happy not following that impulse.
At any rate, if you’re going to follow any diet, potato dieting is about as close as a diet can be to Pareto optimal: (e.g. it’s better in every possible way than any diet you compare it to)
It’s easy to do. The rules are simpler than any other diet; the shopping is simpler; the meal prep is simpler.
It’s easy to stick to; it’s the only diet I’ve ever kept for more than a week. My experience with other diets is that you are constantly thinking about the food and fighting cravings for other food. For some reason, a potato diet doesn’t create that for me, especially with the leniency of “-by-default.”
It’s less expensive than any other diet. I spent roughly $500 a month less on groceries over the period, despite eating the same proportion of my meals at home.
No Grand Conclusion
Ultimately, this is an N=1 replication. There were times when I ate better and times when I ate worse. I didn’t always lose weight when I was having non-potato meals, but if I gained weight (e.g. on travel) I would quickly lose it again when going back to potatoes. This feels like the “lipostat” hypothesis to me; eating a lot of potatoes did something to make my set point weight lower than it otherwise would be.
I’m happy to have lost weight and even happier to be able to provide a tiny bit more data in support of the potato diet.
You happen to be aware of a long-running literature that finds correlations between trace levels of lithium in groundwater and public health outcomes, things like lower rates of crime, suicide, and dementia, and decreased mental hospital admissions (meta-analysis, meta-analysis, meta-analysis).
You also know that when lithium is prescribed as a treatment for conditions like bipolar disorder, people often gain weight as a side effect. Based on these two facts alone — lithium causes weight gain at clinical doses, and some clinical effects seem to appear with long-term trace exposure — lithium already seems like the kind of thing that might cause obesity. You add it to the list.
You find that many of the professions that are unusually obese — like firefighters, truck drivers, and vehicle mechanics — work closely with heavy machinery, including trucks and cars, that are lubricated with lithium grease. And you notice that the Middle East is one of the most obese regions in the world. This potentially fits because they get a lot of their drinking water from desalinated seawater, which may contain relatively high levels of lithium. And because (as you will later learn) fossil fuel prospecting, especially from arid regions, tends to cause a lot of lithium contamination.
The famous Pima Indians of Arizona had a tenfold increase in diabetes from 1937 to the 1950s, and then became the most obese population of the world at that time, long before 1980s. Mexican Pimas followed the trend when they modernized too.
This is an excellent point. Sure enough, the Pima in the Gila River Valley of Arizona were unusually obese and had “the highest prevalence of diabetes ever recorded”, way back before the general obesity rate had even broken 10%.
This seems like a real blow to the lithium hypothesis — unless, of course, the Pima were exposed to unusually high levels of lithium way before everyone else.
Turns out, the Pima were exposed to unusually high levels of lithium way before everyone else. For starters, you find this report which says, “In the Gila River Valley, deep petroleum exploration boreholes were drilled during the early 1900’s through the thick layers of gypsum and salty clay found throughout the valley. Although oil was not found, salt brines are now discharging to the land surface through improperly sealed abandoned boreholes, and the local water quality has been degraded.” The report also notes that “lithium is found in the groundwater of the Gila Valley near Safford.” You also find this USGS report, which says a Wolfberry plant “was sampled on lands inhabited by the Pima Indians in Arizona; it contained 1,120 ppm lithium in the dry weight of the plant.” This is an extremely high concentration compared to other plants.
Another USGS report says, “Sievers and Cannon (1974) expressed concern for the health problem of Pima Indians living on the Gila River Indian Reservation in central Arizona because of the anomalously high lithium content in water and in certain of their homegrown foods.”
You track down Sievers & Cannon for more detail. Sure enough, you find that the average concentration of lithium in American municipal waters in 1970 was about 2 ng/mL, while the average concentration of lithium in the water of the Gila River Indian Reservation was about 100 ng/mL, around 50 times higher. Sievers & Cannon also say:
It is tempting to postulate that the lithium intake of Pimas may relate 1) to apparent tranquility and rarity of duodenal ulcer and 2) to relative physical inactivity and high rates of obesity and diabetes mellitus.
This couldn’t possibly have been said with the goal of explaining the obesity epidemic, because the obesity epidemic didn’t exist in the early 1970s when the quote was written. Sievers & Cannon had no idea the obesity epidemic was coming. It was a neutral observation.
If you had to point to some moment as the one we started to believe in the lithium hypothesis, this would be it.
It’s easy enough to come up with a theory that fits all the evidence you’re working with. It’s hard to make a theory that will fit the evidence you’re unaware of. The real test of a theory happens when it comes in contact with something new and relevant. The hypothesis that lithium is responsible for the obesity epidemic makes two predictions (with some allowance for reality being very weird): If some group was exposed to high levels of lithium earlier than everyone else, that group should become especially obese before everyone else did. And conversely, if there’s a group that became unusually obese before everyone else did, that group was probably exposed to unusually high levels of lithium early on. The Pima fulfill these predictions.
As you discover more about the lithium hypothesis, you add more interludes to the series. In the first interlude, you talk more about the possible sources of lithium contamination, like lithium grease, desalinated seawater, and the enormous spills that are a byproduct of fossil fuel prospecting. You also provide a close read of the paper by Sievers & Cannon.
In the second interlude, you take a look at the idea that modern people might be getting exposed to more lithium as a result of drinking from deeper wells made possible by better drilling techniques, and you start making some international comparisons.
Then you decide to try something a little silly. You happened to find a list of the most and least obese cities and communities in America, based on data from Gallup. You think it would be kind of funny to go through each of the cities and communities on the list, and see if you can find out how much lithium is in their drinking water.
This really seems like a long shot. Most cities don’t track the lithium levels in their drinking water, and even if the lithium hypothesis is entirely correct, even if you were able to find some measurements, it’s not clear that the data would show a clear relationship. After all, communities can have more than one source of drinking water, and drinking water isn’t people’s only source of exposure.
But the project unexpectedly turns out to be a huge success. You discover that the leanest communities tend to get their water from isolated reservoirs or pristine mountain snowmelt. Sometimes you can even find official measurements that confirm low concentrations of lithium. The most obese communities, meanwhile, tend to be drawing from aquifers with high levels of lithium, or directly downstream of coal ash ponds that are confirmed to be leaching lithium into the groundwater, or downstream of a lithium grease plant that recently exploded.
The scene of this morning’s explosion at the Chemtool plant in Rockton, seen by neighbors off Fischer Road in South Beloit. Evacuation orders in place for anyone within a mile of the building. @cbschicago
All this seems like pretty strong evidence in favor of the lithium hypothesis. A critic would have to argue that unusually obese cities just happen to be downstream from lithium grease plants that experience catastrophic failures. This happened not once, but twice. What are the odds of that, exactly?
A few months later, you get an email from JP Callaghan, an MD/PhD student at a large Northeast research university and specialist in protein statistical mechanics, modeling, and lithium pharmacokinetics. It’s hard to briefly sum up this wide-ranging conversation, but JP agrees that the lithium hypothesis is plausible and discusses some perspectives like bolus-dose exposure and multiple-compartment models that, taken together, suggest that if you’re exposed to small doses over a long enough span, it might even be possible to end up with internal lithium levels as high as those achieved with clinical treatment.
This still assumes that to gain weight, you need to end up with a clinical-level dose in your brain. But the trace exposure literature makes you think that even small doses have some effects. To test this, you survey people who take much smaller doses of lithium as a nootropic, and find that people who take doses as small as 1 mg/day report feeling all kinds of different effects, some of them quite negative. This suggests you may not need big, clinical doses of 50+ mg/day to gain weight, especially if you are exposed to low doses for a very long time.
Of course, 1 mg/day is still more lithium than most people are getting from their water. But you know that people get at least some lithium from their food. Remember how the Pima were eating wolfberries that contained 1,120 ppm lithium, which works out to like 15 mg per tablespoon of wolfberry jam?
You wonder how modern food compares, so you do a literature review. You find good evidence that there’s lithium in modern food, and especially high concentrations in certain foods like meat and eggs. You do another literature review looking at the fact that different sources report very different concentrations of lithium in modern foods. You find that the different papers use different analytical techniques, which may explain why they get such different results.
You test this idea by running an actual study to compare the different analytical techniques. Lo and behold, you find that exactly as you predicted, some techniques almost never detect any lithium in food, while other techniques detect it easily. The second set of techniques are almost certainly the more accurate ones, since they give consistently different readings for different foods, while the other techniques indiscriminately return almost nothing but zeroes.
Looking at the results themselves, you see that some of the foods you tested contain markedly high levels of lithium. In this sample, the highest levels were detected in ground beef (up to 5.8 mg/kg lithium), corn syrup (up to 8.1 mg/kg lithium), goji berries (up to 14.8 mg/kg lithium), and eggs (up to 15.8 mg/kg lithium).
You decide to do a followup study to take a closer look at those eggs. The results confirm your original findings — nearly all the samples contain detectable levels of lithium, and around 60% of samples contain more than 1 mg/kg lithium (fresh weight). As before, the egg samples with the highest concentrations of lithium contain just over 15 mg/kg in the fresh weight.
This also seems like some evidence for the lithium hypothesis. Potassium and lithium are both alkali metals, and it’s already well-established that sodium interferes with lithium kinetics in the body, so much so that going on a low-sodium diet while taking clinical doses of lithium can be very dangerous. It’s plausible that potassium has similar interactions.
Correlational Analysis
People often ask us, what’s the correlation between obesity and lithium in drinking water? Honestly, we find this question a little confusing.
First of all, everyone knows that correlation doesn’t imply causation. If you discovered a correlation between lithium in town drinking water and obesity in those towns, that would be slightly more evidence that lithium causes obesity, but by itself a correlation isn’t very strong evidence of a causal relationship.
Second, as we described in Section IV of A Chemical Hunger, a small correlation, or even no correlation at all, isn’t evidence of no relationship. Even when there’s a real relationship between two things, there are lots of things that can make it look like there’s no correlation; one example is that looking at a truncated range almost always makes a correlation look smaller than it really is. If you were to look at correlations in lithium exposure, you should expect to be looking at a somewhat truncated range, so the correlation in the data would be smaller than the real relationship, which could be misleading.
This is why we don’t really care about the correlation, because it couldn’t clear things up one way or another. A strong correlation between lithium in water and obesity rates wouldn’t be particularly convincing evidence in favor of the hypothesis. And a weak correlation, or even no correlation, wouldn’t be particularly convincing evidence against. Since it doesn’t clarify either way, you can see why we think that going after these data would be a waste of time.
What would be convincing is experimental evidence, if we could get it. (Though this isn’t always possible; for example, the smoking-lung cancer relationship was established without any human experiments.) We don’t understand why correlation comes up so often. People should remember their hierarchy of evidence.
In general we think this question reveals a misunderstanding about what correlation really is. A correlation is just a mathematical way of describing a relationship, and not even a very sophisticated one. The relationship is what we’re really interested in, and we already have good reason to believe that this relationship is pretty strong — all the evidence we laid out above. In our first post on lithium, in our second post on lithium, in our post on groundwater contamination and historical/international levels, and in our post looking at the fattest and leanest communities in America, we very reliably found that places exposed to high levels of lithium had high rates of obesity, and places exposed to low levels of lithium had low rates of obesity. This is strong evidence for a relationship, even if that relationship can’t immediately be expressed as a correlation.
All this to say, we can give you a correlation coefficient, but we don’t want you to take it very seriously. It does (spoiler) come out in favor of the hypothesis that lithium exposure causes obesity. However, for all the reasons we outlined above, it is not actually strong additional evidence, just one more small item to add to the pile.
Yes, it is a strong positive correlation. No, that is not conclusive, you need to weigh it in the balance with all the other evidence. Do not turn off your brain when you see the scatterplots.
To calculate a correlation coefficient, you need cases where you can find a number for both the obesity rate, and for lithium exposure. In many cases we can’t get one of these numbers (how obese was Texas in 1970? no one knows) or can’t get a specific number, even though observations are in line with the theory (drinking water in Chilean towns can contain up to 700 ng/mL lithium, but how much is it on average?).
But when we look at the 15 cases where we can give specific values to both variables (the American cities of Denver, San Jose, Barnstable, Miami, DC, McAllen, and San Antonio circa 2010-2020; plus measurements from Greece, Italy, Denmark, Austria, Kyushu Japan, 1964 America, 2021 America, and the Pima in 1973), the scatterplot looks like this:
That correlation is r(13) = 0.744, p = 0.002, with a 95 percent confidence interval of [0.374, 0.910].
The shape is pretty reminiscent of a standard dose-response curve, but it could also indicate a logarithmic relationship; if you log-transform the lithium dosage, it looks very linear:
That correlation is r(13) = 0.732, p = 0.002, 95 percent confidence interval [0.351, 0.905].
This can’t be cherrypicked because those are all 15 cases we are aware of where we have a measurement for both the obesity rate and the level of lithium in local drinking water. If you are aware of other cases, let us know and we will add them to the scatterplot.
There are only 15 datapoints. But at the same time, the correlation is clearly significant, p = .002, even with different models.
Pace Deniers
Some people seem to think we have an axe to grind about lithium, but we’re not sure where this perception came from. At the start we took lithium no more seriously than any other candidate. Over time, we found the evidence compelling, and now we think the case in favor of lithium is quite strong. This is all very carefully documented in A Chemical Hunger and our posts ever since. You can see every step of the process.
Clinical doses of lithium cause weight gain. Not for everyone, but it’s a known side effect. Many effects of lithium probably kick in at trace doses, especially when exposure is long-term. This is probably because lithium accumulates in the body, in the thyroid and/or brain (though possibly somewhere else, like the bones).
Lithium levels in US drinking water have been increasing for at least 60 years. We know where it’s coming from: increasing use of lithium grease, from industrial applications, and from contamination from fossil fuel prospecting, which produces brines known to be enormously rich in lithium.
Populations that were exposed to modern levels of lithium in their drinking water decades before everyone else had modern levels of obesity decades before everyone else. Many of the professions that are especially obese are professions that are regularly exposed to lithium grease.
Most of the leanest communities in America are places where lithium levels in the drinking water are either plausibly low given circumstances (e.g. they get their water directly from pristine snowmelt) or confirmed low by measurement. Most of the heaviest communities in America are places where lithium levels in the drinking water are either confirmed high by measurement or plausibly high given circumstances (e.g. they are directly downstream from a lithium grease plant that recently exploded).
It would be hard for this argument to be any simpler. Honestly, we keep feeling like we’re in the mental gymnastics meme:
We couldn’t fill out the other half of the meme because we honestly can’t tell what deniers are thinking? If you are a lithium denier, please fill out the other half and @ us on twitter.
Lithium Hypothesis for Dummies
To help make this discussion easier, in the following sections we break down the argument in favor of the lithium hypothesis piece by piece.
We invite people to dispute this case. It would be great to hear counterarguments!
We want to make it REALLY EASY for people to engage with the hypothesis, which is why we went to the trouble of writing this post.
However, we have conditions.
If you want to argue, we charge you to either: 1) make the case that these premises are wrong, or 2) make the case that the inferences don’t follow from the premises.
Anything else is pointless griping, and shows a serious lack of reading comprehension, to respond to a hallucinated version of the hypothesis rather than to what we have actually written. We won’t respond to such “arguments”. If we haven’t responded to you in the past, it’s because you displayed reading comprehension levels so low that we couldn’t find a productive way to engage.
As Zhuangzi (Kjellberg translation, p. 218) explains:
Making a point to show that a point is not a point is not as good as making a nonpoint to show that a point is not a point. Using a horse to show that a horse is not a horse is not as good as using a nonhorse to show that a horse is not a horse. Heaven and earth are one point, the ten thousand things are one horse.
Doses
For background, let’s talk about lithium doses.
In clinical settings, lithium is usually prescribed as lithium carbonate, and doses are given in milligrams (mg) lithium carbonate. However, lithium carbonate is 81.3% carbonate and only 18.7% elemental lithium, so the dose of lithium is much lower than the prescribed dose. For example, if you are prescribed 600 mg of lithium 2 times a day, that’s 1200 mg of lithium carbonate, which works out to about 224 mg of elemental lithium.
To keep things standard, and to focus on the actual effective dose, numbers from here on are always elemental lithium.
Clinical doses of lithium are usually between 336 mg/day and 56 mg/day. However, in rare cases lithium is prescribed at doses as low as 28 mg/day (e.g. here and here), suggesting there may be therapeutic effects at doses this low.
Doses between 50 mg/day and 1 mg/day we will refer to as subclinical doses, since they are smaller than the usual clinical dose, but still appreciable amounts.
Doses of less than 1 mg/day will be called trace doses, since you are unlikely to get more than this from your drinking water alone.
Premises
To the best of our knowledge, the following premises are all well-supported. However, some of these premises have more evidence behind them than others.
Premises about Effects and Doses of Lithium
D1:Clinical doses of lithium act as a mood stabilizer and sedative, and cause all kinds of nonspecific adverse effects, ranging from “confusion” and “dry mouth” to “vision problems” and “twisting movements of the body”.
D2: When people take clinical doses of lithium, many of them gain weight. As one point of reference, this review paper says, “lithium maintenance therapy stimulates weight gains of over 10 kg in 20% of patients.”
D4: A long-running epidemiological literature (meta-analysis, meta-analysis, meta-analysis) suggests that long-term exposure to trace levels of lithium in drinking water decreases crime, reduces suicide rates, reduces rates of dementia, and decreases mental hospital admissions.
D5:One randomized controlled trial found that a dose of only 0.4 mg/day improved the mood of a group of violent former drug users, compared to placebo. As far as we know, there are no other RCTs on lithium exposure below clinical levels.
Premises about Lithium Contamination and Exposure
C1: Between 1962 and 2021, median lithium levels in American drinking water increased by a factor of about 3-4, from a median of about 2 ng/mL to a median of about 6-8 ng/mL. Maximum recorded levels in drinking water increased by a factor of around 10, from a maximum recorded level of 170 ng/mL in 1962 to a maximum recorded level of 1,700 ng/mL in modern data.
C2: The EPA has expressed concern about trace doses of lithium in American drinking water. In 2021 they put out a report stating, “45% of public-supply wells and about 37% of U.S. domestic supply wells have concentrations of lithium that could present a potential human-health risk.” Specifically, they’re concerned that many water supplies contain more lithium than the relatively low trace benchmarks of 10 ng/mL and 60 ng/mL.
C4: Lithium grease was invented in the 1940s and was first patented in 1942. Since then it has become the most widely used type of grease, commonly applied to all kinds of machinery in automotive, industrial, and household applications.
O1: Some professions are much more obese than others. For example, the Washington State Department of Labor and Industries survey of more than 37,000 workers found that truck drivers were the most obese group of all, at 38.6%, and mechanics were #5 at 28.9% obese, while only 20.1% of food preparation workers were obese, and only 19.9% of construction workers. Another source, the National Health Interview Survey Data, (2004-2011) found that motor vehicle operators, health care support workers, transportation and material moving workers, protective service workers, and “other construction and related workers” had some of the highest rates of obesity.
O2: The Pima people, sometimes called Pima Indians, are a group of Native Americans from the area that is now southern Arizona and northwestern Mexico. In the United States, they are particularly associated with the Gila River Valley. The Pima seem to have had normal rates of diabetes and obesity in 1937, but by 1950 rates of both had increased enormously, and by 1965 the Arizona Pima Indians had “the highest prevalence of diabetes ever recorded.”
O4: In addition, Sievers & Cannon found an “extraordinary lithium content of 1120 ppm” in the local wolfberries, which the Pima “used occasionally for jelly”.
O5: Lithium contamination in the Gila River Valley likely came from fossil fuel prospecting. This report says, “In the Gila River Valley, deep petroleum exploration boreholes were drilled during the early 1900’s through the thick layers of gypsum and salty clay found throughout the valley. Although oil was not found, salt brines are now discharging to the land surface through improperly sealed abandoned boreholes, and the local water quality has been degraded.”
Premises about Lithium Concentration in Food
F1: Lab studies where plants are hydroponically grown under controlled conditions find that plants can concentrate the lithium in their water. For example, Antonkiewicz et al. (2017) finds that even when only exposed to 1 mg/L lithium in solution, corn ends up with an average of about 11 mg/kg in dry material.
F2: We recently conducted a study of lithium in 10 American foods, and found that all ten foods contained detectable levels of lithium, with levels as high as 14.8 mg/kg lithium in goji berries and up to 15.8 mg/kg lithium in eggs (fresh weight).
F3: As a followup, we conducted a study where we measured the lithium content of a wider variety of eggs. Nearly all egg samples contained detectable levels of lithium. Around 60% of samples contained more than 1 mg/kg lithium, and the samples with the highest concentrations contained as much as 15 mg/kg lithium (fresh weight).
Primary Inferences
K1 – From D1, D3: Some of the known effects of lithium that appear when someone takes clinical doses also kick in at subclinical doses.
K2 – From D1, D4, D5, O3: Some of the known effects of lithium that appear when someone takes clinical doses also kick in at trace doses.
K3 – From C1, C2, C3, C4, C5, C6, C7, C8, C9, C10, C11, O3, O5: Lithium contamination in the United States has increased since 1962 as a result of human activity, especially fossil fuel prospecting.
K4 – From F1, F2, F3, C11, O3, O4: Lithium concentrates in certain foods.
K5 – From O1, O2, O3, O4, O5, C4: Specific populations who have been exposed to high levels of lithium have high levels of obesity.
Secondary Inferences
S1 – From D2, K1, K5: Exposure to subclinical doses of lithium causes weight gain.
S2 – From D2, D4, K2, K5: Long-term exposure to trace doses of lithium causes weight gain.
S3 – From C1, C2, O2, O3, O5, K3: People are regularly exposed to trace doses of lithium in their drinking water, especially people in areas with notable fossil fuel prospecting like the US and the Middle East.
S4 – From C11, O4, K4: People are regularly exposed to subclinical doses of lithium in their food, especially people who eat food grown in areas with notable fossil fuel prospecting like the US.
Tertiary Inferences
From S2, S3, C7: The US and Middle East are so unusually obese because they are both arid regions that produce a lot of fossil fuels, leading to relatively high levels of lithium in the local environment.
From S1, S4: The US is a net food exporter, this is why the world in general is becoming more obese.
Predictions
No prediction can be entirely decisive, but here are some predictions that are likely to be true if the arguments above are sound, and lithium is a major cause of modern obesity rates:
International variation in obesity rates can be predicted by how much fossil fuels the country produces (not counting sources of fossil fuel that are not concomitant with lithium or that are in locations where they won’t expose people to lithium, e.g. offshore) and how much food they import from the US. International variation is also partially genetic, so even if this is a good fit, it won’t explain anywhere near 100% of the variance between nations. We explore this idea a bit in this post.
If someone makes a dataset of US counties that includes a “height in watershed” variable, that variable will be more strongly related to obesity rates than a raw altitude variable. If someone can somehow make a “downstream of how much fossil fuel activity” estimate variable, that variable will match even better.
Remaining Questions
Assuming lithium causes obesity,
How big of a dose is needed to make most people obese? And where is that lithium exposure coming from? Here are three possible (but not exhaustive) scenarios:
Trace doses of lithium are sufficient to cause obesity. Lithium is cleared from the brain so slowly (see e.g. this paper, “lithium has an increased affinity to thyroid tissue … [investigations reveal] the lithium elimination from brain tissue to be slow”) that over a long enough timespan, even very small doses accumulate.
Many people become obese on subclinical doses alone, so the subclinical doses of lithium found in food are sufficient to cause obesity. Trace levels in water have a small impact because they provide a more constant dose that keep levels stable, but wouldn’t be able to cause obesity on their own.
Subclinical doses of lithium by themselves are not enough to cause obesity. However, some foods contain more lithium than others. Sometimes you get unlucky and eat foods with such a high concentration they give you a bolus containing a small clinical dose, which over time leads to serious accumulation. Eventually lithium in the brain reaches the same levels as you would see on clinical doses.
We know that some plants concentrate lithium in their soil and/or water. Of the crops we grow for food, which concentrate lithium? What’s the rate of concentration — 2x, 10x, 100x? For various levels of lithium in soil and/or water, how much lithium ends up in various parts of the plant? What other factors influence this concentration? Similarly, how much do animals concentrate lithium in their feed into the animal products we eat?
How do we treat obesity caused by lithium exposure? Is it enough for someone to eat a low-lithium diet? Or do you need to take measures to increase the clearance of lithium from your system? What measures can accomplish that?
What percent of the obesity epidemic is caused by lithium exposure? 100%? 20%? Something in between? What else, if anything, is causing such high rates of obesity?
In general, what are the best methods to remove lithium from soil and water supplies?
Alternatives
Some of you may still prefer alternative theories. That is ok.
However, we do want to emphasize that alternative theories should be able to explain the following:
The unusual relationship between altitude and obesity rates in the United States. We say “unusual” because while many people want to pin this on something immediately related to altitude (like the idea that lower oxygen levels at high altitudes cause lower weights), this doesn’t actually match the evidence. First of all, the paper that people generally point to in support of this idea, Lippl et al. (2010), is quite bad. Weight loss was minimal, the analysis looks p-hacked (or at least suffers from multiple comparisons issues), and the study isn’t even an experiment, there is no control group. On top of that, since they manipulate altitude rather than manipulating oxygen directly, so this is at best evidence that altitude causes weight loss, not evidence for any particular mechanism. No points for presenting a paper that finds evidence for the premise trying to be explained, rather than trying to explain it. As for other arguments, Scott Alexander looked at the case in 2016 and concluded that the atmosphere probably doesn’t cause obesity. Also, simple elevation theories don’t actually match the evidence. Low-altitude states like Massachusetts and Florida are relatively lean, and West Virginia is relatively obese. In our opinion, the pattern matches “length of watershed” better than altitude itself (Massachusetts is very low-altitude but also in a very short watershed), and “aggregate drinking water exposure to fossil fuels” even better (West Virginia is high-altitude and near the top of its watershed but also the site of lots of fossil fuel activity).
Why the Pima were so obese so early on.
Why some professions are so much more obese than other professions, and why those particular professions are so unusually lean or obese.
The lithium hypothesis does a pretty good job explaining all of these observations. As far as we know, no other hypotheses of the obesity epidemic can be squared with them. It’s not like they have seed oils in Charleston, WV and not in Charlottesville, VA. It’s not like food is more palatable when placed in front of auto mechanics than when served to other professions. These are rather strong relationships and they need to be explained.
To be completely fair, there are some similar questions that the lithium hypothesis has yet to explain. Here they are:
A control system is a mechanism — mechanical, biological, or otherwise — that forces a measure towards a reference. One example is a thermostat. You set the desired temperature of your house to 73 degrees Fahrenheit, and the thermostat springs into action, to get its reading to 73 °F or die trying.
The usual assumption is that a control system works like a target, and tries to correct deviations from that target. Take a look at the simplified diagram below. In this case, the control system is set to the target indicated by the big arrow, at about 73 °F. Since control is less than perfect, the temperature isn’t always kept exactly on target, but in general the control system keeps it very close, in the range indicated in blue.
However, there are other ways to design a control system.
One way is to make a single-headed control system, that has a reference level, and simply keeps the measure either above or below that level. For example, this single-headed control system is designed to keep the temperature above 70 °F:
This is how early thermostats worked, and how many still work in practice. They do nothing at all until the temperature drops below some reference level, at which point they turn on the furnace, driving temperature upwards. Once the temperature returns above the reference level, the furnace is switched off. Barring any serious disturbances, this keeps the temperature in the range indicated in blue.
This works fine if your house is in Wales or in Scandinavia, where things never get too hot. But what if you want to control the temperature in both directions?
Easy. You just add a second single-headed control system on top of the first one, controlling the same signal in the opposite direction. This is a double-headed control system, that keeps the signal between two reference values:
One “head” kicks in if the temperature gets too low, and takes corrective actions like turning on the furnace. The other kicks in if the temperature gets too high, and takes corrective actions like turning on the air conditioning. Together they form a larger control system that, barring any damage or huge disturbances, keeps the temperature in the range indicated in blue.
(Both “single-headed” and “double-headed” are terms of our own invention. There may be official terms for these concepts in control engineering. If so, we haven’t been able to find them. We would love to hear if there are existing terms, please let us know!)
There is some reason to think that biological control systems in animals are mostly double-headed. This is due to the fact that these control systems are built out of neurons, and neural currents are in units of frequency of firing. Unlike other signals, frequency of firing can’t be negative: the number of impulses that occur in a unit of time must be zero or greater.[1]
Obesity
The current scientific consensus on obesity (link, link, link, link, link) is that it is the result of a problem with the control system(s) in charge of regulating body fat, the set of systems sometimes called the lipostat (lipos = fat).
We can explore this idea through a few examples. For the purposes of illustration, let’s use BMI for our units. BMI isn’t perfect as a measure — obviously your nervous system doesn’t actually measure its weight by calculating BMI — but it’s a simple and familiar number that will do the trick. In general we should make it clear, all the following examples are greatly simplified. In reality, the body seems to have many control systems to regulate body weight, not just one.
For starters, we know that the lipostat can’t be single-headed, because with ready access to food, people don’t generally starve to death, nor do they become fatter and fatter until they burst.
Clearly body weight is controlled in both directions. This means it’s a double-headed system. One part of the lipostat keeps you from getting thinner than a certain threshold. And another, separate part of the lipostat keeps you from getting fatter than a different threshold.
On to the examples. A person with a healthy lipostat would look something like this:
The two heads are set to different points, leaving a bit of room between the upper and the lower thresholds. This person’s weight can easily wander between BMIs of about 20 and 23, pushed around by normal behavior. But if they go above that upper limit, or below the lower limit, powerful systems kick into play to drive their weight back into the blue range between the two heads of the system.
What about someone whose lipostat is not healthy, someone who has become obese? One way for this to happen is for both heads to be pushed to higher thresholds, like so:
Here you can see that the upper head has been set to a BMI of about 35, and the lower head to a BMI of about 31. As before, their weight is mostly free to wander between those two levels. If they’re trying to lose weight, they can probably push their BMI down to 31. But it will be very hard to push it past that point, since the lipostat will resist them vigorously. After all, the lower limit is designed to keep us from starving to death, so it has a lot of power behind it.
On the other hand, this person basically doesn’t have to worry about their BMI climbing above 35, since the upper limit is also defended. As long as their lipostat isn’t disrupted any further, they will remain within that range.
However, the heads don’t have to move together. They are at least somewhat independent systems, with separate set points. So another way to become obese is like this:
This person still has a lower limit of BMI 20, just like the healthy person in the first example. But they have an upper limit of BMI 35, as high as than the obese person in the second example!
This person is sometimes obese. On the one hand, unlike a person with a healthy lipostat, there’s nothing to keep this person’s weight from drifting up to a BMI as high as 35. So if they’re not “careful”, if they eat freely and without particular attention, sometimes it will.
But on the other hand, there’s nothing keeping this person from driving their BMI as low as 20, by doing nothing but eating less and exercising more. They don’t risk hitting a starvation response until they are well into the healthy BMI range, so they have little difficulty losing weight when they want to.
Lots of people find it really hard to lose weight. But you also encounter a lot of people who say things like, “when I was overweight I just decided to lose some weight, counted calories for a while, and made it happen, and it wasn’t that hard.” The double-headed model may explain the difference. Calorie-counters who sometimes drift upwards but can easily lower their weight on a whim have an altered upper threshold but a healthy lower threshold, while everyone else has had both their upper and lower thresholds pushed to obese new set points, and they face massive biological resistance when they try to return to a lower BMI.
Slightly Complicated
Our friend and colleague ExFatLoss likes to describe obesity as a slightly complicated problem. No one has solved obesity yet, but it doesn’t seem totally chaotic, so maybe there are just a few weird things that we’re missing. We agree that this seems likely, and one way that obesity could be slightly complicated is if different things are causing changes to the thresholds of the upper and lower heads of our lipostats.
To take a traditional example, perhaps eating lots of sugar raises your upper threshold, and eating lots of fat raises your lower threshold. In this model, if you eat lots of sugar but not lots of fat, your weight might drift up, but you can still control it. If you eat lots of fat, your weight is pushed up and can’t be pushed back down.
To take an example that seems more plausible to us, maybe one contaminant raises the upper threshold of your lipostat, and a different contaminant raises the lower threshold. Perhaps phthalates raise your upper threshold. This wouldn’t be very noticeable by itself, because you could still control your weight with diet and exercise. But maybe on top of that, exposure to lithium raises your lower threshold. This would keep you from pushing your weight back down. In combination, exposure to both contaminants would force you into obesity. (We should stress that this is a hypothetical, we have no idea whether these particular contaminants affect one head, or both, or neither.)
So much for things being slightly complicated. One way that obesity could be very complicated is if there are not just two heads, but lots of them, maybe dozens. This is almost certainly the case. Biology tends to be massively redundant, so the most likely scenario is that the body has several different ways of measuring your body fat, and each of these measures probably has its own control systems. So you probably have many “upper” and “lower” thresholds, all interacting. It might look something like this:
In this case, there are five heads making for five thresholds. The black thresholds have been forced wide open, defending a healthy lower BMI but a pretty high upper BMI. The red threshold is an additional lower defense, trying to keep BMI above 21. And the white thresholds are fixed to defending a range that’s solidly overweight to obese. This person is most likely to end up somewhere in the range that’s darkest blue, but could see movement all over the place. They won’t face serious resistance unless they try to push their BMI above 35 or below 20. But anything that raised the set point for that red threshold or the bottom black threshold would seriously limit their ability to stay lean.
Again, even this more complicated example is probably an oversimplification. While these models are good for illustration, real biology almost certainly involves more than 5 heads, defending lots of different thresholds in many different ways.
Your biology defending various thresholds with its many heads.
There is at least one other way in which a person could become obese. As before, you could set the lower limit quite high, say to keep a person’s BMI above 31. Then you could set the upper limit below the lower limit, like so:
The behavior of such a system is left as an exercise for the reader.
[1]: The systems engineer and control theorist William T. Powers explains this idea in Chapter 5 of his book Behavior: The Control of Perception:
The “reference signal” is a neural current having some magnitude. It is assumed to be generated elsewhere in the nervous system. It is a reference signal not because of anything special about it, but because it enters a “comparator” that also receives the perceptual signal. …
The comparator is a subtractor. The perceptual signal enters in the inhibitory sense (minus sign), and the reference signal enters in the excitatory sense (positive sign). The resulting “error signal” has a magnitude proportional to the algebraic sum of these two neural currents — which means that when perceptual and reference signals are equal, the error signal will be zero. If both signs are reversed at the inputs of the comparator, the result will be the same. The reader may wish to remind himself here of how a neural-current subtractor works by designing a comparator that will generate one output signal for positive errors, and another for negative errors. (This is necessary because neural currents cannot change sign.)