A Chemical Hunger – Part VII: Lithium

[PART I – MYSTERIES]
[PART II – CURRENT THEORIES OF OBESITY ARE INADEQUATE]
[PART III – ENVIRONMENTAL CONTAMINANTS]
[INTERLUDE A – CICO KILLER, QU’EST-CE QUE C’EST?]
[PART IV – CRITERIA]
[PART V – LIVESTOCK ANTIBIOTICS]
[INTERLUDE B – THE NUTRIENT SLUDGE DIET]
[PART VI – PFAS]

Lithium is the third element on the periodic table, the lightest metal, a hit Nirvana single, and a mood-stabilizing drug often used to treat bipolar disorder.

Lithium isn’t synthetic, of course, but it can still be an environmental contaminant. While it occurs naturally in small concentrations in groundwater, human activity might have led to serious increases over the past few decades.

Unlike the other contaminants we’ve reviewed, we don’t need to spend any time convincing you that lithium makes people gain weight: it does. Almost everyone who takes lithium at therapeutic levels gains some weight. About half of them report serious weight gain, on average 22 lbs (10kg), and about 20% of patients gain more than that. Weight gained is correlated (r = .44, p < .001) with dosage. Unsurprisingly, weight gain on lithium is related to an increase in leptin levels.

We’d love to tell you whether lithium concentrations in groundwater have increased over time. But while lithium is easy to detect, assessing lithium levels is not a part of the standard analysis of drinking water, so we don’t have reliable historical data to work with. There aren’t even EPA standards for lithium levels in drinking water.

We’d also like to tell you about how much lithium people are exposed to, and whether that has increased over the past several decades. Measuring serum lithium is relatively easy, and people who are starting lithium treatment get checked frequently to make sure that their blood levels aren’t too high. Despite this, there doesn’t seem to be any data on serum lithium levels in the general population. The NHANES data has records of how much uranium there was in your urine every year from 2000-2016, but not a single measure related to lithium. Great job, guys.

We can’t talk about trends in the groundwater or in people’s bodies directly. But what we can do is look at other trends that we would expect to be related. For example, this figure shows a graph of USGS-reported records for global lithium production since 1900:

Graph showing world lithium production from 1900 to 2007, by deposit type and year. The layers of the graph are placed one above the other, forming a cumulative total. Reproduced from USGS.

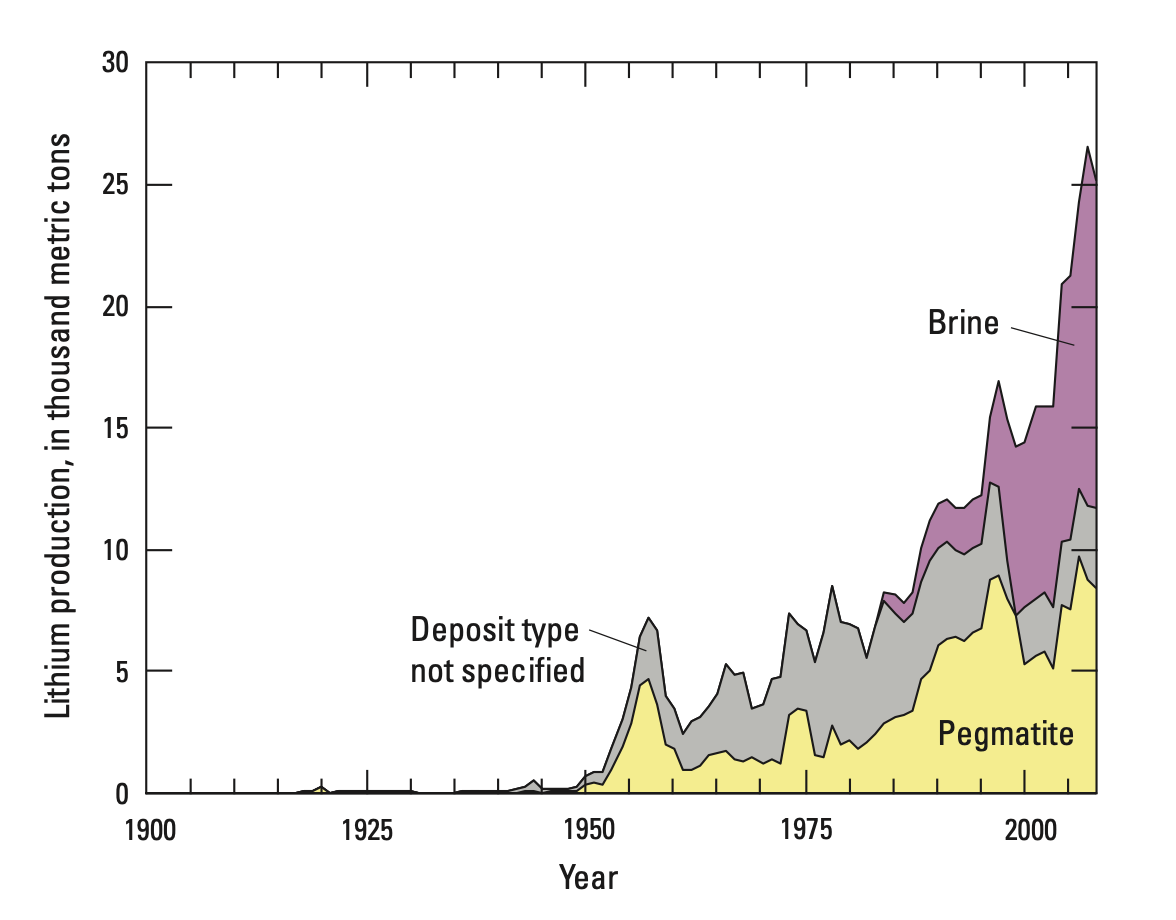
This graph is pretty telling. Almost no lithium was produced before 1950, so human activity couldn’t have been adding a meaningful amount to the groundwater back then. Serious lithium production started around 1950, which could help explain why obesity went from about 3% in 1890 to about 10% in 1980, but we see that lithium production truly spikes around 1980. While there have been a few ups and downs, production has as a rule continued to rise ever since. This graph only goes up to 2007, but USGS and other sources confirm that production has continued to increase, at about 11% per year from 2007 to 2017.

Lithium definitely ends up in the groundwater. It’s there in small concentrations naturally, but human activity adds more. In Seoul, South Korea, lithium concentrations sextuple as the Han river passes through the city’s densest districts. This is reflected not only in the river, but also in the tap water in the city — tap water from sites further along the river’s course have similarly elevated lithium levels.

This suggests that rivers pick up lithium along their course and generally have higher lithium levels as they flow downhill. This is supported by data from Austria, which shows that lithium levels in drinking water vary systematically with altitude, with higher concentrations of lithium found in districts at lower altitudes:

Lithium levels (mg/L) and altitude (meters) in Austria

We should note that a paper looking at groundwater in the United States from 1992-2003 found the opposite effect: higher levels of lithium at higher altitudes. “However,” they say, “these findings should be interpreted with caution.” We agree. There are 3,141 counties in the United States, and they only looked at data from 518. They only examined data from 15 states, most of them states at relatively low elevation. These weren’t randomly selected, either; they were the sites with the highest number of lithium samples in the years 1992-2003.

We’ve already discussed the issues that come up when you conduct analysis on a restricted range of data. Further, the Seoul data shows that lithium levels spike around urban areas. If some of the high-altitude measurements were near or immediately downstream from cities or manufacturing areas, that might make it look like higher-altitude locations have higher levels of lithium on average.

Dosage

The therapeutic dose of lithium in blood serum is usually considered to be in the range of 0.8 – 1.2 mmol/L, though some sources suggest that lower doses are more effective, with the “minimum efficacious serum lithium level” being possibly as low as 0.4 mmol/L. To translate these to more familiar terms, 0.8 mmol/L is about 5600 ng/mL, and 0.4 mmol/L is about 2800 ng/mL.

That’s quite a lot. In comparison, lithium levels in groundwater rarely exceed 200 ng/mL. But perhaps surprisingly, even very low levels can have an influence on our health and mental states. One study examining data from 27 Texas counties between 1978-1987 found that rates of suicide and homicide (as well as other forms of violent and impulsive behavior) were negatively correlated with lithium in drinking water, over water lithium levels ranging from 70 to 170 ng/mL. Another study looking at various cities in Lithiuania (no relation to lithium) found a negative relationship between lithium exposure and suicide. The lithium levels in the public drinking water systems they examined ranged from 0.5 to 35.5 ng/mL, with a median level of 3.6 ng/mL. In general, reviews of this literature find that trace levels of lithium have a meaningful impact on behavior.

There’s only one randomized controlled trial examining the effects of trace amounts of lithium, but it finds the same thing. A group of former drug users (heroin, crystal meth, PCP, and cocaine), most of them with a history of violent crime or domestic violence, were given either 400 µg per day of lithium orally, or a placebo. For comparison, a normal clinical dose is 300,000 – 600,000 µg, taken two to three times per day. Even on this comparatively tiny dose, everyone in the lithium group reported feeling happier, more friendly, more kind, less grouchy, etc. over a four week period, “without exception”. 

(These former drug users didn’t have normal moods to begin with — one said “I am always extremely moody and fight with my girlfriend frequently” before he was treated — so it’s not clear if trace amounts of lithium would improve mood in everyone else. Similarly, therapeutic doses are only given to patients with bipolar disorder, and it’s not clear what the effects would be on someone without this diagnosis.)

In the placebo group, people were just about as grouchy as before. When they switched the placebo group over to lithium, these people responded in exactly the same way.

This is pretty strong evidence that even very small doses of lithium can have meaningful effects. So should we be surprised that they don’t mention any weight gain? There isn’t much data on the time course of weight gain in lithium treatment, but it seems to come on pretty fast. In one study with normal therapeutic doses, 15 bipolar inpatients gained an average of 13 lbs (5.9 kg) over six weeks. While the sample size is quite small, this tells us that sometimes a lot of weight gain can happen fast.

We don’t think this is a huge problem. The randomized controlled trial on trace exposure only lasted a couple of weeks. Even if patients were gaining weight at the same rate as patients on a therapeutic dose, they might not have noticed. The researchers didn’t intend to examine weight gain, and probably didn’t measure it. They don’t report any other side effects. Heroin, crystal meth, PCP, and cocaine all make people lose weight, so it’s possible that weight gain in the former drug users would be seen as a sign of health. It’s also worth noting that while these trace amounts do appear to have real, consequential effects, the dosage was about 1,000 times smaller than a therapeutic dose. In this situation, it’s not crazy to think that weight gain might take a few weeks or even months to manifest. We see a version of the main effect — improved mood — in this tiny dose. It seems reasonable that we might see a version of this side effect as well.

This study can give us a lower limit not only of the dosage, but by extension, of the minimum effective serum level. As a ballpark estimate, therapeutic dosages are in the range of 1,000,000 µg per day and they lead to serum levels of around 5000 ng/mL. This means the 400 µg per day dose from the randomized controlled trial would lead to a serum level of around 2 ng/mL. Other sources suggest that blood levels may end up slightly higher on low doses. For example, doses in the range of 385 to 1540 µg per day lead to serum levels around 7 to 28 ng/mL. One study testing serum lithium as a compliance marker for food and supplement intake found that giving people lithium-tagged yogurt with a dose of about 1000 µg per day over a period of six weeks led to an increase in serum levels from 6 ng/mL to 46 ng/mL.

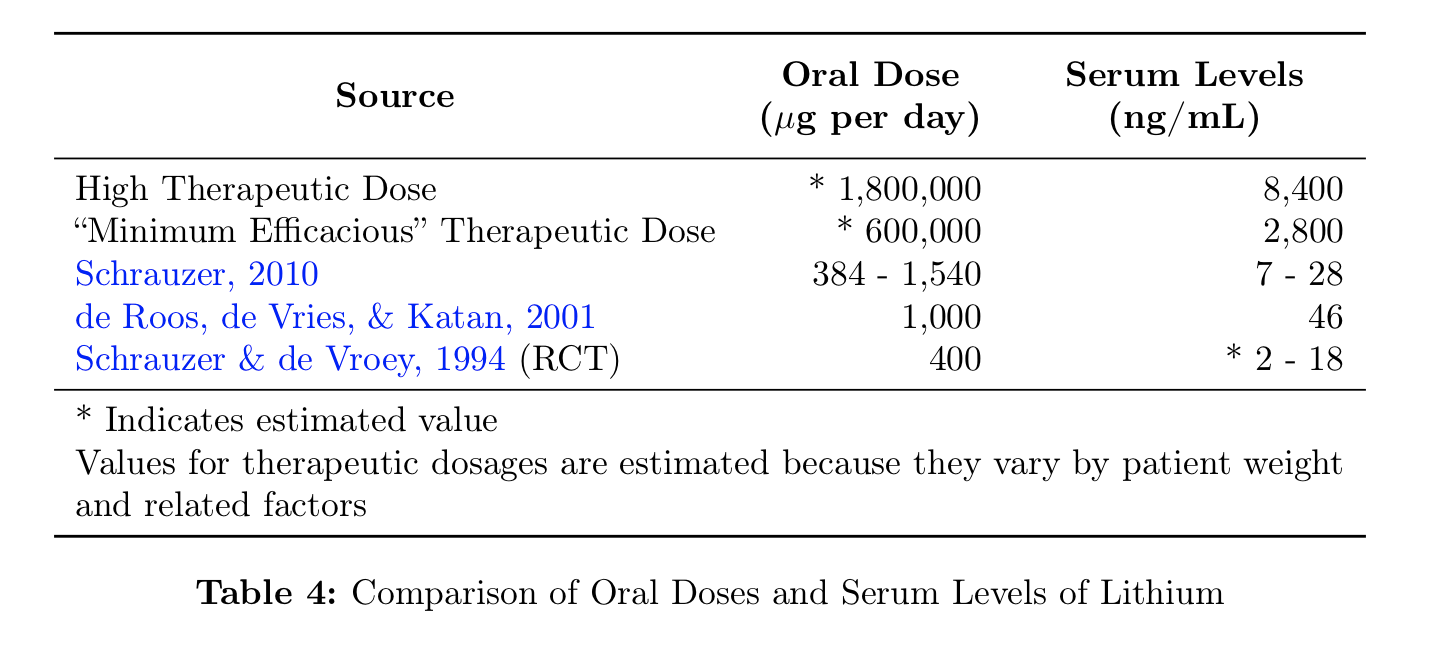
These papers disagree on the specifics but they agree on the general picture. A serum level in the range of 10 ng/mL is enough to influence mood, and a dose of about 400 µg per day is enough to get you there. Whether lower doses have an effect is unclear, but we should certainly be interested in numbers in these ranges and up.

Trace Exposure

There aren’t any other randomized controlled trials, but if trace amounts are enough to cause obesity, then we should see relationships between trace lithium levels and obesity rates.

In Texas, a survey of mean lithium levels in public wells across 226 counties (Texas has 254 in total) found lithium levels ranging from 2.8 to 219.0 ng/mL. Now Texas is not one of the most obese states — but it tends to be more obese along its border with Lousiana, which is also where the highest levels of lithium were reported.

West Virginia and Alabama, on the other hand, are two of the most obese states in the nation. We haven’t been able to find any reliable groundwater concentration data for these states, but we can certainly note that both of them have problems with lithium contamination coming from local mining operations. And it’s not just Alabama and West Virginiaother states are facing similar contamination.

In Greece, lithium levels in drinking water range from 0.1 ng/mL in Chios island to 121 ng/mL on the island of Samos, with an average of 11.1 ng/mL. Unfortunately there’s not much data on the prevalence of obesity in Greece, but we can conduct some due diligence by checking a few of these endpoints. Samos, with the highest levels, is the obvious place to start. On Samos, 10.7% of children aged 3-12 are overweight, compared to 6.5% on the island of Corfu. A full 27% of high schoolers on Samos island were overweight in 2010, and 12.4% were obese. In comparison, about 12.5% of American high schoolers were obese in the same period.

In the Caspian Sea, lithium concentrations are 280 ng/mL. As we’ve already reviewed, some of the most obese provinces in Iran border the Caspian. The Dead Sea has concentrations even higher, at 14,000 ng/mL, but for the obvious reasons, we don’t think people are getting a lot of their drinking water from the Dead Sea. On the other hand, obesity in the West Bank is pretty high — as high as 50% in men in 2003!

Very high concentrations of lithium have also been reported in Austria. For the most part, Austria has normal amounts of lithium in its drinking water, around 13 ng/mL. But in the east, the concentrations are much higher. In the Mistelbach district, the average level of lithium in the drinking water was 82 ng/mL, and the highest single measurement was near Graz, at 1300 ng/mL. Both of these are in eastern Austria, where obesity levels are highest. Mistelbach in particular is one of the most obese districts in the country.

Chile and Argentina are the most obese countries in South America (28% each) and are two of the biggest exporters of lithium in the world. Unsurprisingly, this is reflected in their groundwater.

In northern Chile, lithium levels in the groundwater can reach levels 10,000 times higher than normal. The rivers running through many small valleys see lithium concentrations of 600 – 1600 ng/mL. The drinking water in many towns has levels up to 700 ng/mL. And in the headwaters of the Rio Camerones, lithium hits concentrations of 24,880 ng/mL. In 1980, Zaldivar reported similar levels of lithium in the groundwater, stating that they were “the highest reported in the world”. He also measured serum levels in people at these different sites, and found values ranging from 22.3 ng/mL to 85.8 ng/mL.

(“We tried to find Zaldivar to learn more about his work,” says a later paper, “but to no avail. He left Chile when Pinochet came to power and effectively disappeared.”)

In Argentina, lithium can reach up to 1000 ng/mL in drinking water, and the locals end up with a lot of exposure. At the site with the highest levels, lithium concentrations reached an average of 4,550 ng/mL in people’s urine. The highest level in someone’s urine was actually a whopping 14,300 ng/mL. The locals seem to be getting much of their lithium exposure from their tap water, as the amount of lithium in urine was correlated with the number of glasses of water consumed per day (r = 0.173, p = 0.029).

These are all freshwater levels. In seawater, lithium concentrations are reliably quite high, ranging from 100 ng/mL to over 1000 ng/mL. Now, most people are not actually drinking meaningful amounts of seawater, but if you live near the ocean, you might still be exposed indirectly.

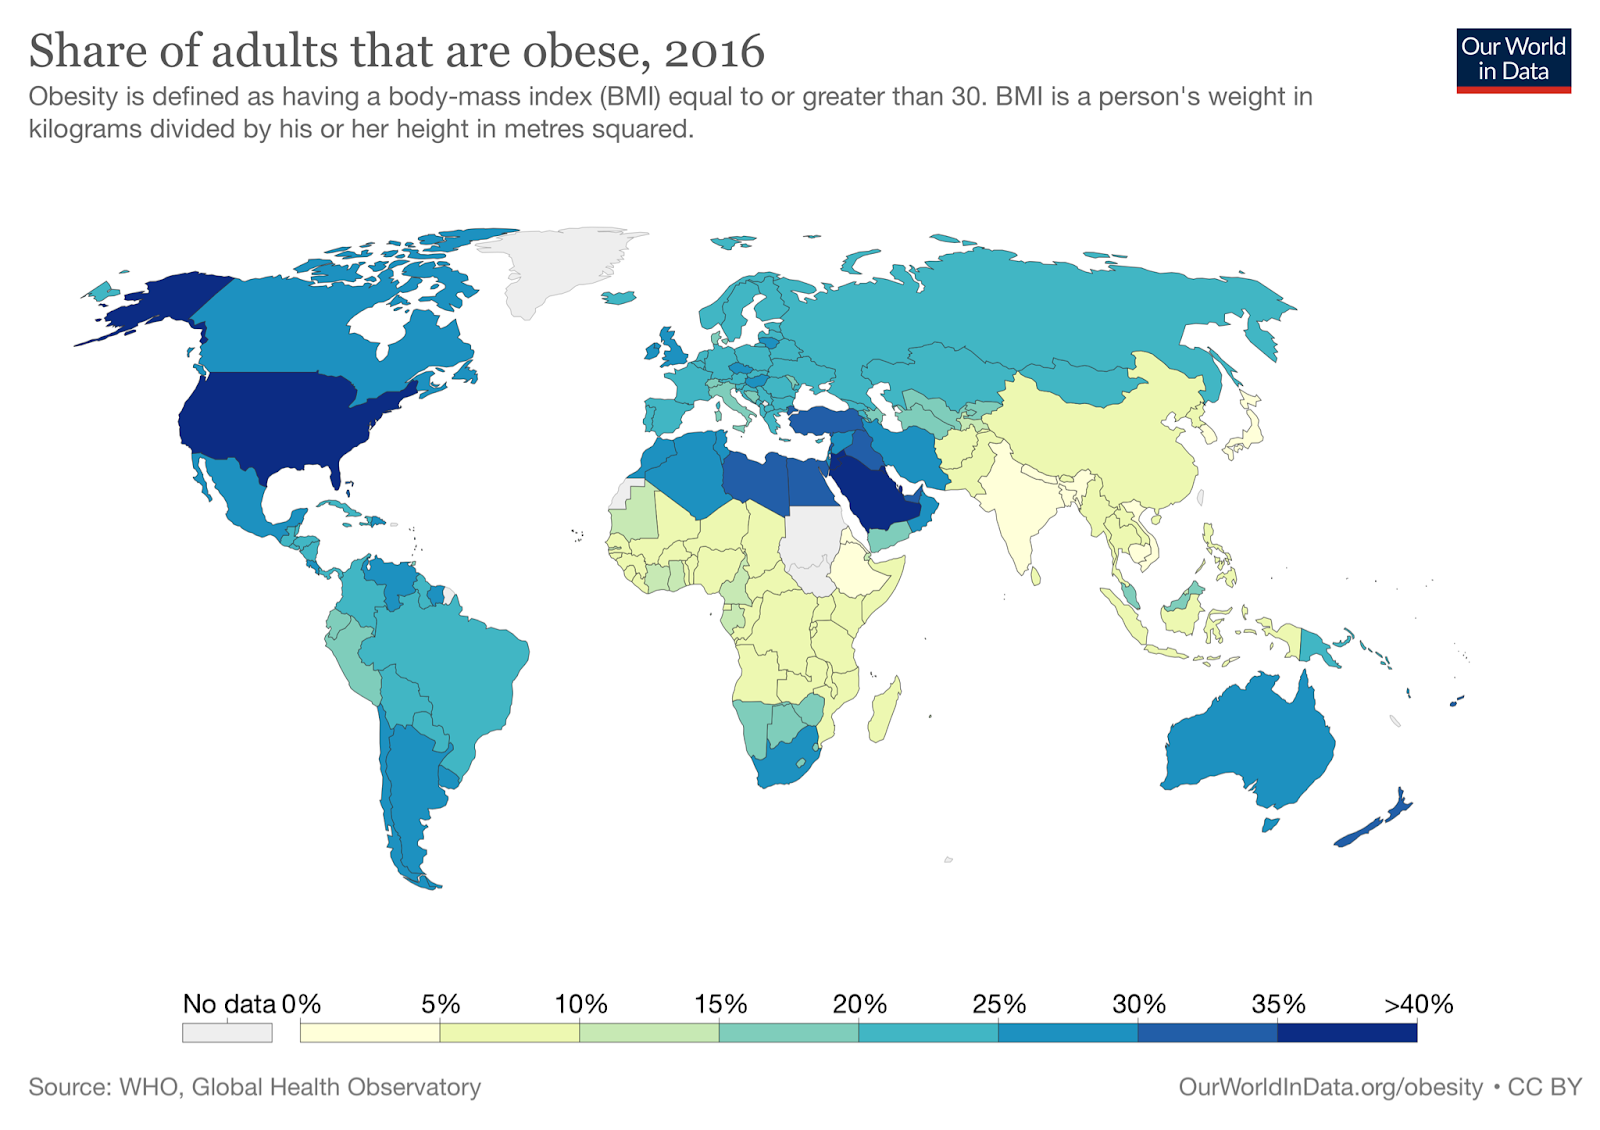
One mystery we haven’t mentioned yet is that the Middle East is extremely obese (see map below), one of the most obese regions on earth. Jordan, Qatar, Libya, Egypt, Lebanon, and Saudi Arabia all barely trail the United States in terms of obesity, and Kuwait is actually slightly more obese than the United States, about 38% obese compared to 36% in America. These countries are very dry, and so all of them get a lot of drinking water from desalinated seawater. Saudi Arabia gets about half of its drinking water from desalination and is one of the most obese nations on earth. Kuwait built its first desalination plant in 1951, and has actually been one of the most obese countries in the world for a long time. Back in 1975, when the rate of obesity in the United States was around 10%, the rate of obesity in Kuwait was about 18%.

Share of Adults that are Obese, 2016. Reproduced from ourworldindata.org/obesity under the CC BY 4.0 license.

Desalination removes all trace elements from seawater, but because distilled water corrodes metal pipes and trace elements are important to health, the desalinated water is remineralized by blending it with 5-10% brackish water. This means that desalinated water could easily have lithium concentrations of up to 100 ng/mL. Unlike contamination in some forms of drinking water, which might vary with factors like rainfall and industrial activity, we would expect lithium levels to be reliably high in desalinated water, because they are inherent to the source.

We even have some data about lithium levels in the waters of the Persian Gulf. Near Qeshm island, at least, seawater concentrations vary somewhat by season but are usually around 300 ng/mL. This is reasonably high for seawater and much higher than the levels usually observed in groundwater. Not all of that makes it back into the water after desalination, of course, but even if only 10% got back in, 30 ng/mL is still a pretty high dose to be receiving regularly.

(If you are a Kuwaiti or Saudi desalination engineer, please contact us! This blog has gotten 15 views from Kuwait and 26 from Saudi Arabia, we know you’re out there!)

In any case, if lithium from desalinated seawater doesn’t explain why the Middle East has such incredibly high rates of obesity, then some other explanation will have to be found for this extremely striking observation.

On average, people drink about 3 liters of water per day. If they’re drinking from a normal freshwater source with 1-10 ng/mL, they’ll get a dose of about 3-30 µg / day. If they’re drinking from desalinated seawater, with concentrations of about 30-100 ng/mL, they’ll get a dose of about 90-300 µg / day. If they’re drinking from sources like those found in Texas, Greece, and Mistelbach, with concentrations of about 100-200 ng/mL, they’ll get a dose of about 300-600 µg / day. If they’re drinking from sources like those found in Graz, Chile, and Argentina, with 1000 ng/mL, they’ll easily get a dose of 3000 µg / day or more:

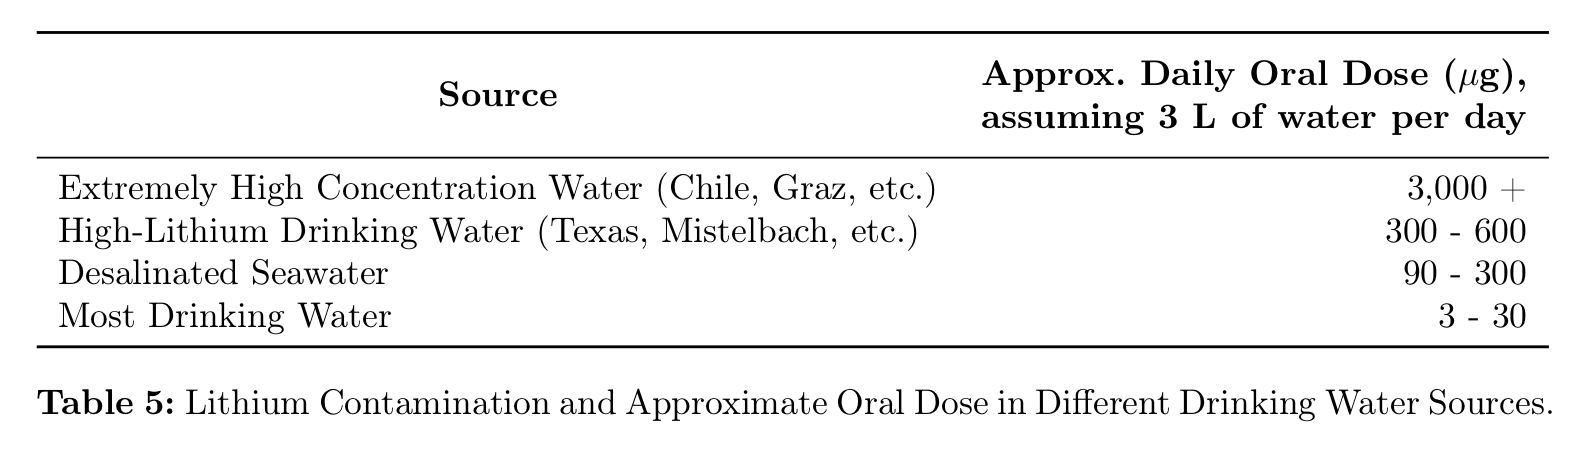
In comparison, therapeutic doses are in the range of 1,000,000 µg per day, but remember the randomized controlled trial showed effects at only 400 µg per day. Many people are getting doses of similar amounts from their drinking water alone. And this is assuming that they’re not also exposed to lithium in other ways.

Common Uses of Lithium

Which they probably are, because lithium has a wide variety of applications. In 2017, the USGS estimated that 48% of the global market for lithium was batteries, 26% was ceramics and glass, 7% was lubricating greases, the remainder being industrial uses like polymer production and air treatment. They also mention a couple uses like “agrochemicals”, airbag ignition, aluminum alloys, cement and concrete additives, and dyes and pigments.

You’ll remember from our review in the PFAS section that some of the most obese professions include firefighters, cooks, food workers, cleaning workers, motor vehicle operators, vehicle mechanics, transportation and material moving, healthcare support, health technicians, and some construction occupations (“Helpers, construction trades” and “Other construction and related workers”).

If you go and see your local auto mechanic, the black smears covering his hands and forearms might be engine oil. But they might also be lithium grease. This grease is ubiquitous in auto engineering, routinely applied to hinges, joints, and pivot points. It’s used in aviation and on many kinds of heavy machinery, including logging and construction equipment, trains, and tractors. It also has a number of household applications. You might put it on your garage door, or the hinges on the gate of your fence. About 7% of the global supply of lithium goes into lubricating greases of one kind or another. That’s a lot of grease.

In addition to any lithium they’re exposed to in their food and water, vehicle mechanics, truck drivers, and transportation workers are also constantly exposed to lithium grease at work. They may literally be rubbing the grease all over their hands. Like any grease, this is hard to get off your skin, in most cases requiring a special soap. Hopefully they keep it out of their eyes and mouth, but even so, it doesn’t seem like it would be great for you.

Construction workers also use lithium grease to lubricate their tools and equipment. They may be exposed through lithium added to concrete and cement. Lithium is used in agrochemicals like pesticides, though information on exactly what agrochemicals this includes is spotty. It’s possible that this explains the higher levels of obesity in cooks and food workers.

Lithium grease isn’t considered food-safe, and in theory it shouldn’t be used on food-handling equipment. In practice, however, manufacturers and restaurants don’t always follow regulations. A quick Google search reveals incidents like lithium grease being stored with food equipment, lithium grease being stored next to garlic bulbs, and lithium grease being stored above mustard.

It’s not clear if there’s a connection with healthcare professionals, firefighters, or cleaning workers. Maybe there’s a hidden lithium connection out there. But there doesn’t have to be. Lithium may just be part of the story — the rest could be explained by other contaminants, like PFAS.

And speaking of PFAS, there’s actually a connection. Lithium greases often include other substances to improve their performance, including Teflon, aka PTFE.

Bioaccumulation

One strike against lithium as an explanation for the obesity epidemic is that it only stays in the body for a few days, with a half-life of 18-36 hours. The medical consensus seems to be that it probably doesn’t bioaccumulate.

But this may not be a problem, for a few reasons. First, lithium may be able to affect weight without accumulating in the body. One possible mechanism by which environmental contaminants could cause obesity is by interfering with the microbiome. If exposure to lithium changes the composition of your gut microbiota, then exposure to lithium could have serious impacts on your weight without any bioaccumulation. Even brief exposure to lithium could have long-lasting effects. And in fact there is evidence that dietary lithium affects the microbiome, at least in rats.

Second, the medical consensus might simply be wrong. While lithium is traditionally measured in the serum, this may not be the best way to evaluate bioaccumulation. “In contrast to other psychotherapeutic drugs,” says one paper on the pharmacokinetics of lithium, “Li+ is fairly evenly distributed in the body, but in tissues such as the white matter of the brain, the bones, and in the thyroid gland the concentrations per kg wet weight are about twice those in the serum.” 

A particularly interesting example is a case study of a patient who died after lithium poisoning. Researchers found that most tissue samples (“liver, spleen, kidney, lung, muscle, cardiac muscle, pancreas”) contained about the same concentration of lithium as found in the serum, in the range of 0.4-0.6 mmol/kg. But in the thyroid gland and in brain tissue (especially white matter), lithium concentrations were nearly twice as high as in serum, in the range of 0.7-0.8 mmol/kg. They suggest that this is to be expected, saying, “lithium has an increased affinity to thyroid tissue,” and, “high concentrations of lithium in brain tissue – especially in white substance – agrees with investigations that reveal the lithium elimination from brain tissue to be slow.”

This is particularly interesting not only because it seems to show evidence of bioaccumulation, but because of the particular tissues in which concentrations were found to be highest. The thyroid gland is very important to weight regulation, and so to find that lithium concentrations in that organ were second-highest in the body is very neatly in line with our expectations. Maybe it shouldn’t be a surprise, because lithium therapy is associated with thyroid disease.

For a while this was the best evidence of lithium accumulation in the brain, but a few weeks ago our friend Dr. Grace Rosen sent us this Nature paper published in March 2021. In this paper, the authors took 139 brain samples from three deceased individuals and took them to a nuclear reactor in Bavaria, where they were placed in a chamber and shot with a “well focused beam of cold neutrons with a neutron flux of ɸ = 1.2 × 1010 cm−2 s−1”. The lithium-neutron interaction gives a unique “associated coincident energy pattern”, which allowed them to measure the amount of lithium at different sites in the brains. Unsurprisingly, the patient receiving lithium therapy at the time of death had the highest concentration, but the brains of the other two individuals did as well, presumably from trace exposure.

Just like the case study above, they found that lithium was more concentrated in white than in gray matter. Additionally, the authors note that lithium concentrations were especially high in the thalamus and Brodmann Area 25. This is interesting for our purposes because Brodmann Area 25 “influences changes in appetite and sleep” and the thalamus governs “sensory relay in visual, auditory, somatosensory, and gustatory systems.” Both of these brain regions are related to eating behavior.

Sadly the authors did not examine any samples from the hypothalamus, which governs eating more directly, but this is still evidence that trace lithium bioaccumulates in brain regions that are important to the regulation of food intake and body weight.


[Next Time: HIGHLIGHTS FROM THE COMMENTS]


A Chemical Hunger – Part VI: PFAS

[PART I – MYSTERIES]
[PART II – CURRENT THEORIES OF OBESITY ARE INADEQUATE]
[PART III – ENVIRONMENTAL CONTAMINANTS]
[INTERLUDE A – CICO KILLER, QU’EST-CE QUE C’EST?]
[PART IV – CRITERIA]
[PART V – LIVESTOCK ANTIBIOTICS]
[INTERLUDE B – THE NUTRIENT SLUDGE DIET]

Per- and polyfluoroalkyl substances (PFAS) are a group of synthetic chemicals that are used to make a wide variety of everyday products, including food packaging, carpets, rugs, upholstered furniture, nonstick cookware, water-repellant outdoor gear like tents and jackets, firefighting foams, ski wax, clothing, and cleaning products. Many are also used in industrial, aerospace, construction, automotive, and electronic applications.

The PFAS family is enormous, containing over 5,000 different compounds. But only a couple of these compounds are well-studied. The rest remain rather mysterious. Perfluorooctanoic acid (PFOA) and perfluorooctane sulfonate (PFOS) are two of the original PFAS, are especially widespread in the environment, and we tend to have the most information on them.

PFAS are practically indestructible. They repel oil and water and are heat-resistant, which is part of why they have so many applications, but these features also ensure that they degrade very slowly in the environment, if they degrade at all. Short-chain PFAS have half-lives of 1-2 years, but longer-chain equivalents like PFOS are stable enough that we haven’t been able to determine their half-life. As a result, they stick around in the environment for a very long time, and soon make their way into soil and groundwater. The full picture is complicated, but there’s evidence that they accumulate in rivers as they flow towards the ocean.

They not only stick around for a long time in the environment, they stick around for a long time in your body. If you’re reading this, there’s probably PFAS in your blood. A CDC report from 2015 found PFAS in the blood of 97% of Americans, and a 2019 NRDC report found that the half-life of PFAS in the human body is on the order of years. They estimate 2.3 – 3.8 years for PFOA, 5.4 years for PFOS, 8.5 years for PFHxS, and 2.5 – 4.3 years for PFNA. “PFOS, PFNA, PFHxS, and related PFAS,” they write, “are known to bioaccumulate in the bodies of people of all ages, even before birth.”

How do these chemicals get into our bodies? Every route imaginable. “People are concurrently exposed to dozens of PFAS chemicals daily,” the NRDC report explains, “through their drinking water, food, air, indoor dust, carpets, furniture, personal care products, and clothing. As a result, PFAS are now present throughout our environment and in the bodies of virtually all Americans.” Looking at one map of PFAS measurements, we see that PFAS has been detected at military sites in 49 states (no measurements given for Hawaii) and in drinking water in Utqiagvik, Alaska, the northernmost incorporated place in the United States. Unfortunately, only a few states have done comprehensive testing.

This exposure isn’t just limited to humans. There’s bioaccumulation in the remote lichen-caribou-wolf food chain in northern Canada, and in part of the Arctic Ocean, with animals higher in the food chain showing higher concentrations of PFAS in their bodies. 

If we look at the history of PFAS (below), we see that the timeline for PFAS introduction lines up pretty well with the timeline for the obesity epidemic. PFAS were invented in the 1930s, 40s, and 50s, and were rolled out over the next couple decades. This gave them some time to build up in people’s bodies and in the environment. By the 1980’s many types, including some new compounds, were in circulation. In the 2000s, some of them began to be banned, but many of them are still widely used. After all, there are more than 5,000 of them, so it’s hard to keep track.

Discovery and manufacturing history of select PFAS.

A study from the Red Cross worked with blood donor data and measured serum levels in samples from 2000-2001 and plasma levels in samples from 2006, 2010, and 2015. In general, they found serious declines in serum levels of the PFAS they examined. For example, the average PFOS concentrations went from 35.1 ng/mL to 4.3 ng/mL, a decline of 88%, and PFNA concentrations went from 0.6 ng/mL to 0.4 ng/mL, a decline of 33%. The National Health and Nutrition Examination Survey (NHANES) data from the same period matches these trends pretty closely.

These studies show that levels of PFAS in American blood are declining, but they’re only looking at the PFAS that we already know are declining. Many of these PFAS are no longer in production. PFOS and PFOA, among other compounds, were phased out in the US between 2006 and 2015. But new compounds with similar structures were brought in to replace them. The companies that make these compounds say that the new PFAS are safer, but unsurprisingly this is very controversial.

Notably absent from both the Red Cross and the NHANES data is PTFE. This is somewhat surprising given that it is the original PFAS, and it is still in production. Granted, many sources claim that PTFE is extremely inert — including the paper Polytetrafluoroethylene Ingestion as a Way to Increase Food Volume and Hence Satiety Without Increasing Calorie Content, which goes on to argue that we should replace 25% of our food with Teflon (PTFE) powder so that we feel more full while eating fewer calories, which they say will help us make “the leap into the realm of zero calorie foods.” Personally, we’d stick to celery.

Maybe PTFE really is that inert. (We find it a little hard to believe. “Word was that the compounds were inert,” said one scientist of his choice not to study PFOA and PFOS in 2000.) Either way, the safety research on these substances is pretty ridiculous. Usually the exposure period is very short and the dose is extremely high. This may be relevant to exposure for industrial workers, but it doesn’t tell us much about the long-term effects of relatively low doses on the rest of us.

Advertisement for the Happy Pan, a Teflon-coated pan from the 1960s.

In one study they gave monkeys various amounts of PFOS for 182 days, and found “significant adverse effects” only in the 0.75 mg/kg/day dose group. Effects in this group included “mortality in 2 of 6 male monkeys, decreased body weights, increased liver weights, lowered serum total cholesterol, lowered triiodothyronine concentrations (without evidence of hypothyroidism), and lowered estradiol levels.”

This is interesting, but there are some problems. First of all, 0.75 mg/kg/day is an insanely high dose. Serum concentrations in the 0.15 mg/kg/day dosage group were 82,600 ng/mL for males and 66,800 ng/mL for females. The comparable rate in human blood samples is about 20-30 ng/mL. Second, 182 days is not a very long or realistic exposure period for most humans.

At these extremely high, short-term doses, weight loss is actually a relatively common side effect. This is the opposite of obesity, of course, but it does suggest that PFAS can affect body weight.

The type of exposure might make the difference. Mice have very different developmental trajectories than we do, but mice exposed to low doses of PFOA in-utero had higher body weights at low exposures, while mice exposed to high doses as adults lost weight. ”Exposure during adulthood was not associated with later-life body weight effects,” they write, “whereas low-dose developmental exposure led to greater weight in adulthood and increased serum leptin and insulin levels. Animals exposed to higher doses of PFOA, on the other hand, had decreased weight.” Note also that while half-life of PFOA in humans is about 3.8 years, in mice it is around 18 days.

A study of 665 pregnant Danish women, recruited in 1988–1989 with the researchers following up with the children 20 years later, found that in-utero PFOA exposure was related to greater BMI and waist circumference in female but not in male children. There are some issues with multiple comparisons — they measured more than one PFAS and they subdivided by gender, both of which are degrees of freedom — but the effects are strong enough to survive reasonable corrections for multiple comparisons, and are consistent with the results from mice, so let’s mark this one down as “suggestive”.

Other studies have found small but reliable effects where male babies, but not female babies, were a few grams lighter at birth when their mothers had higher serum PFOS levels. Again this study suffers from multiple comparison issues, but again it is relatively consistent with animal research.

It doesn’t seem likely that the effect in humans can be exclusively prenatal, however, because we know that people often gain weight when they move to a more obese country. There’s pretty good evidence that different environments are exposing you to different levels of contamination, and that it makes a difference.

Your drinking water is not the only way to be exposed. Many foods are contaminated with PFAS. PFAS are also found in clothes, carpets, and upholstered furniture, so you could be exposed even if there’s no PFAS in your diet. If your favorite beer or pasta sauce is bottled at a factory where the water source is high in PFAS, you’ll be exposed even if your own drinking water is uncontaminated. And since most major brands are bottled in more than one location, there wouldn’t even be a reliable by-brand effect—you’d need to track it by factory.

A better way to do this comparison might be between countries. In fact, we see what appears to be a pattern: There’s more PFAS in tapwater in the United States than there is in tapwater in China, and there’s more PFAS in tapwater in China than there is in tapwater in Japan. The pattern isn’t perfect, however: There’s even more PFAS in tapwater in France than in the United States, and more in Japan than in Thailand.

Occupational Hazard

One place you might get a lot of reliable exposure, though, is at your job. Looking at the uses of PFAS, we see that they’re common in:

  • Firefighting foams
  • Cookware and food packaging
  • Paints and varnishes
  • Cleaning products
  • Automotive applications, including components in the engine, fuel systems, and brake systems, as well as automotive interiors like stain-resistant carpets and seats
  • Healthcare applications, both in medical devices like pacemakers and in medical garments, drapes, and curtains

This suggests that if PFAS are linked to obesity, we should expect to see disproportionate levels of obesity in:

  • Firefighters
  • Food workers (especially cooks)
  • Construction workers
  • Professional cleaners
  • Auto mechanics and others who work closely with vehicles
  • Medical professionals who work closely with medical devices and garments / drapes / curtains, though probably not medical desk jobs.

In the 2000’s, the Washington State Department of Labor and Industries surveyed more than 37,000 workers. They found that on average 24.6% of their sample was obese, which we can use as our baseline. The rate of obesity in “protective services”, which includes police, firefighters and emergency responders, was 33.3%. Among cleaning and building services workers, 29.5% were obese. Truck drivers were the most obese group of all, at 38.6%, and mechanics were #5 at 28.9% obese. Health service workers (excluding doctors and nurses) were 28.8% obese. On the other hand, only 20.1% of food preparation workers were obese, and only 19.9% of construction workers:

Table 1: Washington State Department of Labor and Industries Data, 2003-2009

We can also look at national data from US workers in general. Looking at data between 2004 and 2011, we see that the average rate of obesity went from 23.5% in 2004 to 27.6% in 2011, and was 26.2% on average in that range. Unfortunately they break these numbers down by race, so we have to look at each race separately. 

When we look at the occupations of interest for non-hispanic white adults, we see that 30.4% of firefighters, 32.0% of cooks, 35.1% of food processing workers, 29.7% of building cleaning workers (and for some reason a whopping 37.3% of cleaning supervisors), 39.2% of motor vehicle operators, 27.7% of vehicle mechanics, 36.3% of people working in healthcare support, and 29.8% of health technicians were obese (see Table 2 below). Some construction occupations were slightly less obese than average (“Construction trades workers” at 25.0%), and some were much more obese than average (“Helpers, construction trades” and “Other construction and related workers” at 31.2% and 38.6%, respectively).

 Table 2: National Health Interview Survey Data, Non-Hispanic White Adults, 2004-2011

For non-hispanic white adults, individuals with the highest age-adjusted prevalence of obesity were motor vehicle operators, “other construction and related workers”, law enforcement workers, and nursing, psychiatric, and home health aides. It’s not clear why law enforcement workers are in there, but it’s pretty remarkable that the PFAS explanation can predict the other three.

Patterns are largely similar for the other racial groups. Among black female workers, the occupations with the highest age-adjusted prevalence of obesity were health care support (49.2%), transportation and material moving (46.6%), protective service (45.8%), personal care and service (45.9%), community and social services (44.7%), food preparation and serving (44.1%), and health care practitioners and technicians (40.2%). Some of these don’t seem to fit — why is “transportation and material moving” in there? — until you realize that “transportation and material moving” includes air traffic controllers, pilots, and other transportation workers, and you remember that PFAS-based firefighting foams are still widely used at airports.

Overall when we look at professions we would expect to have high exposure to PFAS, we see that workers in those professions are more obese than average. When you look at the professions with the highest rates of obesity, we see that most of them are related to mechanical work, healthcare, cleaning, or firefighting, all professions that have disproportionate exposure to PFAS on the job.

If on-the-job PFAS exposure really does lead to obesity, we should also see higher levels of obesity in people who work with PFAS directly. This is exactly what we find.

In 1993 and 1995, 3M conducted an internal study of PFOA exposure in a group of production workers. In the mid 90s, about 20-25% of the population was obese. About 40% of these workers were obese in 1993, and about 48% were obese in 1995.

Looking closer, they found that the group with the highest amount of PFOA contamination also had the highest BMI. The authors even take a moment to draw attention to this point. “It should be noted,” they say, “that all five employees in 1995 with serum PFOA levels [30,000 ng/mL] had BMIs 28.” BMI was slightly correlated with PFOA contamination (r = .11), though with only 111 people, the correlation was not significant. The authors seem unaware of the implications of this, however, and treat BMI as a confounder for other analyses.

Of course, this was not a normal group. They had insanely high serum PFOA levels, up to 115,000 ng/mL, though a few people had no PFAS in their blood.

A later 3M paper published in 2003 looked at serum levels of both PFOA and PFOS. In these data, there is a very clear relationship between PFOS levels and BMI. Men in the lowest quartile of PFOS exposure (mean 270 ng/mL) have an average BMI of 25.8, while men in the highest quartile of PFOS exposure (mean 2,690 ng/mL) have an average BMI of 27.2. The effect is even more pronounced for female employees. Women in the lowest quartile of PFOS exposure (mean 70 ng/mL) have an average BMI of 22.8, while women in the highest quartile of PFOS exposure (mean 1,510 ng/mL) have an average BMI of 28.7. They don’t report a correlation, but they do say, “the fourth quartile had significantly higher mean values than the first quartile for … BMI.”

Dose-Dependent Relationships in the Population

This is somewhat confusing, however, because PFAS serum levels aren’t all that correlated with BMI in the general population. This paper on 2003-2004 NHANES data (a large sample intended to be nationally representative) looked at PFAS concentrations in a final sample of 640 (down from 2,368) people and found only weak evidence of PFAS having an influence on body weight. The strongest relationship they report is for PFOS levels among male participants over 60. Some analyses even report significant negative relationships between PFAS levels and BMI.

Both of these approaches, however, are looking at coefficients in regression equations where they have included many covariates. While in principle this technique can be used to adjust for confounders, in practice the resulting estimates are difficult to interpret. Without a strong model of the causal structure involved, it’s hard to know what the relationship between two variables means when it is adjusted by 20 other variables. Including covariates in an unprincipled way can even cause estimates of an effect to reverse direction. It’s not a panacea, and in fact it can be misleading.

The NHANES data is publicly available, so we decided to check for ourselves. Sure enough, PFOS levels aren’t correlated with BMI — though they are correlated with both weight and height individually.

There’s an issue with looking at simple correlations of PFAS levels, of course, because they are highly correlated with one another. If you have high serum levels of one PFAS, you probably also have high serum levels of another. This means that they may interact or mask one another’s effects in potentially complicated ways.

For example, let’s look at PFHS. A quick correlation shows that serum PFHS levels are negatively correlated with BMI. As far as we can tell, no one has ever reported this, but it’s right there in the NHANES data. In the 2003-2004 data, the correlation is r = -0.090, p < .000045. This effect is small but extremely robust — people exposed to more PFHS are slightly skinnier.

PFHS levels are also correlated with PFOS (r = .29). When we look at the relationship between PFOS and BMI controlling for PFHS, the relationship between PFOS and BMI becomes significant, p = .035, showing that people with higher PFOS exposure are more obese.

“Just wait a minute,” you say, “that’s barely significant at all! How many relationships did you look at before you found that, anyways? This sounds a lot like p-hacking.” We had the same concern, which is why it’s great that we have NHANES data from many different years that we can use to validate this result.

We can go backwards to the 1999-2000 data (we can’t use the 2001-2002 data because the PFAS data for that year are missing ID numbers) where we find a significant relationship between PFOS and BMI controlling for PFHS, p = .008. We can also go forwards to the 2005-2006 data, where we also find a significant relationship between PFOS and BMI controlling for PFHS, p = .007. It seems to be pretty reliable. Now, it’s not a huge effect — the influence of PFOS is only about a half a point of BMI for the average person. But that’s a lot more than nothing.

This isn’t the place for doing a full analysis of the relationships between the different PFAS and how they interact. The NHANES doesn’t even measure every kind of PFAS, so we wouldn’t be able to find every relationship. The point is simply that the influence on BMI may be more complicated than a simple association, and this is proof that at least one of these surprises is hiding in publicly available data.

Why is the association so apparent in the 3M workers but harder to detect in the general population? It has to do with the issues with dose-dependence that we identified earlier. The 3M studies are the sort of samples where we should be able to detect a dose-dependent effect, if one exists. The NHANES data, however, is the sort of sample where it should be hard to detect a dose-dependent effect, even if a strong one exists.

The NHANES data is intended to be nationally representative, while the 3M data is looking at a few hundred people at a couple factories. As a result, the 3M sample is much less diverse than the NHANES sample, which means that it will also be less genetically diverse. Since there’s less genetic diversity, genetics will have less influence on people’s body weight. With less variation coming from people’s genetics, there’s less noise for the dose-dependent signal to be lost in, and it will be easier to detect. Looking at other populations that are not so diverse — like pregnant Danish women between 1996 and 2002 or newborn deliveries at the Johns Hopkins Hospital in Baltimore, MD — we also find that PFAS levels are related to BMI. Similarly, a study from 2021 found a dose-dependent relationship between PFOA — but not PFOS — and obesity in children living in the United States.

The 3M studies are also looking at a much wider range of dosages than are observed in the general population. In the 2003-2004 NHANES data, the range of serum PFOA levels was 0.1 to 77 ng/mL, and the range of serum PFOS levels was 0.3 to 435 ng/mL. In comparison, the range of serum PFOA levels in the 1993 and 1995 3M study was 0 to 115,000 ng/mL. In the 2003 3M study, the range of serum PFOA levels was 10 to 12,700 ng/mL and the range of serum PFOS levels was 40 to 10,060 ng/mL. Analyzing a less restricted range makes the correlation more accurate, which is what we see in the 3M data.

In the 3M sample, some employees participated in both 1993 and in 1995, and PFOA serum levels were highly correlated among the 68 employees who appeared in both samples (r = .91, p = 0.0001). This means that levels of exposure were extremely consistent across the two years between the measurements, possibly because people’s level of exposure was related to the role they had in the production process. Normally, it takes a while for someone’s weight to catch up to the dose of a compound that influences their weight — this is clear from studies of weight gain in people taking antipsychotics. But the 3M employees had serum levels that had been stable for many years. We should expect this to reduce noise and make the correlation between serum levels and BMI more accurate, and it appears to have done just that.

Other Considerations

Dose-dependence is strong evidence that PFAS are a contributor to the obesity epidemic. Is there any other lingering evidence?

One paper looking at a dieting study from 2003 found that PFAS concentration wasn’t related to body weight or weight lost during dieting. However, it was associated with greater weight regain over the months following the diet. People with the highest plasma concentrations of PFAS gained back about 8.8 lbs (4 kg), while people with the lowest plasma concentrations of PFAS gained back only about 4.4 lbs (2 kg). This is a relatively minor but statistically significant difference, and it is consistent with an account where these compounds don’t simply cause weight gain, but damage the lipostat and lead people to defend a higher body weight.

West Virginia is usually an obesity outlier. It’s the #1 or #2 most obese state (depending on your source), and it’s been one of the most obese states for as long as we’ve been keeping statewide records for this sort of thing. But it’s also high in elevation (19th highest after Washington state and Texas) and pretty far upriver. Most of the neighboring states — Ohio (#11), Pennsylvania (#24), Maryland (#26) and Virginia (#28) — are not nearly so obese.

DuPont built the very first Teflon (PTFE) plant in Parkersburg, West Virginia. By 1948, the plant was manufacturing 2 million pounds of PTFE per year. Some sources claim that they were using PFOA as part of the manufacturing process by 1951. Unfortunately we don’t have obesity data for West Virginia in 1948 or 1951, or the years immediately following. But we can note that many years later, West Virginia was at the center of the first legal action surrounding PFAS.

This kind of legal action has come about because PFAS have been linked to a variety of harmful health effects, including cancer, thyroid hormone disorder, and immune system effects. As a result, governments have begun to regulate and sometimes ban these compounds. New York, Maine, and Washington state have all banned or restricted PFAS in various ways, and in 2021, Vermont and Connecticut both passed legislation to remove PFAS from firefighting foams, food packaging, and other consumer products. There’s even some international regulation — PFOS have been regulated under the international Stockholm Convention since 2009, which was expanded to include PFOA and PFOA-related compounds in 2019. There was also a movie about PFAS bans, starring Mark Ruffalo.

Some people are hopeful that these bans will form a sort of natural experiment that can allow us to see what happens when PFAS are removed from the environment. Unfortunately, we’re less optimistic. First off, these compounds are very durable, so even if we ban them, huge doses will still be in the environment. Second, statewide bans won’t keep these substances from entering the state in food or goods produced elsewhere. 

Finally, these bans restrict only a tiny percentage of all PFAS. As a recent report from the European Commission notes, “The ban of widely used long-chain PFAS has led to their substitution with a large number of shorter chain PFAS. Several of these alternatives are now under regulatory scrutiny in the REACH Regulation because of the concern they pose for the environment and for human health.” Efforts to limit exposure to PFAS are a great idea, but the continued use of short-chain PFAS limits the usefulness of bans as natural experiments to determine the role of PFAS in obesity.


[Next Time: SUSPECT NUMBER THREE]


A Chemical Hunger – Interlude B: The Nutrient Sludge Diet

[PART I – MYSTERIES]
[PART II – CURRENT THEORIES OF OBESITY ARE INADEQUATE]
[PART III – ENVIRONMENTAL CONTAMINANTS]
[INTERLUDE A – CICO KILLER, QU’EST-CE QUE C’EST?]
[PART IV – CRITERIA]
[PART V – LIVESTOCK ANTIBIOTICS]

In his book The Hungry Brain, neuroscientist Stephan Guyenet references a 1965 study in which volunteers received all their food from a “feeding machine” that pumped a “liquid formula diet” through a “dispensing syringe-type pump which delivers a predetermined volume of formula through the mouthpiece.” He devotes about three pages to the study, describing it like so:

What happens to food intake and adiposity when researchers dramatically restrict food reward? In 1965, the Annals of the New York Academy of Sciences published a very unusual study that unintentionally addressed this question. …

The “system” in question was a machine that dispensed liquid food through a straw at the press of a button—7.4 milliliters per press, to be exact (see figure 15). Volunteers were given access to the machine and allowed to consume as much of the liquid diet as they wanted, but no other food. Since they were in a hospital setting, the researchers could be confident that the volunteers ate nothing else. The liquid food supplied adequate levels of all nutrients, yet it was bland, completely lacking in variety, and almost totally devoid of all normal food cues.

The researchers first fed two lean people using the machine—one for sixteen days and the other for nine. Without requiring any guidance, both lean volunteers consumed their typical calorie intake and maintained a stable weight during this period.

Next, the researchers did the same experiment with two “grossly obese” volunteers weighing approximately four hundred pounds. Again, they were asked to “obtain food from the machine whenever hungry.” Over the course of the first eighteen days, the first (male) volunteer consumed a meager 275 calories per day—less than 10 percent of his usual calorie intake. The second (female) volunteer consumed a ridiculously low 144 calories per day over the course of twelve days, losing twenty-three pounds. The investigators remarked that an additional three volunteers with obesity “showed a similar inhibition of calorie intake when fed by machine.”

The first volunteer continued eating bland food from the machine for a total of seventy days, losing approximately seventy pounds. After that, he was sent home with the formula and instructed to drink 400 calories of it per day, which he did for an additional 185 days, after which he had lost two hundred pounds —precisely half his body weight. The researchers remarked that “during all this time weight was steadily lost and the patient never complained of hunger.” This is truly a starvation-level calorie intake, and to eat it continuously for 255 days without hunger suggests that something rather interesting was happening in this man’s body. Further studies from the same group and others supported the idea that a bland liquid diet leads people to eat fewer calories and lose excess fat.

This machine-feeding regimen was just about as close as one can get to a diet with zero reward value and zero variety. Although the food contained sugar, fat, and protein, it contained little odor or texture with which to associate them. In people with obesity, this diet caused an impressive spontaneous reduction of calorie intake and rapid fat loss, without hunger. Yet, strangely, lean people maintained weight on this regimen rather than becoming underweight. This suggests that people with obesity may be more sensitive to the impact of food reward on calorie intake.

In his review of the Hungry Brain, Scott Alexander provided a more concise description of the same study: 

In 1965, some scientists locked people in a room where they could only eat nutrient sludge dispensed from a machine. Even though the volunteers had no idea how many calories the nutrient sludge was, they ate exactly enough to maintain their normal weight, proving the existence of a “sixth sense” for food caloric content. Next, they locked morbidly obese people in the same room. They ended up eating only tiny amounts of the nutrient sludge, one or two hundred calories a day, without feeling any hunger. This proved that their bodies “wanted” to lose the excess weight and preferred to simply live off stored fat once removed from the overly-rewarding food environment. After six months on the sludge, a man who weighed 400 lbs at the start of the experiment was down to 200, without consciously trying to reduce his weight.

This study is especially meaningful for Guyenet because he favors a “food reward” explanation of the obesity epidemic, where obesity is at least partially the result of really delicious foods that make us want to eat a lot of them. He says that foods like “ice cream, brownies, french fries, chocolate, and bacon” have the ability to “powerfully drive cravings, overeating, and eventually, deeply ingrained unhealthy eating habits.” On the other hand, foods like “fruit, vegetables, potatoes, beans, oatmeal, eggs, plain yogurt, fresh meat, and seafood“ are “still enjoyable but they don’t have that intensely rewarding edge.” 

First of all, how dare he say that about potatoes. But second, while this study is not exactly the cornerstone of Guyenet’s argument, it does seem especially important evidence for the food reward perspective.

We wanted to review this study when we were writing A Chemical Hunger, but we couldn’t find the original paper, and since we couldn’t confirm the results for ourselves, we decided not to include it in the piece.

But now, reader Sam Marks (thank you Sam!) has found us a copy of the study! Finally able to review it, we offer this special interlude for your reading pleasure. (If you want to read the study for yourself, email us and we would be happy to send you a copy.)

Before we review, however, we want to offer our initial impressions. This study was performed in 1965, which means that it was decidedly pre-obesity-epidemic. In Part I, we review the evidence that obesity rates were stable until about 1980, when they suddenly started increasing. We think that this is evidence that modern obesity occurs for different reasons than historical obesity did. The people in this study probably were not obese for the same reason(s) people are obese today, so the same rules may not apply. 

In addition, studies from 1965 are not known for being super reliable. Back in 1965, sample sizes were small, teams had limited resources, and statistical analyses were more on the casual side.

STUDIES IN NORMAL AND OBESE SUBJECTS WITH A MONITORED FOOD DISPENSING DEVICE

Let’s take a look and see what we can learn about a diet of “homogeneous nutritionally adequate formula emulsion” (henceforth “nutrient sludge”). To give you the full experience, we will begin by covering the paper blow-by-blow. 

The authors begin by describing how they are jealous of experimental psychologists, who back in those days were still putting rats in Skinner boxes. These animal researchers could get “detailed and accurate information concerning rate of food ingestion, size of meals and intervals between feedings” by giving rats a lever which would dispense one food pellet when pushed, and using electronic monitoring equipment to record each time the lever is pressed.

To this end, the authors developed a device of their own, which dispenses food to human subjects at the press of a button, and secretly records the date and time of each “delivery” on a device “in a room remote from the subject who is kept unaware of its existence.”

The feeding machine … consists of a reservoir containing a liquid formula diet. The formula mixture is constantly mixed by a magnetic stirrer.

Yum.

Whenever the button is pressed, 7.4 ml. of formula are delivered directly into the mouth of the subject by the punp. [sic]

This is hilarious. 

They don’t say much about the nutrient sludge, only that it was “provided as ‘Nutrament’ through the courtesy of Warren M. Cox, Mead Johnson Research Laboratories, Evansville, Ind.” and that “carbohydrate contributed 50 per cent of the calories, protein 20 per cent and fat 30 per cent.“

Let’s meet the participants. In this study, they tested the feeding device (yikes) on both “normal-weight” and obese people.

The first normal-weight subject studied was well suited to the feeding machine because a severe deformity of his mouth made ingestion of normal food difficult. … His daily calorie intake did not vary appreciably, averaging 3075 ± 438 (S.D.) calories per day.

And:

A healthy 20 year-old volunteer subject also readily maintained his body weight during a nine-day period on the machine consuming an average of 4430 calories per day.  

And:

The results obtained in one individual, a 27-year-old man, are shown in FIGURE 4. Initially, he weighed 400 pounds. 

The response to feeding by machine of another obese subject, a woman aged 36, is shown in FIGURE 5. [Figure indicates that she was just under 400lbs at start]

So, first of all, these subjects do not seem like typical patients. One has “a severe deformity of his mouth” and ate 3075 calories of nutrient sludge every day for sixteen days. One is a 20-year-old who ate 4430 calories of nutrient sludge every day for nine days. And the two obese patients were both around 400lbs at the start — not typical cases by any measure!

If both these obese people were six feet tall (unlikely), their BMI at the start of the study would have been 54.2!!! Recall that obese is a BMI of 30, and extreme obesity / morbidly obese is a BMI of 40 or greater. This BMI chart we found from the NIH only goes up to 54. These people were literally off the charts, and again that’s assuming they are both six feet tall. If they were shorter, then their BMI would be even higher.

The sample size here is FOUR. If we only count the obese patients, the sample size is merely two. Except maybe not, because the discussion says, “The data show that the five obese subjects [emphasis added] ate only a small fraction of their daily calorie requirements by machine” (the end of p669 also suggests five obese subjects). We aren’t given any specifics about these “three additional obese subjects” except that they “showed a similar inhibition of calorie intake when fed by machine.” In any case, we’re given very little case information about any of the seven subjects, and at the end of the day this study has two control subjects and five obese subjects (though it’s not even an experiment).

We understand the benefits of case studies, but this one doesn’t seem particularly likely to generalize.

Making a long story short, both “normal-weight” participants maintained their healthy weight effortlessly on a diet of nutrient sludge. The obese participants ate only a couple hundred calories per day and effortlessly lost huge amounts of weight. Somewhat strangely, the treatment periods were very different. The obese male participant lost 200 lbs after 252 days on various forms of the nutrient sludge diet, while the obese female participant was there for only 24 days and lost 23 lbs. Both patients were very obese to start with, but this rate of weight loss still seems really extreme.

This study is from 1965, and realistically, the data are from a few years earlier. As mentioned above, we think that the abrupt increase in obesity rates starting in 1980 is evidence that modern obesity occurs for different reasons than historical obesity did. The aetiology of these cases of obesity is almost certainly different from the obesity we see today, and even today, very few people are 400lbs. 

Probably these people were obese for a different reason than your local bus driver with a BMI of 31. For example, they might have had a brain tumor that left their hunger response largely intact, but led them to compulsively overeat a particular food. This would explain why “the patient never complained of hunger or gastrointestinal discomfort” despite spending 26 days eating nothing but ~275 calories of nutrient sludge a day. 

Even if the aetiology were the same as modern obesity, there are a few huge problems, the biggest of which is THE CUPS!!!

About the obese male participant, they say:

To determine whether the bizarre feeding situation was by itself inhibiting his food intake, he was asked (after 18 days on the machine) to feed himself the same formula ad libitum using a pitcher and cup. In the third section of FIGURE 4 it can be seen that his calorie intake increased on this program to about 500 per day [from 275 ± 57 calories per day]. He was returned to machine feeding after another 26 days and, again, spontaneous food intake dropped to a lower level.

For the obese female participant:

Her spontaneous food intake over a 12-day period of observation also was extraordinarily low, 144 ± 91 calories per day. During this time she lost 23 pounds. When she took the same formula by cup, calorie intake increased to 442 ± 190.

(Also weird: on days 11 and 17, this participant appears to have eaten about zero calories?)

For one participant, calorie intake nearly doubled when he went from drinking from the syringe-pump to using a pitcher and cups. For the other, calorie intake tripled. This makes it pretty clear that the nutrient sludge itself was only driving part of the effect (or that the measurements are hopelessly imprecise). Contra Guyenet, the palatability of the sludge doesn’t seem to be the main force at play here. In addition, this is super weird. 

It’s also very strange that the healthy 20 year-old volunteer subject consumed 4430 calories of nutrient sludge per day (this was on average — one day, he consumed almost 5000 calories of the sludge). Their only explanation for this was, “the subject remained physically active throughout this period,” but this is still a LOT of calories! The FDA recommendation for an “Active” 20-year-old man is a mere 3,000 calories (same for “Very Active” from the NIH), and this guy was slurping down almost 48% more calories per day than the recommended amount, for nine days! The other “normal-weight” participant also consumed a lot of sludge, 3075 calories per day on average, and there’s no indication he was especially active.

This seems to argue against the idea that the sludge was all that unappetizing! The authors describe it as “bland”, but never suggest that it was intended to be unpalatable. The detail they give is, “carbohydrate contributed 50 per cent of the calories, protein 20 per cent and fat 30 per cent. The formula contained vitamins and minerals in amounts adequate for daily maintenance.” Maybe it was delicious, and the results from the two lean participants certainly seem to suggest that this is a possibility. Ask yourself this: would YOU eat 4430 calories of nutrient sludge per day if it were “bland”?

If the sludge truly was bland, this appears to be reasonably strong evidence against the food reward hypothesis! Taking this argument at face value, it seems like feeding healthy young men nothing but nutrient sludge is an extremely reliable way to make them overeat by 1000-2000 calories per day.

Alternately, the measurements could be way off for some reason. What seems more likely, that two normal-weight men decided to eat 3075 and 4430 calories of nutrient sludge every day for more than a week, and that five morbidly obese patients lost about 1 pound every day for up to 200 days, or that someone made a mistake and wrote down some of these numbers wrong? Even if the research team were 100% reliable, how good was the technology in 1965? How reliable were the pump and the printing timer? Small differences in the pump delivery doses could easily be responsible for the weird results we see. Not to sound paranoid, but was this guy really exactly 400 lbs to start, and did he really lose exactly 200 lbs over the course of the diet? Does eating 400 calories per day for 252 days pass a basic sanity check?

Also for comparison, Figure 4 (reproduced below) appears to show that the 400-lbs-obese man was eating only 2000 kcal/day of a “Regular Hospital Diet” for the eight days before going on a nutrient sludge diet. Was this how much he normally consumed? It seems weird. Guenet says that 275 calories was “less than 10 percent of his usual calorie intake”, suggesting the man’s normal diet was at least 2750 calories per day, but we don’t see where he’s getting that number from. If either of these numbers are right, that means that the 400 lb man had a normal calorie intake that was less than both of the lean subjects. 

In any case, another serious oddity is that he started losing weight as soon as he entered the hospital, at a rate of about one pound per day — eight days before he was put on the nutrient sludge diet! That kind of makes it seem like something else is causing the rapid weight loss. 

Other Studies

Of course, this is just one study. In fact, it’s merely the first of many! In the section we quoted at the beginning of this piece, Guyenet says, “further studies from the same group and others supported the idea that a bland liquid diet leads people to eat fewer calories and lose excess fat.” It would clearly be a big mistake for us to dismiss this early result without seeing the further studies, so let’s take a look.

Guyenet cites two further studies in The Hungry Brain, and we found a third with a little searching. This may not be the full literature on the subject, but it’s everything Guyenet cites plus one, so it seems like a good place to start.

The first was a study called An Automatically Monitored Food Dispensing Apparatus for the Study of Food Intake in Man. This study was from 1964, so it actually predates the study reviewed above. The abstract says that said apparatus was “tested on a patient for 17 successive days” and that “the pattern of energy intake reflected 3 identifiable meal-times in each 24-h period.”

As far as we can tell, this is simply the first test of the “automatically monitored food dispensing apparatus.” We can’t access the full article for some reason (if you can, please send it to us), but the abstract seems to specify that there was only one participant, and there’s no mention of weight loss or obesity at all.

Artist’s conception of the food dispensing apparatus. Just kidding it’s Tubby Custard.

The second is a paper from 1971 called Studies of Food-Intake Regulation in Man — Responses to Variations in Nutritive Density in Lean and Obese Subjects. This is one of the papers Guyenet cites in The Hungry Brain.

In this study, “dispensed liquid diet was studied in five lean and four obese young adults and two obese juvenile subjects.” The twist is that the researchers varied the “nutritive density” of the nutrient sludge over time without telling the research subjects. As before, subjects were (ideally) unaware that their food intake was being recorded. Also relevant is that the study was conducted in a metabolic research ward, which allows for a certain amount of control, and that participants were “maintained on light activity”, with the research team attempting to “prevent significant day-to-day variations in energy output”.

We see the same issues here that we highlighted in the original study. This is also before 1980, and so may not be informative about the current situation. The sample size is pretty small, but it’s bigger than before, and the subjects seem less idiosyncratic.

The lean participants were “five healthy male students 20 to 25 years of age”. The “grossly obese patients” came in two groups — four women between the ages of 25 and 30, and two adolescent boys ages 13 and 15. This isn’t an experiment, but it’s still kind of worrying how different the demographics are for the lean and the obese participants.

The results for the lean participants match the previous findings. “All the lean subjects,” they report, “were able to maintain weight within fairly narrow limits (0.6 to 2.3 per cent of initial body weight) by making appropriate adjustments in the calorie intake whenever the nutritive density was varied.” Thankfully, unlike the lean participants in the previous study, none of these fellows was consuming an insane amount of the sludge.

The obese adult female participants ingested only a few hundred calories of the sludge per day, and lost weight, though the weight loss doesn’t appear to be as extreme as in the first study. Of interest, however, “there was no increase of volume intake in response to formula dilution and no decrease in volume intake after formula concentration.” In fact, in two of the four obese women (that is, half), “there were paradoxical drops in volume intake when the nutritive density of the formula was decreased.”

This is very weird. It suggests that these women were controlling for the amount of nutrient studge they drank, rather than for calorie intake. Together with the results of the first study (and THE CUPS), the conclusion ends up looking less like “if obese people eat a bland diet, they return to a healthy weight” and more like “if you give obese people a diet through a food pump nozzle, they will suck the exact same tiny amount every day for some reason.” 

The story is further complicated by the fact that we get VERY different results for adolescent male participants. The 15-year-old was 101 kg and the 13-year-old was 135 kg at time of admission, and both of them maintained these weights by drinking thousands of calories of nutrient sludge. “During the periods in which caloric density was 1.0 kcal per milliliter,” they tell us, “energy intake was in excess of 3900 kcal per day.”

These participants really did seem to be controlling for calorie intake, because diluting the formula didn’t fool them. “When the formula was covertly diluted subject A.V. increased volume intake slightly, but not enough to maintain a caloric intake comparable to that achieved during intake of the more concentrated formula. In contrast, W.D. compensated for formula dilution with a striking increase in volume intake, thereby maintaining a near constant energy input.”

An examination of Table 2 reveals that at one point, one of the adolescents broke 4,000 calories of nutrient sludge per day, which is honestly impressive across a number of dimensions. In addition, “These two obese juvenile subjects differed from the obese adult subjects in that they either maintained or gained weight while receiving the machine-dispensed formula.” The magic bullet against obesity, this is not.

In fact, once again this seems like evidence against palatability as an explanation for obesity. If palatability were the driving force, then these teens wouldn’t be slurping down almost 4k calories of nutrient sludge to maintain their extreme weights. Indeed, it seems like palatability makes no difference at all. 

It’s especially concerning that this diet causes weight loss in only 2/3 of the participants. These six people may be obese for different reasons (i.e. obesity is a shared symptom but the result of a different underlying condition), but none of those reasons seem to be related to palatability. 

The other paper cited by Guyenet in his book was a 1976 piece titled Influence of a Monotonous Food on Body Weight Regulation in Humans. This study is not worth reviewing in depth because of its major departures from the original design. This is a two-author paper, and neither author was involved in any of the previous studies. Rather than the nutrient sludge being automatically recorded by a dispensing pump in the monitored environment of a hospital ward, subjects were sent home with “an ample stock” of Renutril®, a moderately sweet, vanilla flavored complete liquid diet that comes in 375 ml cans. For experimental control, “they were told to avoid as much as possible the odor, the sight, and even the thought of any other foods.”

Even if this design were above criticism, the results are unimpressive. The study lasted 3 weeks, and on the all-liquid bland diet, people’s weight decreased by only 3.13 kg. This is a far cry from the one pound per day reported in the 1965 study.

In addition, this study suffers from the same problems as all the studies above: the study was conducted before 1980, so it may not generalize, and the sample size was four.

Conclusions

Taken together, these studies do not provide much evidence in favor of palatability as a cause for obesity, or for the use of a bland diet in reversing it. The studies are all more than 40 years old, so the data predates the modern obesity epidemic. There are a number of bizarre observations and discrepancies (THE CUPS!!!) that don’t seem consistent with the palatability hypothesis. The total sample size across all four studies is 23.

In fact, these studies provide moderate evidence against the palatability hypothesis. Most participants lost weight on the nutrient sludge diet, but two patients not only ate heroic amounts, they actually gained weight. In the 1965 study, the nutrient sludge diet appears to have prompted two lean participants to overeat by something like 1000-2000 calories per day.

Finally, there is an external sanity check that makes us doubt the whole premise. If the nutrient sludge diet works, why hasn’t anyone done a real experiment on it? Why isn’t it being used to make 400 lbs men lose 200 lbs today? Either this is a huge missed opportunity, or these results are simply wrong. 

If this works, why hasn’t someone replicated it by now? It would be pretty easy to run a RCT where you fed more than five obese people nutrient sludge ad libitum for a couple weeks, so this means either it doesn’t work as described, or it does work and for some reason no one has tried it. Given how huge the rewards for this finding would be, we’re going to go with the “it doesn’t work” explanation. 

If you think palatable food is the relevant issue, an even better approach would be an experimental design where you develop two (or more) nutrient sludges, nutritionally identical but one more palatable than the other, and randomly assign a group of obese participants to eat either the palatable sludge or the unpalatable sludge. But we haven’t seen a design like this either.

If Guyenet — or anyone — believes this result is real, they should rush to do a metabolic ward study on a sample size of more than five people, and collect all the fame and fortune that comes with finding a diet that not only reliably works, but leads to weight loss of about one pound per day with no hunger or gastrointestinal discomfort.


[Next Time: SUSPECT NUMBER TWO]


A Chemical Hunger – Part V: Livestock Antibiotics

[PART I – MYSTERIES]
[PART II – CURRENT THEORIES OF OBESITY ARE INADEQUATE]
[PART III – ENVIRONMENTAL CONTAMINANTS]
[INTERLUDE A – CICO KILLER, QU’EST-CE QUE C’EST?]
[PART IV – CRITERIA]

Obesity in the United States – Dysbiosis from Exposure to Low-Dose Antibiotics? suggests that the obesity epidemic is driven by population-wide exposure to residual antibiotics from livestock cultivation, and the resulting impact on gut microbiota.

This is one of the most similar proposals to the theory presented in A Chemical Hunger, though they don’t go quite as far as we do, still attributing some of the influence to diet and exercise: “Most reports attribute the obesity epidemic to factors such as excess food energy intake, changes in diet and eating behavior, and increasing sedentary life style. Undoubtedly, these factors contribute, but can they all account for the rapid increase in this problem that occurred over the last two decades?”

They make a pretty compelling case. A large percentage of antibiotics are excreted in animal waste and end up in the water supply, where they affect natural microorganisms. Relevant to our interests, antibiotics are more and more prevalent in rivers as they make their way towards the ocean: “The only site at which no antibiotics were detected,” they write, “was the pristine site in the mountains before the river had encountered urban or agricultural landscapes. By the time the river had exited the urban area, 6 of the 11 antibiotic compounds that were monitored were found in the samples. At Site 5, which had both urban and agricultural influences all five of the TCs monitored were detected.”

Exposure has increased in the US over time, closely matched with the increasing prevalence of obesity — “practically overlapping with the counties with the highest obesity prevalence in the US.” Similar trends can be observed in other countries. For example, in Great Britain, by 1958, around 50% of British pigs were fed antibiotics, and nearly all piglets were given food containing tetracyclines. In West Germany in the 1960s, an estimated 80% of feeds for pigs, calves, and poultry contained antibiotics.

The Effects on Human Health of Subtherapeutic Use of Antimicrobials in Animal Feeds opens by saying, “The food-producing animal and poultry industries have undergone a dramatic change that began around 1950.” That’s a little earlier than we would expect, but depending on how you measure things, it took until the 70’s or 80’s before things really got rolling.

In meat animals, antibiotics often lead to weight gain, sometimes as high as 40% weight gain compared to control, and there’s reason to suspect that this might be linked to the microbiome. Gut microbiota influence energy intake and body weight in mammals, and even short courses of antibiotics can reduce gut microbiota and increase BMI in humans (though the BMI effect was only seen in some antibiotics).

There’s even a study where they put fecal matter from human twins into germfree mice. (This is one of the more creative study designs we’ve seen.) They started by finding pairs of twins where one twin was fat and the other twin was lean. This is pretty uncommon — normally, twins weigh the same amount. They transplanted fecal matter from the twins into mice and found that mice that got fecal matter from the obese twin gained weight — unless it was housed with one of the mice who got fecal matter from the lean twin.

However, there is also evidence against this picture. For one thing, Germany, Spain, Italy, and Japan all use a lot of antibiotics in their meat, and none of these countries is particularly obese. Australia and South Africa are both pretty obese, but both of these countries use less antibiotics than usual. This could maybe be reconciled if these countries use different kinds of antibiotics, but we would need to see that case made to evaluate it.

There’s also some evidence in favor of this theory that this paper didn’t review.

For one thing, people who eat fewer animal products have lower BMIs, and the effect seems to be dose-dependent. In a sample from 2002-2006, average BMI was lowest in vegans (23.6) and incrementally higher in ovo-lacto vegetarians (25.7), pescitarians (26.3), semi-vegetarians (27.3), and nonvegetarians (28.8). We can note that the BMI for vegans is about the same as that found in hunter-gatherers and in Civil War veterans in the 1890s. That said, everyone in this sample was a Seventh-Day Adventist, so they may not be all that representative.

India and Japan are the least obese of the developed countries. Both have obesity rates below 5%. India is the most vegetarian country on the planet and Japan, while not especially vegetarian, mostly consumes seafood in place of meat products.

This would mean that vegan diets would work really well for weight loss, right? Well, maybe. As we previously reviewed, all diets seem to work a little, and no diet seems to work all that well. We see something similar in vegetarian and vegan diets. A 2015 meta-analysis found that people assigned to vegetarian diets lost more weight than those assigned to nonvegetarian diets. People on vegan diets lost a little more weight than people on vegetarian diets, about 5.5 pounds (2.5 kg) to 3.3 pounds (1.5 kg). The studies differed quite a bit in the size of the effect, but all of them had similar conclusions. The other meta-analysis from 2015 found the same general pattern, and individual studies comparing different types of vegetarian and vegan diets seem to confirm this dose-dependent trend.

This looks a lot like other studies, where the differences between diets are technically reliable but so small as to be basically meaningless, but the possible dose-dependent effect is interesting.

The most interesting study might be this one, that compared a vegan diet to a conventional low-fat diet. So far so standard, but unlike most diet studies, which end after 12 or 18 months, this one followed up two years later. The vegan group not only lost more weight (4.9 kg versus 1.8 kg), they kept it off better at the two-year followup (3.1 kg versus 0.8 kg). On most diets people lose a little weight but then gain it right back, so the fact that people kept most of the weight off for two years is interesting. Even so, the amount of weight lost in an absolute sense is still quite small. It could take more than two years on a vegan diet for you to see all the effects — but if this were the case, you’d think people would have lost even more weight by year two, but that’s not what we see.

None of these are smoking guns. At best, they are consistent with the idea that some of these contaminants are more prevalent in animal-based foods. And we know that this can’t be about the animal products themselves, because hunter-gatherers and our ancestors in 1890 ate lots of meat and didn’t experience modern levels of obesity.

Consider:

Source: Wikipedia. Radioactive barrels not to scale.

Environmental contaminants tend to build up in animals through the plants they eat, so any contaminants in the environment will bioaccumulate, and concentrations will be higher in animals than in groundwater or in plants. Compounds in a farmer’s fields will end up in the corn or alfalfa fed to their cows, and the cows will end up getting an even larger dose, which will be passed on to the person who eats the resulting cheeseburger. So the fact that meat consumption is linked to obesity doesn’t necessarily implicate antibiotics. It could be something else in the meat.


[Next Time: THE NUTRIENT SLUDGE DIET]


A Chemical Hunger – Part IV: Criteria

[PART I – MYSTERIES]
[PART II – CURRENT THEORIES OF OBESITY ARE INADEQUATE]
[PART III – ENVIRONMENTAL CONTAMINANTS]
[INTERLUDE A – CICO KILLER, QU’EST-CE QUE C’EST?]

Evidence strongly suggests that the obesity epidemic is the result of environmental contaminants.

However, it’s not entirely clear exactly which contaminants are responsible.

If we’re lucky, a few compounds are entirely responsible for the increase in obesity over the past forty years, and we can ban those chemicals.

If we’re not lucky, the obesity epidemic is the result of dozens or even hundreds of different contaminants, each with a small effect, which when combined lead to extreme obesity. In this case we can try to ban or regulate them all, but it will be much more difficult to find ways to get all of them out of our food, water, and homes.

While more work will be needed to pin down exactly what contaminants are responsible, we can make some very educated guesses, because we already know what kind of contaminants we’re looking for.

4.1    Invention and Introduction

The big inflection point for the obesity epidemic was around 1980, so we should be looking for compounds that entered the environment slightly before then. Either they were discovered around 1960-1970 and were immediately introduced, or they were discovered some time before and went into widespread use just before 1980.

These contaminants may be synthetic, but they don’t have to be. These could also be naturally occurring compounds that are introduced into the environment through human activity.

We’re aware that correlation doesn’t imply causation. By itself, showing that the time course of some contaminant is related to the upward trend in obesity rates isn’t enough to show that the contaminant is responsible for the obesity epidemic. But it is suspicious. We should keep in mind that the link between smoking and lung cancer was largely established through correlational data.

If we don’t see a relationship between a contaminant and the obesity epidemic, it’s harder to make the case for that particular contaminant. For example, some people have proposed that certain milk proteins might be behind the obesity epidemic. But if you look at dairy consumption by country, you immediately see that some of the leanest countries are near the top and many of the most obese countries are near the bottom. As a result, we don’t think this is a serious candidate and we don’t discuss it in this paper. A relationship is one of the first signs we should look for in a proposed explanation, even though, by itself, it’s not enough to be convincing.

4.2    Between-Group Differences

There are large differences in rates of obesity between counties, states, countries, and even professions.

Some of this is due to differences in factors like altitude or genetics. For example, in a group of about 43,500 patients from the San Francisco bay area, the rate of obesity in European-Americans was about 26%, but the rate of obesity among Asian-Americans was much lower, at 12% obese. This also differed quite a bit by country of origin. Among Asian-Americans, Filipino-Americans (24%) and Indian-Americans (17%) were the most obese, and Chinese-Americans (7%) and Vietnamese-Americans (6%) were the least obese.

This suggests that even if these environmental contaminants were just as widespread in China as they are in the United States, the rate of obesity would only be about 7%. In this light, it’s not surprising that the rate of obesity in China is currently around 6%. That isn’t a mystery that we need to explain, it’s about what we would expect based on what we know about the genetics of obesity.

Despite this, some of the difference in obesity rates between countries is probably due to differences in exposure to contaminants. This is something we should keep an eye out for. In contrast to China, Indian-Americans are about 17% obese, less obese than European-Americans but much more obese than people living in India, who are only about 4% obese.

4.3    Dose Dependence

An obvious smoking gun would be if the amount of exposure to a contaminant were related to obesity. If people who are exposed to a high dose of the contaminant are fatter than those who are exposed to a low dose, that would be a strong indication that the contaminant is responsible.

Right? 

Well, maybe.

We are all living in a fattening environment. A 2012 meta-analysis of 115 studies concluded that around 75% of individual difference in BMI is genetic. This is entirely compatible with the idea that contaminants are responsible for the difference between obesity rates in 1970 and 2020. It just means that, now that everyone has been exposed to more or less the same contaminants, 75% of the variation in the population is genetic.

That only leaves 25% of the variance to potentially be explained. If we assume that all of that variance is due to differences in dose, then some simple math tells us that the correlation with dose would be r = 0.50. This is a reasonably large correlation, but we also shouldn’t expect things to be so simple. If we expect that there are ten contaminants, the correlation between dose and BMI for each would be about r = 0.16. If dose explains only 15% of the remaining variance rather than 25% (leaving a reasonable 10% as the result of noise), the correlation for each of the contaminants would be r = .12.

With a large enough sample size, this would certainly be detectable. But dose alone almost certainly can’t explain all the remaining variance. We should be aware that even if there is a strong dose-dependent effect, the effect size might appear statistically to be quite small.

At some point in the past, these contaminants weren’t in the environment at all. Now, they’re so widespread that almost everyone in the industrialized world is getting a dose. This means we’re working with a restricted range. No one, or almost no one, has a dose near zero. Most of us are probably getting similar doses — that’s part of what it means when we see that 75% of the variation in the current population is genetic.

When the range of a variable is restricted, the correlation always ends up looking smaller than it really is. That link leads to a paper where they show that, for a dataset with a true correlation of r = .82, with different range restrictions the apparent correlation can be .51, .47, or even as small as .18! In some cases, a restricted range can even make a positive correlation appear to be negative.

We know that in most samples, everyone will have similar levels of exposure to the contaminants. We’ll be working with a restricted range, and any correlation we see will be smaller than the true correlation. It’s not clear how restricted our range is, but the correlation we see may be much smaller than the true relationship. It might disappear altogether, or even appear slightly negative. And remember, if genetics is 75% of the variance, then the largest dose-dependent correlation we can expect to see is only .50, which is not all that large to begin with.

(This is a known issue in studying public health. E.g. Lindeberg: “Another difficulty is that the variation of dietary habits in the population being studied may be too small to allow for demonstration of a possible relationship with health. Salt consumption among a particular ethnic group may not show much variation, and the majority has an intake that is much higher than what was practically feasible during evolution. This problem can be compared to studying the importance of smoking for myocardial infarction without having access to non-smokers. (In the case of smoking, often no relation is apparent in epidemiological studies.)” )

One pattern you might expect to find is that dose-dependent effects only become apparent in samples with a wide range of dosages — that is, in cases where the range isn’t restricted. They might be especially pronounced in groups that have extremely high levels of exposure, such as people who work with these contaminants directly, because that increases the range of dosages.

There might also be diminishing returns. Let’s imagine that today, people on average get a dose of 100 units. Back in 1970, everyone got a dose of 0 units. Now, the first 20 units might be very fattening indeed. But in general, the human body can only get so fat. The first 20 units might make you gain 20lbs on average. But the next 20 units only make you gain 10lbs. And the next 20 units make you gain only 5lbs. Now that everyone is at 100 units, every additional unit of exposure leads to a nearly undetectable change in body mass.

We don’t know that there is diminishing weight gain from greater doses of these contaminants, but diminishing returns are pretty common in pharmacology (see for example here). If there are diminishing returns, we may be near or past the ceiling effect, in which case we might not be able to detect a dose-dependent effect. If this were the case, however, we might expect to see dose-dependent effects in samples with lower average doses; perhaps samples from the 1980s or 1990s, or samples from developing countries which don’t yet have doses in the same range as industrialized countries.

A further complication is that being exposed to contaminants doesn’t make you gain weight that very same day. Even on Olanzapine, which makes people gain an average of 13.7 kg after 48 weeks, you generally don’t see your first kilogram of weight gain until after 8 weeks. The dose in your system today will be less correlated with your weight than the dose you were on 6 months ago. The dose will be a lagging indicator, and this will also reduce any correlation.

This is further complicated by the fact that these compounds might have paradoxical reactions, which is what we call it when a drug sometimes has the opposite of its normal effect. This would cause some portion of people to actually lose weight, and would further reduce the apparent correlation between the contaminant and obesity.

Finally, there are a priori reasons for us not to expect there to be strong correlations in the existing literature. If there were a compound or contaminant that was correlated with BMI, even a relatively small correlation like r = 0.20, someone probably would have noticed. This means that either 1) the contaminants are compounds that we don’t usually measure, so no dataset exists where we can compare them to measures of obesity, or 2) the relevant contaminants are commonly measured, but for statistical reasons like the ones above, there isn’t an obvious correlation with obesity.

Evidence of a dose-dependent relationship would be a smoking gun in favor of a contaminant being one of the causes of the obesity epidemic. But the lack of a dose-dependent relationship isn’t evidence against the contaminant being involved.

4.4    Environmental Interactions

In the following sections, we do our best to identify which of the contaminants we’re putting into the environment could be the cause of the obesity epidemic, and we believe that we have found some likely candidates. Unfortunately, this search is complicated by the fact that chemistry and biology allow for bewildering interactions, and sometimes seem to be working against us.

There are two general ways this can happen. The first is that when chemical contaminants end up in the environment, they can be transformed into different compounds. This can occur as a result of interactions with minerals in the groundwater, from exposure to sunlight, from exposure to radioactivity, or from chemical interactions with other contaminants. Since contaminants can sit in soil and groundwater for decades, there’s a lot of time for these transformations to happen.

In her book Silent Spring, Rachel Carson describes how contaminants “pass mysteriously by underground streams until they emerge and, through the alchemy of air and sunlight, combine into new forms that kill vegetation, sicken cattle, and work unknown harm on those who drink from once pure wells.”

She provides a few illustrative examples. One case involved a manufacturing plant in Colorado. In 1943, the Rocky Mountain Arsenal of the Army Chemical Corps began to use the plant, located near Denver, to manufacture war materials. After eight years, the same manufacturing plant used to make these war materials was leased to a private oil company for the production of insecticides. Even before this point, however, there were already reports from miles away of mysterious sickness in livestock, crops dying and turning yellow, and even human illness, possibly related. A thorough investigation eventually revealed that the groundwater between the arsenal and the farms had become contaminated, but it had propagated so slowly that it took several years for the contamination to reach the farmland.

Analysis of the farms’ shallow wells revealed contamination with arsenic, chlorides, and other dangerous substances. This was enough to explain the majority of the reports of illness and crop damage. But most mysterious was the discovery of the weed killer 2,4-D in some of the wells:

Certainly its presence was enough to account for the damage to crops irrigated with this water. But the mystery lay in the fact that no 2,4-D had been manufactured at the arsenal at any stage of its operations. After long and careful study, the chemists at the plant concluded that the 2,4-D had been formed spontaneously in the open basins. It had been formed there from other substances discharged from the arsenal; in the presence of air, water, and sunlight, and quite without the intervention of human chemists, the holding ponds had become chemical laboratories for the production of a new chemical—a chemical fatally damaging to much of the plant life it touched. And so the story of the Colorado farms and their damaged crops assumes a significance that transcends its local importance. What other parallels may there be, not only in Colorado but wherever chemical pollution finds its way into public waters? In lakes and streams everywhere, in the presence of catalyzing air and sunlight, what dangerous substances may be born of parent chemicals labeled ‘harmless’?

While we can try to identify the contaminants that cause obesity, the disturbing fact is that the contaminants responsible may be compounds which we are unfamiliar with, because they weren’t created in a lab and have never been examined for safety. Again, Rachel Carson puts it better than we could:

Indeed one of the most alarming aspects of the chemical pollution of water is the fact that here—in river or lake or reservoir, or for that matter in the glass of water served at your dinner table—are mingled chemicals that no responsible chemist would think of combining in his laboratory. The possible interactions between these freely mixed chemicals are deeply disturbing to officials of the United States Public Health Service, who have expressed the fear that the production of harmful substances from comparatively innocuous chemicals may be taking place on quite a wide scale. The reactions may be between two or more chemicals, or between chemicals and the radioactive wastes that are being discharged into our rivers in ever-increasing volume. Under the impact of ionizing radiation some rearrangement of atoms could easily occur, changing the nature of the chemicals in a way that is not only unpredictable but beyond control.

To make matters worse, something quite similar can happen inside our bodies. As surprising and chaotic as the interactions between contaminants can be, their interactions with human biochemistry can be even more complicated.

“A human being,” writes Carson, “unlike a laboratory animal living under rigidly controlled conditions, is never exposed to one chemical alone. Between the major groups of insecticides, and between them and other chemicals, there are interactions that have serious potentials. Whether released into soil or water or a man’s blood, these unrelated chemicals do not remain segregated; there are mysterious and unseen changes by which one alters the power of another for harm.” She goes on to describe several such interactions in gory detail.

The organic phosphates, “those poisoners of the nerve-protective enzyme cholinesterase,” become much more dangerous if a person has previously been exposed to chlorinated hydrocarbons that injure the liver. Pairs of different organic phosphates themselves can also interact with each other, “in such a way as to increase their toxicity a hundredfold.” Organic phosphates also have the potential to interact with all sorts of other things in the environment, including prescription drugs, synthetic materials, and food additives.

Similarly, a person exposed to DDT is much worse off if they have already been exposed to another hydrocarbon that causes liver damage — “so widely used as solvents, paint removers, de-greasing agents, dry-cleaning fluids, and anesthetics.” As a result, a dose of DDT that is survivable for one person may be devastating to someone else. “The effect of a chemical of supposedly innocuous nature can be drastically changed by the action of another,” Carson tells us. “One of the best examples is a close relative of DDT called methoxychlor”:

Because it doesn’t accumulate in the body to any great extent when given alone, we are told that methoxychlor is a safe chemical. But this is not necessarily true. If the liver has been damaged by another agent, methoxychlor is stored in the body at 100 times its normal rate, and will then imitate the effects of DDT with long-lasting effects on the nervous system. Yet the liver damage that brings this about might be so slight as to pass unnoticed. It might have been the result of any of a number of commonplace situations—using another insecticide, using a cleaning fluid containing carbon tetrachloride, or taking one of the so-called tranquilizing drugs, a number (but not all) of which are chlorinated hydrocarbons and possess power to damage the liver.

Another good example is malathion, an insecticide that at the time was commonly used by gardeners. The name of this product sounds so evil that we’re surprised it passed the review of the corporate public relations people, but apparently the name comes from the smell and means “bad sulphur”, so there you go. Malathion is extremely deadly to insects but is “safe” for mammals, including humans. But malathion is only “safe” because the mammalian liver detoxifies it with an enzyme, rendering it harmless. “If, however, something destroys this enzyme or interferes with its action,” we are warned, “the person exposed to malathion receives the full force of the poison. Unfortunately for all of us, opportunities for this sort of thing to happen are legion.”

In particular, Carson relates the story of how a team from the FDA found that when malathion was administered at the same time as some of the other organic phosphates, “a massive poisoning results—up to 50 times as severe as would be predicted on the basis of adding together the toxicities of the two.” This led them to test the combination of many different organic phosphates, and found that many pairs of these compounds are exceedingly dangerous in combination.

The reason for this appears to be “potentiation” of their combined action — when one of the compounds destroys the liver enzyme responsible for detoxifying the other. “The two need not be given simultaneously,” we are warned. “The hazard exists not only for the man who may spray this week with one insecticide and next week with another; it exists also for the consumer of sprayed products. The common salad bowl may easily present a combination of organic phosphate insecticides. Residues well within the legally permissible limits may interact. The full scope of the dangerous interaction of chemicals is as yet little known, but disturbing findings now come regularly from scientific laboratories.”

Carson relates several more examples in a similar vein. Malathion also appears to become much more dangerous when a person is exposed to certain plasticizing agents. Just like its combination with other organic phosphates, “this is because it inhibits the liver enzyme that normally would ‘draw the teeth’ of the poisonous insecticide.” Similarly, exposure to malathion seems to increase the effect of certain prescription drugs, including muscle relaxants and barbiturates.

In addition, we found that malathion can, under some conditions, transform into malaoxon, which is 61x more deadly. One of these conditions is when malathion is exposed to chlorine, as it might be in some drinking water.

Our concern in this paper isn’t the toxicity of different insecticides, of course. The point is that the contaminants that cause obesity may not have a straightforward profile. It’s possible that two (or more) well-known and relatively safe contaminants combine in groundwater to form an unknown new contaminant that causes weight gain, and a host of other problems. It’s possible that a single contaminant becomes something else entirely when it is exposed to sunlight in fields, ponds, and rivers. It’s possible that there are two contaminants, neither of which cause obesity in isolation, but which in combination overwhelm the body.

4.5        Three Possible Contaminants

In the next parts, we propose some contaminants that we think might be responsible for the obesity epidemic. But we should make it clear upfront that the theory itself doesn’t hinge on these compounds. Even if it turns out that none of these compounds could possibly be responsible for the modern rise in obesity, we still think that the evidence is very strong that environmental contaminants are responsible.

We take a close look at three contaminants, and examine the evidence for each.


[Next Time: SUSPECT NUMBER ONE]


A Chemical Hunger – Interlude A: CICO Killer, Qu’est-Ce Que C’est?


[
PART I – MYSTERIES]
[PART II – CURRENT THEORIES OF OBESITY ARE INADEQUATE]
[PART III – ENVIRONMENTAL CONTAMINANTS]


Runner up titles: Son of CICO, 2 CI 2 CO, Revenge of CICO, CICO 2: Judgement Day, CICO Returns, CICO! Here We Go Again, CICO’s Bogus Journey 


Calories In Calories Out (CICO) gave us more trouble than any other section we worked on when writing A Chemical Hunger

Part of the problem is that CICO means different things to different people, and covers a number of loosely related hypotheses. We found it hard to disentangle these when we were writing Part II. A number of times we circled back to our section on CICO and tried to reorganize it, or re-write it entirely, but we weren’t able to figure out a way to clarify the argument to our satisfaction. 

But feedback on the posts has proved extremely helpful, and we think we can now do a better job explaining what we meant. Special thanks to commenters-on-the-blog Richard Meadows and Grat Ivar, to fellow bloggers Alvaro de Menard and Stephen Malina, and commenters on MetaFilter and Hacker News, for helping us clarify our thoughts on this.

Linear Relationships

One way to interpret CICO (or one sub-hypothesis) is that it claims there is a strictly linear relationship between calories eaten/burned and weight change. This is specified if we take “weight gain = calories in – calories out” literally. Essentially, this hypothesis says that overeating by the same amount should always lead to the same amount of weight gain.

This is clearly false. The overfeeding studies provide extremely strong evidence against this version of CICO, since people gain very different amounts when overfed by the same amount, the difference appears to be mostly genetic, and some people actually lose weight, even when overfed by moderate (1000 kcal/day) amounts. Many people still believe something like “for every extra 3500 calories you eat you always gain one pound”, but all available evidence comes down very strongly against that.

At low levels of overfeeding, people at normal weight often don’t gain any weight at all. We liked how sdenton4 on Hacker News put it: “It’s pretty obvious the body has other ways to dump excess calories than turning them into fat stores.” 

Willpower

In Part II, we quote Stephan Guyenet as saying, “This model [CICO] seems to exist mostly to make lean people feel smug, since it attributes their leanness entirely to wise voluntary decisions and a strong character. I think at this point, few people in the research world believe the CICO model.”

What does Guyenet mean here? A common interpretation tied up in CICO is that differences in willpower explain the difference between obese and lean people. The idea is that weight gain is easy and weight loss is hard for everyone. This interpretation says something like, everyone would be 300lbs if they didn’t use their willpower to eat healthy foods rather than cake — you have to control yourself. From this perspective, people who are obese lack willpower and people who are thin/fit are virtuous resisters of temptation.

The overfeeding studies also provide strong evidence against this hypothesis, since they find that it is hard for most people to gain weight and easy for them to go back exactly to the weight they were before the overfeeding. We think this leaves “willpower” explanations dead in the water. Most skinny people have no trouble staying that way.

While not everyone means this when they say “CICO”, many people do, and we wanted to address this aspect of CICO because it is a common misconception. There’s also a strong moral reason to argue against this aspect of the hypothesis, because the idea that obesity is the result of lapses or weakness in willpower has been used to justify many cruel and ineffective positions. People who believe that obesity is the result of laziness and weak willpower believe that people with no moral fiber can be recognized on sight. As a result, they do things like treat overweight and obese people with disrespect, make jokes about them, don’t hire them, don’t give them proper medical treatment, etc. They think that shaming and social stigma are effective interventions against obesity. Some think that overweight and obese people should feel ashamed of their weight. This is as horrible as thinking that cancer patients should feel ashamed and responsible for falling sick. 

In addition, placing the blame on willpower and moral failing, and treating individual responsibility as the appropriate intervention, means abandoning the search for the causes of obesity. If you think obesity is largely the result of willpower, then there’s no mystery or need for a solution. But in fact obesity is not the result of willpower, and obesity remains very mysterious. Let’s quote that article from The Lancet again: “unlike other major causes of preventable death and disability, such as tobacco use, injuries, and infectious diseases, there are no exemplar populations in which the obesity epidemic has been reversed by public health measures.”

Calories Lead to Weight Gain

Another interpretation is something like “calories matter for weight gain”. Other things being equal, you generally gain weight when you eat more calories and you generally lose weight when you eat fewer calories.

We are not trying to argue against this at all! If you eat 400 kcal/day, you will lose weight (there are studies on this). If you eat 10,000 kcal/day, you will gain weight (there are studies on this one too). But the amount of calories you eat matters much less than most people think, and there isn’t a strong linear relationship between calories consumed and weight gained (see above).

You can lose weight by consistently eating at a calorie deficit, but people who do this either struggle to maintain their lower weight or gain it back. For two people who are the same height, one might weigh 150 lbs and the other weigh 200 lbs. If the 200 lb person loses 50 lbs, it will be hard for them to maintain a weight of 150 lbs, but easy for the person who weighed 150 lbs to begin with. Why is that? And why has the number of people struggling with their weight grown so dramatically since 1980?

There may be some people with exceptional willpower and incredible support systems that can lose lots of weight and keep it off — in the same way that stage magicians with incredible willpower and lots of training can learn to hold their breath for 10+ minutes underwater. The question is why they would need to use their incredible willpower in the first place! Maybe willpower can be a solution, but it’s not the cause — it doesn’t explain the differences between 1980 and today.

What about those Calorie Intake Numbers?

A bunch of readers zeroed in on this paragraph:

It’s true that people eat more calories today than they did in the 1960s and 70s, but the difference is quite small. Sources have a surprisingly hard time agreeing on just how much more we eat than our grandparents did, but all of them agree that it’s not much. Pew says calorie intake in the US increased from 2,025 calories per day in 1970 to about 2,481 calories per day in 2010. The USDA Economic Research Service estimates that calorie intake in the US increased from 2,016 calories per day in 1970 to about 2,390 calories per day in 2014. Neither of these are jaw-dropping increases.

People pointed out that this is about a 20% increase in calories, which doesn’t seem to match our description of the increase as “quite small”. So let’s take a second to unpack our reasoning.

First of all, this was a smaller increase than we expected. We know that even a small daily change adds up over time, but we expected the change in daily calorie intake since 1980 to be much larger. 

Partly this is because once you gain weight, you burn more calories (because it takes more energy to move and maintain physiological function) and you need to eat more calories to maintain your weight. Studies show that people with obesity eat and expend more calories than lean people. From this study, for example, consider this sentence: “TDEE was 2404±95 kcal per day in lean and 3244±48 kcal per day in Class III obese individuals.” From this perspective, the average daily consumption per Pew being 2,481 calories per day doesn’t seem like much — that’s about what lean people expend daily. Obese individuals generally burn 3000+ kcal/day, and while not every modern person is obese, it does make the increase from 2,025 calories per day in 1970 to about 2,481 calories per day in 2010 look relatively small.

This is something of a chicken and the egg problem. We could weigh more because we eat more calories, but we could also eat more calories because we weigh more, and we need to eat more calories to continue functioning at that weight. You may say, “but if you eat less at a higher weight you will dip into fat stores to make up the difference”. Not if your set point is too high you won’t! If you eat less than you need and your body wants to defend your current weight, you will crave food and feel tired and stupid. Sound familiar?

In addition, there’s some evidence that back around 1900 people ate more than they did in 1960, without much more exercise, and they weren’t obese — though take this one with a grain of salt, since for the obvious reasons, we don’t have great calorie data from back then. This is mentioned in the paragraph immediately following the one quoted above:

If we go back further, the story actually becomes even more interesting. Based on estimates from nutrient availability data, Americans actually ate more calories in 1909 than they did in 1960.

For the sake of argument, let’s accept that an increase of 400 kcal/day is a meaningful amount. Let’s further assume that the 400 kcal/day increase is entirely responsible for the increase in the rate of obesity since 1980. Even if the increase is meaningful and driving the obesity epidemic, we have to ask, why are people eating more now than they used to?

Just because calories are causally involved doesn’t mean they’re the “first cause”, the cause we should be looking for. Imagine there were an evil dictator that went around force-feeding people. These people would gain weight (per the overfeeding studies) and in some sense the calories would cause the weight gain. But if we’re being reasonable, the insane dictator is the cause, and the calories are just the mediator. 

We know people do eat a bit more today than in the 1970s. So the question is something like, in this case, what is the insane dictator? When we say “not CICO” part of what we mean is “not willpower”. 

Miscellaneous

Another point worth mentioning is that there seem to be different kinds of weight change.

One is the kind of weight change that happens around your set point. For most people, changing your weight by 5-10 pounds in either direction will be relatively easy. This may be possible through diet and exercise; the amount of weight change may even have a close linear relationship with the amount of calories you add or remove from your diet! In this limited sense, CICO may be a useful guideline. 

This is very different from major changes in fat mass! All available evidence suggests that it is very, very hard to lose more than 10 or so pounds and keep it off, probably because it involves fighting your lipostat’s setpoint. 

Another kind of weight change has to do with changes in muscle mass. Altering your body composition to have lower fat/higher muscle percentages can occur without changing your set point and result in significant visual differences. We suspect that weight gain and weight loss work differently in bodybuilding because that involves weight change driven by increases in muscle mass, not fat mass. We’re perfectly willing to believe that people can gain and lose muscle mass in a reliable way based in part on caloric consumption, but that’s not the focus of A Chemical Hunger

Cutting fat gained when increasing muscle mass might also be relatively easy, because that’s more fat than you “naturally” had before the gains. More body fat should lead to more leptin, but your body had you at the leptin level it wanted you at before, so the leptin-based part of the lipostat will help you lose that fat mass. But changing fat mass alone seems pretty dang hard.


[Next Time: EVALUATING CONTAMINANTS]


A Chemical Hunger – Part III: Environmental Contaminants


[
PART I – MYSTERIES]
[PART II – CURRENT THEORIES OF OBESITY ARE INADEQUATE]

Only one theory can account for all of the available evidence: the obesity epidemic is caused by one or more environmental contaminants, compounds in our water, food, air, at our jobs and in our homes, that change how our bodies regulate weight.

These contaminants are the only cause of the obesity epidemic, and the worldwide increase in obesity rates since 1980 is entirely attributable to their effects. For any two people in a group, the difference between their weights is largely genetic, because everyone is exposed to similar levels of contamination. But the difference between the average weight in 1980 and the average weight today is the result of environmental contaminants.

3.1    Weight Gain in Response to Medication

We know that this is biologically plausible because there are many compounds that reliably cause people to gain weight, sometimes a lot of weight.

Weight gain is a common side effect of the psychiatric drug Clozapine (Clozaril). On average, people taking Clozaril gain about 10 to 15 pounds. This is dose-dependent — If you take a larger dose, you gain more weight — and on high doses people sometimes gain fifty or even a hundred pounds.

Weight gain is a common side effect of the psychiatric drug Olanzapine (Zyprexa). According to some sources, more than 50% of people taking this drug gain weight as a side effect. In certain populations, the rate of extreme weight gain can be as high as 90%! In one study, a group of 442 people taking Olanzapine gained an average of 30 lbs (13.7kg) after 48 weeks on a normal dose. Other studies find similar numbers — about 20 lbs after a couple weeks and about 30 lbs after a year. There’s some evidence that the weight gain is dose-dependent.

Weight gain is a common side effect of the psychiatric drug Haloperidol (Haldol). In one study, average weight gain on Haloperidol was 8.4 lbs (3.8 kg) at 3 months and 21.3 lbs (9.7 kg) at 1 year. There was a lot of variation between individuals though. If we assume that weight gain was approximately normally distributed, some back-of-the-envelope statistics suggest that about 2% of patients would gain 60 lbs or more after 1 year.

Weight gain is a common side effect of the psychiatric drug Risperidone (Risperidal). In the same study as above, average weight gain on Risperidone was 13 lbs (5.9 kg) at 3 months and 19.6 lbs (8.9 kg) at 1 year. Again there was a lot of variation, and while it’s hard to tell without the raw data, again a reasonable guess would be that some people gain as much as 60lbs. This also appears to be dose-dependent.

Weight gain is a common side effect of the element lithium (lithium), which is often used as a psychiatric medication. Almost all patients seem to gain some weight on lithium, and about half of them report serious weight gain, on average 22 lbs (10 kg). Weight gained is correlated (r = .44, p < .001) with the dosage. Some reports suggest that 20% of patients gain more than 10 kg on lithium.

Unsurprisingly from the lipostat perspective, you’ll notice that all of these are psychiatric medications. Presumably, they affect the brain. Weight gain is a side effect of many drugs, but it’s especially famous in the antipsychotics. Further, weight gain in many of these drugs is associated with enhanced leptin levels.

3.2    Mysteries

We need a theory that can account for all of the mysteries we reviewed earlier. Another way to put this is to say that, based on the evidence, we’re looking for a factor that:

  1. Changed over the last hundred years 
  2. With a major shift around 1980 
  3. And whatever it is, there is more of it every year
  4. It doesn’t affect people living nonindustrialized lives, regardless of diet
  5. But it does affect lab animals, wild animals, and animals living in zoos
  6. It has something to do with palatable human snackfoods, unrelated to nutritional value
  7. It differs in its intensity by altitude for some reason
  8. And it appears to have nothing to do with our diets

Environmental contamination by artificial, human-synthesized compounds fits this picture very well, and no other account does.

Mystery 1: The Obesity Epidemic 

People were skinny before the modern era because these contaminants didn’t exist back then.

People’s diets were “worse” in the past — full of lard and bread — because diet doesn’t cause obesity. The ~1% of people who were obese in the past were people with one of the various medical conditions known to cause obesity, such as Prader-Willi Syndrome, hypothyroidism, or hypothalamic lesions.

Mystery 2: An Abrupt Shift 

People rapidly started getting more and more obese starting around 1980 because the contaminants are the product or byproduct of some industrial process. We’re looking for compounds that were invented around 1960 or 1970, because it would probably take a few years for enough to get into the environment to start affecting us.

Alternatively, these might be compounds that had been invented much earlier, but only began to see widespread deployment around 1980. Either way, we’re looking for that abrupt shift.

Mystery 3: The Ongoing Crisis 

The obesity epidemic keeps getting worse because these contaminants continue to be produced and continue to build up in the environment. Every year they accumulate and each of us gets a larger dose. This suggests that we are looking for compounds that don’t break down easily, or at least are being introduced into the environment faster than they break down.

Mystery 4: Hunter-Gatherers 

Different groups of hunter-gatherers remain lean while eating very different diets because the human body can thrive on many kinds of food. Some of the diets are extremely high-fat. Some of them are extremely high-starch. Some of them are extremely high-sugar. Some eat an extremely varied diet, while others get almost half of their calories from a single food source. But they don’t become obese, because they’re eating fat right off the gemsbok or yams straight out of the ground, and living in grass huts.

When hunter-gatherers adopt an industrialized lifestyle, however, they become obese just like anyone else. You’ll recall that, in 1990, a team led by Staffan Lindeberg traveled to the island of Kitava and found that none of the Kitavans were obese, despite the fact that they had plenty of foods and ate a very starchy diet.

It’s true that none of the Kitavans living on the island were at all overweight. But there were actually two overweight Kitavans — both men who had grown up in Kitava, had since moved away for many years, and who happened to be visiting at the time of the study. Lindeberg managed to examine one of them, a 44-year-old businessman named Yutala, who had left the island fifteen years earlier to become a businessman in Papua New Guinea. At the time of the study, Yutala was almost fifty pounds heavier than the average Kitavan man of his height, twelve pounds heavier than the next heaviest man, and had the highest blood pressure of any Kitavan Lindeberg examined.

When he moved away from the island, Yutala was exposed to a modern way of living. More importantly, he was exposed to the contaminants of an industrialized society. As a result, he became overweight.

Yutala isn’t an isolated case. In fact, this happens with some regularity. Lindeberg notes, “an epidemic of obesity and weight gain has occurred in former traditional populations that transitioned to a Western lifestyle,” and cites a total of 17 sources to support this claim, including examples from Sudanese communities, Native Americans, Pacific Islanders, South Australian Aborigines, and the people of Vanuatu. “When humans switch from an ancient to a Western lifestyle,” he says, “they experience increased waistlines, reduced insulin sensitivity, higher blood pressure and a host of related disorders and diseases.“

Mystery 5: Lab Animals and Wild Animals 

Lab animals and wild animals are becoming more obese because they are exposed to the same environmental contaminants that we are. If they are living around humans, in or around our buildings, eating industrially-prepared foods, or the scraps of such foods, they are exposed to contaminants in the same way as the rest of us. Even if they’re not living in close proximity to humans, these compounds are probably in groundwater and drinking water.

Mystery 6: Palatable Human Food 

Lab rats gain more weight from human foods than they do from rat chow with similar nutritional properties because obesity doesn’t come from fat or carbohydrate content, but from contaminants in the food, and human food has more contaminants than the rat chow does, likely from packaging and processing.

Processed foods end up with more contaminants in them — for example, there are 4x more phthalates in Kraft mac and cheese powders than in block cheese, string cheese, and cottage cheese. Another example are these results from the FDA, as reported by the AP. In terms of explaining why the cafeteria diet is so fattening, it’s especially illustrative that grocery store chocolate cake was an extreme outlier, with concentrations of PFPeA more than 100 times higher than chocolate milk.

Doesn’t this mean that avoiding packaged and processed food should reverse obesity? We think the answer is “maybe”. There’s not a lot of research on “whole foods” diets, but the evidence that we do have is quite promising. People seem to lose a reasonable amount of weight and keep it off for up to 12 months when they’re eating largely unprocessed plant-based foods. But we should be skeptical of these results until there are more studies. While this diet lowered almost everyone’s BMI, when we look at individual results, most people remained obese or overweight after 12 months on this diet. Similar findings are characteristic of Paleolithic diets. Even when the studies are conducted by advocates of these diets, they produce very moderate benefits, in one case causing only 6.6 lbs (3 kg) more weight loss than a comparison diet across a 3-month period.

There do happen to be a couple compelling anecdotes. In 2010, Chris Voigt, the Executive Director of the Washington State Potatoes Commission, vowed to eat nothing but 20 plain potatoes (and a small amount of cooking oil) for 60 days straight to demonstrate that potatoes are perfectly healthy, and in fact nutritious enough to sustain a person for quite a while.

This wasn’t intended as a weight loss diet — in fact, 20 potatoes a day was the amount he calculated he would need to maintain his weight (2,200 calories). Despite this, Voigt lost 21 pounds over his sixty-day diet. He even had trouble eating enough — he just wasn’t very hungry. Why would this happen? Well, unprocessed potatoes are about as raw a food as you can find, and won’t pick up contaminants from industrial cooking and packaging. If Voigt was being exposed to contaminants through his everyday diet, then switching to potatoes largely cooked at home would lead him to getting a much lower dose of contaminants.

Most people are likely exposed to some of these contaminants in their diet, so eating a diet with fewer contaminants helps. But most people are also likely exposed at home, at work, and through their drinking water, so diet alone can only help so much.

Mystery 7: Altitude 

Obesity is less common at high altitudes because of the watershed. Environmental contaminants build up as water flows downhill and are in much higher concentrations as you approach sea level.

For example, take a look at this map of by-state obesity levels from the CDC:

Prevalence of Self-Reported Obesity Among U.S. Adults by State and Territory, 2018. Map from the CDC.

The Mississippi watershed is America’s largest drainage basin, covering 41% of the country. If you compare this map of state-level obesity to a map of the Mississippi watershed (below), you’ll see that every single state with obesity rates of >35% borders on a river from this watershed system. Also informative is that the three states at the mouth of the river, Mississippi, Arkansas, and Louisiana, are #1, #3, and #4 in the nation in terms of obesity rate (39.5%, 37.1%, and 36.8%, respectively).

Obesity rates are high everywhere in America, but we can see that they are higher in states where the groundwater has covered more distance, and had more time to accumulate contaminants (see continental watershed map below). States where groundwater comes from shorter river systems have a clear tendency towards lower (though still in the range of 25%-30%) rates of obesity.

If this is the case, we should also see similar patterns in other countries.

It’s hard to find good province-level maps of obesity for China, but most of them look something like this:

China has two major rivers, the Yangzi and the Yellow river. Comparing our map of obesity to a map of China’s rivers, we see that Shandong Province, with the highest rate of obesity, is at the mouth of the Yellow River. Shanghai, at the mouth of the Yangzi, is not quite as obese, but still more obese than the neighboring provinces. And in general we see that provinces at lower elevations are more obese.

There are always a few confusing outliers, of course. Why are Maine, North Dakota, and Alabama so obese? In China, why are Xinjiang and Heilongjian provinces so obese? The answer is that watersheds play a role in the distribution of contaminants, but are not the whole story.

In some cases, though, the answer may come back to watersheds after all. For example, Xinjiang province’s main watershed is the Tarim Basin, an endorheic basin that captures water and has no outlet. Rain that falls in the Tarim Basin flows to Lop Nur and stays there. The water might evaporate, but any contaminants it carried will stay in the basin.

We see similar trends in data from Iran. In the map of Iran shown below, you can see that many of the most obese provinces are near the Caspian Sea, another endorheic basin. We weren’t able to find similar maps for Russia or for Kazakhstan, two other large countries bordering on the Caspian, but we would expect them to look similar.

There are obvious and often extreme differences in obesity between people at 0 ft of altitude and 500 ft of altitude, both in the US and in other countries. The changes in CO2 aren’t enough to make any difference, but water runoff could.

It’s important to note that altitude itself doesn’t affect obesity directly. Instead, altitude is a proxy for how high an area is in the watershed, which is itself a proxy for how badly the local water supply is contaminated. This is why Mississippi is more obese than low-lying areas of California. In California the water supply hasn’t traveled nearly as far in its path to the ocean, and has traveled past fewer farms, highways, cities, and factories.

Mystery 8: Diets Don’t Work 

Finally, no diet will reliably help because obesity isn’t caused by a bad diet and can’t be cured by a good one. Hypothetically speaking, if there was a person who was only exposed to these contaminants in their food, cutting out the contaminated food for long enough would theoretically cure them. This may be what happened with Chris Voight when he cut out everything but potatoes.

Ultimately, the fact that diets don’t work very well for most people suggests that we pick up these contaminants from other sources than just our food. Probably they are also, to varying degrees, in our water, our workplaces, and our homes.

3.3    Contamination

We aren’t the first researchers who are concerned about environmental contaminants and the role they might play in rising obesity rates. But the scope of this inquiry has traditionally been limited to how contaminants might contribute to the obesity epidemic.

One review focuses on food additives, both intentional (e.g. artificial sweeteners) and unintentional (pesticides), suggesting that “environmental contaminants are contributing to the global epidemic of obesity”, and suggests that the review will be “helpful in elucidating their role in the obesity epidemic”. Another review focused on endocrine disrupting chemicals, but closes by saying, “public health officials should think of the obesity epidemic as a function of a multifactorial complex of events, including environmental-endocrine disruptors.” Yet another mentions “nutrient quality, stress, fetal environment and pharmaceutical or chemical exposure as relevant contributing influences.”

Canaries in the Coal Mine documents the rise in obesity in wild and captive animals and suggests that “the aetiology of increasing body weight may involve several as-of-yet unidentified and/or poorly understood factors.” What factors could these be? They list a couple: viral pathogens, epigenetic factors, and at the very end of the paper, “the collection of endocrine-disrupting chemicals (endocrine-disruptors), widely present in the environment.”

A statement from the 2nd International Workshop on Obesity and Environmental Contaminants in Uppsala, Sweden concluded that “the findings from numerous animal and epidemiological studies are consistent with the hypothesis that environmental contaminants could contribute to the global obesity epidemic.”

A National Toxicology Program workshop from 2012 suggests that “exposures to environmental chemicals may be contributing factors to the epidemics of diabetes and obesity.” They suggest that there is a link between some forms of contamination and type 2 diabetes, but overall, they say that there is still not enough research to draw firm conclusions.

Despite this interest, all the claims have been quite mild, identifying environmental contaminants as possibly being one of many factors contributing in some small way to the obesity epidemic. In contrast, we propose that the obesity epidemic is entirely driven by environmental contaminants. The entire difference in obesity between 1980 and today is attributable to one or more contaminants that we are exposed to in our food, water, and living spaces.

Still, not everyone today is obese. There are two reasons for this. First of all, even though everyone is exposed, some people are exposed to more than other people. If you live in an environment with less exposure, for example at a higher altitude, on average you will be less obese.

Some people are also less affected by these contaminants than other people, even at the same dose, and this difference is largely genetic. But even these people probably still, on average, have much more body fat than their ancestors did. Hunter-gatherers have BMIs of around 22 or 23. Civil War veterans in the 1890s had average BMIs of about 23 as well. If your BMI is higher than 23, you’re probably fatter than you would be without the action of these contaminants.

Sometimes it is these factors in combination. If you have a genetic resistance and you’re exposed to low levels of these contaminants, you’ll be much less obese than average.

3.4    Further Evidence in Favor of Contaminants

The difference in obesity rates between countries, as well as the differences between states or provinces within a country, is also the result of differences in contamination. Some of it will be genetic, but some of it is because some places are more contaminated than others.

Some of the strongest evidence for this comes from immigration. When they arrive in a new country, immigrants usually have lower obesity rates than their native counterparts do, but over time they become about as obese as the natives are. Looking at the trends, it appears that much of the effect of the contaminants occurs in the first year of exposure, though it takes 10-15 years before immigrants have obesity rates similar to the rates in the host country.

During the Cuban economic crisis known as the “Special Period”, obesity rates plummeted, from 14% obese to 7% obese. Normally this is attributed to the decrease in calorie consumption and the increase in exercise, as oil shortages led people to drive less and walk or bike more. But we know already that reducing consumption and increasing exercise have very modest effects on weight loss.

The average Cuban lost about 20 pounds in just a couple of years — even though in 1993, two years into the crisis, the average Cuban was still eating a very reasonable 2,099 calories per day.

Distributions of BMI categories in Cienfuegos, Cuba, in 1991 and 1995.

Food was restricted, but very few people were starving. While obesity dropped from 14% to 7%, the number of people listed as “underweight” only went from 8% to 10.3% (see above). And it’s not like they were eating all that healthy — “the primary sources of energy during the crisis were sugar cane and rice.”

Rarely mentioned but particularly notable is that food imports virtually ceased during this period. If we assume that Cuban obesity was partially a result of contaminants in their food imports, this explains the data perfectly. Alternately, we can note that fertilizer and pesticide use sharply declined in this period as well, as both were normally derived from oil, which the island was now seriously lacking. These are also potential contaminants.

One surprising fact is that the most obese countries in the world by BMI are all tiny island nations in the south or central Pacific — Nauru, Tonga, Samoa, Tuvalu, Palau, the Cook Islands, and others. Depending on the year and the source, the 10 most obese nations in the world are usually small Pacific islands. Obesity rates in these countries are not merely high, they are clear outliers. The most obese mainland nations are around 35-40% obese, but these small Pacific islands have obesity rates in the range of 45-60%. Certainly this requires some sort of explanation.

To begin with, there are some reasons to suspect that this is largely an artefact. These islands all have very small populations and are genetically homogeneous, so it’s possible that much of the difference is genetic. Polynesians also appear to be slightly stouter and more muscular than other groups, which may mean that BMI is an especially bad measure for this group and leads us to slightly overestimate how obese they are. With a better measure of obesity, their obesity rates might be more similar to the rates of other very obese countries, like Kuwait and the United States.

In addition, Polynesian countries import most of their food and eat a lot of highly processed, canned meat (famously spam), which may be more contaminated than average. It’s also notable that Nauru, the most obese (61%) country in the world, has been heavily strip-mined for phosphate. This is interesting because mining is a major source of environmental contamination. For comparison, West Virginia is an obesity outlier in the United States, and it too has a long history of strip mining. In any case, this is why Nauru imports so much food — with about 80% of the island strip-mined, they can’t grow anything there. Most of these islands are not so heavily mined, of course, but this might explain why Nauru is 61% obese and Samoa is “only” 47% obese.


[Next Time: RETURN TO HOT CICO]


A Chemical Hunger – Part II: Current Theories of Obesity are Inadequate

[PART I – MYSTERIES]

Current theories of the obesity epidemic are inadequate. None of them hold up to closer scrutiny, and none can explain all of the mysteries mentioned in Part I. But these mysteries are real, puzzling data about the obesity epidemic.

You’re probably familiar with several theories of the obesity epidemic, but there is strong evidence against all of them. In this section, we focus on the case against a couple of the most popular theories. 

2.1    Calories In, Calories Out

A popular theory of obesity is that it’s simply a question of calories in versus calories out (CICO). You eat a certain number of calories every day, and you expend some number of calories based on your metabolic needs and physical activity. If you eat more calories than you expend, you store the excess as fat and gain weight, and if you expend more than you eat, you burn fat and lose weight.

This perspective assumes that the body stores every extra calorie you eat as body fat, and that it doesn’t have any tools for using more or less energy as the need arises. But this isn’t the case. Your body has the ability to regulate things like its temperature, and it has similar tools to regulate body fatness. When we look closely, it turns out that “calories in, calories out” doesn’t match the actual facts of consumption and weight gain.

“This model seems to exist mostly to make lean people feel smug,” writes Stephen Guyenet, “since it attributes their leanness entirely to wise voluntary decisions and a strong character. I think at this point, few people in the research world believe the CICO model.”

It’s not that calories don’t matter at all. People who are on a starvation diet of 400 calories per day will lose weight, and as we will see in this section, people who eat hundreds of calories more than they need will usually gain weight. The problem is that this ignores how the body accounts for the calories coming in and going out. If you don’t eat enough, your body finds ways to burn fewer calories. If you eat too much, your body doesn’t store all of the excess as fat, and compensates by making you less hungry later on. Calories are involved in the math but it’s not as simple as “weight gain = calories in – calories out”.

[Edit: We’ve added an interlude clarifying this section on CICO in response to reader questions and objections. If you have objections to anything below, read the interlude here because we probably address it!]

2.1.1    Common Sense

First, we want to present some common-sense arguments for why diet and exercise alone don’t explain modern levels of obesity.

Everyone “knows” that diet and exercise are the solution to obesity. Despite this, rates of obesity continue to increase, even with all the medical advice pointing to diet and lifestyle interventions, and a $200 billion global industry devoted to helping people implement these interventions. It’s not that no one is listening. People are exercising more today than they were 10 or even 20 years ago. Contrary to stereotypes, more than 50% of Americans meet the HHS guidelines for aerobic exercise. But obesity is still on the rise.

It’s true that people eat more calories today than they did in the 1960s and 70s, but the difference is quite small. Sources have a surprisingly hard time agreeing on just how much more we eat than our grandparents did, but all of them agree that it’s not much. Pew says calorie intake in the US increased from 2,025 calories per day in 1970 to about 2,481 calories per day in 2010. The USDA Economic Research Service estimates that calorie intake in the US increased from 2,016 calories per day in 1970 to about 2,390 calories per day in 2014. Neither of these are jaw-dropping increases.

If we go back further, the story actually becomes even more interesting. Based on estimates from nutrient availability data, Americans actually ate more calories in 1909 than they did in 1960.

Finally, there are many medical conditions that cause obesity. For example, Prader-Willi Syndrome, a genetic disorder characterized by intense hunger and resulting obesity, hypothyroidism, an endocrine disorder where people experience loss of appetite yet still gain 5-10 pounds, and lesions to the hypothalamus, which often lead to intense weight gain, sometimes accompanied by great hunger but many times not.

2.1.2    Scientific Evidence

In addition to these common-sense objections, decades of research suggests that diet and exercise are not to blame for rising rates of obesity.

Studies of controlled overfeeding — you take a group of people and get them to eat way more than they normally would — reliably find two things. First, a person at a healthy weight has to eat huge amounts of calories to gain even a couple pounds. Second, after the overfeeding stops, people go right back to the weight they were before the experiment.

The great-grandaddy of these studies is the Vermont prison experiment, published in 1971. Researchers recruited inmates from the Vermont State Prison, all at a healthy weight, and assigned some of them to eat enormous amounts of food every day for a little over three months. How big were these meals? The original paper doesn’t say, but later reports state that some of the prisoners were eating 10,000 calories per day.

On this olympian diet, the prisoners did gain considerable weight, on average 35.7 lbs (16.2 kg). But following the overfeeding section of the study, the prisoners all rapidly lost weight without any additional effort, and after 10 weeks, all of them returned to within a couple pounds of their original weight. One prisoner actually ended up about 5 lbs (2.3 kg) lighter than before the experiment began!

Inspired by this, in 1972, George Bray decided to conduct a similar experiment on himself. He was interested in conducting overfeeding studies, and reasoned that if he was going to inflict this on others, he should be willing to undergo the procedure himself. First he tried to double each of his meals, but found that he wasn’t able to gain any weight — he simply couldn’t fit two sandwiches in his stomach at every sitting.

He switched to energy-dense foods, especially milkshakes and ice cream, and started eating an estimated 10,000 calories per day. Soon he began to put on weight, and gained about 22 lbs (10 kg) over 10 weeks. He decided this was enough and returned to his normal diet. Six weeks later, he was back at his original weight, without any particular effort.

In both cases, you’ll notice that even when eating truly stupendous amounts of food, it actually takes more time to gain weight than it does to lose it. Many similar studies have been conducted and all of them find basically the same thing — check out this recent review article of 25 studies for more detail.

Overfeeding in controlled environments does make people gain weight. But they don’t gain enough weight to explain the obesity epidemic. If you eat 10,000 calories per day, you might be able to gain 20 or 30 pounds, but most Americans aren’t eating 10,000 calories per day.

We can compare these numbers to the increases in average calories per day we reviewed earlier. Sure, consumption in the US went from 2,025 calories per day in 1970 to 2,481 calories per day in 2010, a difference of 456 calories. But consider Poehlman et al. (1986), where researchers fed a group of 12 men 1,000 extra calories a day for 22 days. On average the men gained about 5 lbs (2.2 kg), but some of them actually lost weight instead.

And it’s not as though these participants are eating 1,000 extra calories of celery and carrots. In one study, the extra calories came from “sherbet, fruit juices, margarine, corn oil, and cookies”. But the content doesn’t seem to matter very much. Another study compared overfeeding with carbohydrates (mostly starch and sugar) and overfeeding with fat (mostly dairy fat like cream and butter). The two groups got their extra calories from different sources, but they were overfed by the same amount. After two weeks, both groups gained the same amount of fat, 3.3 lbs on average. A similar study overfed volunteers by 1,194 calories on either a high-carb or a high-fat diet for 21 days. Both groups gained only about 2 lbs of fat.

The fact that many of these are twin studies provides even more evidence against CICO. In groups of twins that are all overfed by the same amount, there is substantial variation between the different participants in general. Some people gain a lot of weight, others gain almost none. But each person gains (or loses!) about the same amount of weight as their twin. In some cases these correlations can be substantial, as high as r = 0.90. This strongly suggests that genetics plays a large role in determining how the body responds to overfeeding.

The story with exercise is the same as with overeating — it makes a difference, but not much. One randomized controlled trial assigned overweight men and women to different amounts of exercise. More exercise did lead to more body fat loss, but even in the group exercising the most — equivalent to 20 miles (32.0 km) of jogging every week for eight months — people only lost about 7 lbs.

You might think that hunter-gatherers have a more active lifestyle than we do, but this isn’t always true. The Kitavans examined in 1990 by Staffan Lindeberg were only slightly more active than westerners, had more food than they knew what to do with, and yet were never obese. “Many Westerners have a level of physical activity that is well within the range of the Kitava population,” he wrote. “Hence, physical activity does not seem to explain most of the differences in disease pattern between Kitava and the Western world.”

A recent meta-analysis of 36 studies compared the effects of interval training exercise with more traditional moderate-intensity continuous training. The authors call interval training “the magic bullet for fat loss” (this is literally in the title) and trumpet that it provides 28.5% greater reductions in total absolute fat mass than moderate exercise. But what they don’t tell you is that this is a difference between a loss of about 3 lbs and about 4 lbs, for an exercise program running 12 weeks long. Needless to say, this difference isn’t very impressive. Other meta-analyses find similar results: “neither short-term HIIT/SIT nor MICT produced clinically meaningful reductions in body fat.”

Maybe diet and exercise together are worth more than the sum of their parts? Sadly this doesn’t seem to be the case either. If anything, when combined they are worth less than the sum of their parts. One meta-analysis comparing interventions based on diet, exercise, and diet plus exercise found that people lost about 23.5 lbs (10.7 kg) on diets, 6.4 lbs (2.9 kg) on an exercise regime, and 24.2 lbs (11.0 kg) on diet plus exercise. After a year, diet plus exercise was down to 18.9 lbs (8.6 kg). Other meta-analyses are more tempered, for example, finding a loss of about 3.6 lbs (1.6 kg) after two years of diet plus exercise interventions. Again this is more weight loss than zero, but it clearly rules out diet plus exercise as an explanation for the obesity epidemic. People in 1950 were a lot leaner than they are now, but it’s not because they ate less and exercised more.

2.2    Good Calories and Bad Calories

Ok, calories themselves may not be the villain here. But maybe it’s not that we’re eating more than we used to — maybe it’s that we’re eating differently. Maybe one particular macronutrient or source of calories is to blame.

2.2.1    Dietary Fat

Dietary fat seems like a possible culprit. After all, fat makes you fat, right? Turns out it’s not so simple.

To begin with, fat consumption has actually fallen over the past few decades, while obesity has skyrocketed. This isn’t consistent with an explanation where dietary fat leads to obesity.

Plenty of cultures eat extremely high-fat diets and remain very lean indeed. You’ll remember that the Maasai diet is about 3000 calories per day, and 66% of that is from fat. But the Maasai don’t suffer from obesity. In fact, Kalahari Bushmen love fat and apparently wax poetic about it.

Clinical results agree: dietary fat doesn’t have much of an impact on long-term weight. Putting people on a low-fat diet reduces their weight in the short term, but in trials lasting for longer than one year, they tend to return to normal. When they are directly compared, low-fat and high-fat diets have about the same impact on weight loss.

This is a little difficult to square with animal studies that find that a high-fat diet reliably leads to obesity in monkeys, dogs, pigs, hamsters, squirrels, rats, and mice. It could just be that humans are not monkeys, dogs, pigs, hamsters, squirrels, rats, or mice, and that while dietary fat has an adverse effect on these species, it doesn’t do much to us. Some of the hamster studies, for example, induced obesity simply by giving the hamsters extra sunflower seeds, a phenomenon not observed in humans. Pigs, in particular, will become obese even on low-fat diets when given the opportunity.

We even see differences within a specific kind of animal. The same high-fat diet will make one species of hamster (Syrian hamsters) obese and leave another species of hamster (golden hamsters) merely chubby. If the findings can’t generalize between different species of hamsters, we shouldn’t expect them to generalize to humans.

It could also be that dietary fat leads to obesity in mammals held in captivity, possibly due to factors like stress. Metabolic ward studies restrict your movement, but it’s not exactly like living your whole life in a laboratory cage. And it’s worth noting that about 10–15% of macaque and rhesus monkeys in captivity become obese when they reach middle age, despite the fact that they are fed a relatively low-fat (10% of energy) diet.

In any case, it’s hard to square a fat-based explanation for the obesity epidemic with the fact that fat consumption hasn’t increased in step with the rise of obesity and the fact that low-fat diets don’t lead to much weight loss.

2.2.2    Carbohydrates

Ok, maybe fat doesn’t make you fat. How about carbohydrates? All this bread can’t be good for us.

This theory is dead on the starting line, though, because as obesity has gone up, consumption of carbohydrates has gone down (see figure).

Overall carbohydrate intake from 1980 to 2010 in the United States. Figure prepared by Stephan J Guyenet, reproduced with permission.

This is enough to make it clear that carbohydrate consumption isn’t driving the obesity epidemic, but we can take a slightly closer look anyways, just to be sure.

Eating lots of carbs can actually make you lose weight. High-carbohydrate diets cause weight loss, even when not restricting calories. A study from 2003 examined low-fat diets in 16 overweight people. Naturally, this low-fat diet was high in carbohydrates. When patients started the low-fat diet and were told to eat as much as they wanted, they actually ate 291 calories less per day.

But their carbohydrate intake increased, from 253 grams per day to 318 grams per day. On this diet they lost 8 lbs (3.8 kg) on average over a 12-week period. In the DIETFITS randomized controlled trial, 609 people fed a whole-food, high-carbohydrate diet lost 12 pounds (5.3 kg) over one year, not significantly different from the 13 pounds (6.0 kg) of weight lost on a whole-food low-carbohydrate diet. The high-carbohydrate diet also supplied about 1.5 times as much sugar as the low-carbohydrate diet.

The residents of Kitava, mentioned earlier, have a diet of starchy roots and tubers. Almost 70% of their calories come from carbohydrates, but they don’t suffer from obesity, diabetes, or heart disease. 

(Lindeberg also says: “The long primate history of fruit eating, the high activity of human salivary amylase for effcient starch digestion, and some other features of human mouth physiology … suggest that humans are well prepared for a high carbohydrate intake from non-grain food sources. … in contrast to most other animals including non-human primates, humans have an exceptional capacity to produce salivary amylase in order to begin hydrolysis of starch in the mouth.”)

In general, cultures with very high intakes of carbohydrate tend to be lean. Most agricultural societies around the world have a diet that is high in carbohydrates and low in fat. Agricultural societies are different from industrialized ones in many ways, of course. But even in those agricultural cultures with abundant food, people are typically lean, with low rates of diabetes and cardiovascular disease.

This is true even if the carbohydrate is white rice. In Japan, white rice is a primary staple food (p. 338), and has been for a long time. About 62% of the Japanese diet is carbohydrates, and most of this is white rice. Despite this, Japanese rates of obesity have been, and continue to be, the lowest of any industrialized nation.

In fact, people who move from Japan to the US and begin eating less white rice become much heavier. This suggests that the difference isn’t simply genetic. These immigrants do end up eating a diet much higher in fat — but of course, from the previous section, we’ve seen that fat can’t be responsible for this change.

Nor is it likely to be some other carbohydrate staple. Wheat consumption, for example, has been falling for a century. People in the US ate almost twice as much wheat (primarily in the form of bread) in the 1880’s than they do today. If wheat were responsible, people would have been massively obese during reconstruction and entirely lean today. Obviously that is not what we observe.

If the historical data isn’t enough for you, there are entire reviews devoted to the health impacts of wheat, pretty conclusively showing that it isn’t a cause of obesity.

2.2.3    Sugar

Everyone knows that added sugar is the real villain, right? Wrong again.

Sugar consumption has been declining for 20 years in the US, while obesity and diabetes rates have increased. The sugar data in the figure below includes all added sugars such as honey, table sugar, and high-fructose corn syrup, but doesn’t include sugars naturally occurring in fruits and vegetables.

 Overall sugar intake from 1980 to 2013 in the United States. Figure prepared by Stephan J Guyenet, reproduced with permission.

We see something similar in what has been called The Australian Paradox, where obesity in Australia nearly tripled between 1980-2003, while sugar consumption dropped 23%.

Multiple lines of evidence confirm that sugar consumption is falling worldwide. In the US, consumption of sugary beverages dropped between 1999 and 2010. We see the same trend in longitudinal studies of a particular cohort tracked from 1991 to 2008. It’s not that consumers can’t find the sugar they crave, of course — there have been no major changes in the availability of sugary foods.

We see that public health efforts to reduce sugar consumption have worked. In fact, they’ve worked very well. But they don’t seem to have made any difference to the obesity epidemic.

Tightly-controlled metabolic ward studies also show that the sugar content of a diet doesn’t matter much. One study of 17 men compared a 25 percent sugar, high-carbohydrate diet to a 2 percent sugar, very-low-carbohydrate (ketogenic) diet of equal calories. After four weeks, they found that the high-carbohydrate diet caused slightly more body fat loss than the very-low-carbohydrate (ketogenic) diet, despite the fact that the two diets differed more than tenfold in sugar content. We see similar results in mice and in rats: “Animals fed a low-fat, high-sucrose (LH) diet were actually leaner than animals fed a high-complex-carbohydrate diet.”

We can further cite the fact that many cultures, such as the Hadza of Tanzania, the Mbuti of the Congo, and the Kuna of Panama all eat diets relatively high in sugar (sometimes as high at 80%), and yet none of these cultures have noticeable rates of obesity, diabetes, cardiovascular disease, etc.

2.3    Diet in General

Over the past 40 years, there hasn’t been much of a change in where people get their calories from. Americans get about 50% of their calories from carbohydrates, 30% from fat, and 20% from protein, and they have for years. At the same time obesity continues to go up and up. Comparing these two trends, it’s hard to imagine that macronutrients have anything to do with the obesity epidemic.

You’ll recall that Mystery 8 is that all diets work about equally well. It doesn’t matter which diet you choose — you lose about the same number of pounds regardless.

All diets work. The problem is that none of them work very well. Stick to just about any diet for a couple weeks and you will probably lose about 10 pounds. This is ok, but it isn’t much comfort for someone who is 40 lbs overweight. And it isn’t commensurate with the size of the obesity epidemic.

Systematic comparison of weight-loss diets with different compositions of fat, protein, and carbohydrates finds that across many different reduced-calorie diets, people lose about 13.2 lbs (6 kg) over six months, and that in all cases people began to gain weight back after 12 months. It’s not just weight loss, either. Satiety, hunger, satisfaction with the diet, and adherence to the protocol is similar for all diets.

There are too many diets to review in full, of course, but we see the same pattern in every diet that has been extensively studied. Let’s look at just a few.

2.3.1    Ketogenic Diet

We’ve already mentioned a few ketogenic diets, and as we’ve seen, they don’t work much better than other diets do.

There is one meta-analysis of ketogenic diet studies, comparing very-low-carbohydrate ketogenic diets to low fat diets in overweight and obese adults. Across thirteen randomized controlled trials, ketogenic diets only caused 2 pounds (0.9 kg) more weight loss than the traditional low-fat diets after 12 months.

2.3.2    Low-Glycemic Diet

Study after study finds that low-glycemic diets don’t work for weight loss.

One study from 2007 randomly assigned 203 women to either a high-glycemic or low-glycemic diet. The difference in glycemic index was considerable, with the high-glycemic diet having an index twice as high as the low-glycemic diet. The groups consumed the same amount of calories and reported similar levels of hunger.

Despite this, there was no difference between the groups. After two months the LGI group had lost 1.6 lbs (0.72 kg) and the HGI group had lost 0.7 lbs (0.31 kg), but this difference wasn’t sustained. After 18 months on the diet, the LGI group had lost 0.9 lbs (0.41) kg and the HGI group had lost 0.6 lbs (0.26 kg), and this difference was statistically indistinguishable (p = .93). Large differences in glycemic index have no meaningful long-term (or even short-term) effect on calorie consumption or body weight.

Another 18-month randomized trial compared a low-glycemic load (40% carbohydrate and 35% fat) vs low-fat (55% carbohydrate and 20% fat) diet in 73 obese young adults in the Boston, Massachussets area. In both diets, participants were largely eating whole foods; vegetables, beans, and fruit were major components of both diets. In both diets, people were allowed to eat as much as they wanted.

Both groups reported similar levels of hunger and consumed similar amounts of calories. The two diets were rated equally easy to stick to and equally tasty. Both groups lost about 4-5 lbs after 6 months. But both groups started to gain weight back soon after. In fact, the trajectory of weight loss is so identical, we simply have to show you the graph:

Trajectory of weight loss on two diets.

Note the p-value of 0.99, which indicates that the two trajectories are about as statistically indistinguishable as is mathematically possible.

We find this in study after study. Meta-analysis also finds that low-glycemic diets don’t do any better than other diets when it comes to weight loss. When the reviewers pick out the studies that show the best performance for low-glycemic diets, they still find a difference of only 4 lbs (1.8 kg). If that’s a success, we have to wonder what failure would look like.

2.3.3    Future Dietary Explanations

Eating fewer calories will lead most people to lose a couple pounds, and it doesn’t really matter what calories they restrict. Cutting back on fat works about as well as cutting back on carbs. In both cases, a couple pounds isn’t enough to explain the obesity epidemic.

Over the past 50 years, medical science has looked at diet from practically every angle. But none of these diet-based explanations have gone anywhere. People are still getting fatter. They got fatter over the last decade. And they got fatter over the decade before that. And the one before that. Every country in the world is growing more obese. And the trend has never once been reversed.

You could certainly cook up another diet-based explanation. But there’s no reason to expect that this explanation would do any better than any of the others.

It’s time to start looking for explanations outside the world of calories, macronutrients, and exercise. At this point, we should assume that the obesity epidemic isn’t caused by our diet.

Could it be a lifestyle difference? Possibly, but signs point against it. Smoking is more prevalent in Japan than among Japanese-Americans, yet Japanese-Americans have much higher rates of hypertension. Similarly, many hunter-gatherers are heavy smokers, including the Kitavans (76% of men and 80% of women) and the Bushmen of South Africa, but these societies have no sign of heart disease.

2.5    Lipostat

There is one theory of obesity which is almost entirely satisfying, based around the body’s ability to regulate its adiposity.

A house has a thermostat. The owner of the house sets the temperature to 72 degrees F. The thermostat detects the temperature of the house and takes action to drive the temperature to the set point of 72°F. If the house is too cold, the thermostat will turn on the furnace. If the house is too warm, the thermostat will turn on the air conditioning.

The human body has a lipostat (from the Greek lipos, meaning fat). Evolution and environmental factors set body fatness to some range — perhaps a BMI of around 23. The lipostat detects how much fat is stored and takes action to drive body fatness to the set point of a BMI of 23. If your body is too thin, the lipostat will drive you to eat more, exercise less, sleep more, and store more of what you eat as fat. If your body is too fat, the lipostat will turn on the air conditioning. Just kidding, the lipostat will drive you to eat less, move and fidget more, and store less of the food you eat as fat.

According to this theory, people become obese because something has gone wrong with the lipostat. If the owner of a house sets the thermostat to 120°F, the house will quickly become too hot, and it will stay that way until the set point is changed or the furnace explodes. Something similar is happening in obesity. The set point has been moved from a healthy and natural level of adiposity (BMI of about 23) to an unusually high level (BMI 30+), and all the regulatory systems of the body are working in concert to push adiposity to that level and keep it there.

The lipostat model is supported by more than a hundred years of evidence. By the 1970s, Dr. Michel Cabanac and collaborators were publishing papers in the journal Nature on what they called the “ponderostat” (pondero = weight). This was later revised to the adipostat (adipo = fat), and eventually, as we call it here, the lipostat.

Modern neuroscience and medical review articles (those are three separate links) overwhelmingly support this homeostatic explanation. In animals and humans, brain damage to the implicated areas leads to overeating and eventual obesity. These systems are well-understood enough that by targeting certain neurons you can cure or cause obesity in mice. While we don’t approve of destroying neurons in human brains with hyperspecific chemical techniques, the few weight-loss drugs approved by the FDA largely act on the brain (hopefully without destroying any neurons).

The lipostat explains why diet and exercise work a little, why they don’t work well enough to reverse obesity, and why even people who lose weight on diets generally end up gaining that weight right back.

In a house where the thermostat has been set to 120°F, there are a lot of things we can do to lower the temperature. We can open all the doors and windows. We can open the icebox. We can order mountains of dry ice off of the internet. All of these things will lower the temperature of the house a little, but even with these measures, the house will still be hotter than the healthy temperature of 72ºF. The furnace will work double-time to push the temperature back up to 120ºF, if it’s not redlining already. And as soon as you relax any of your heat-dissipation measures, the temperature will go right back up to where it was before.

(We can also go down into the basement and hit the furnace with crowbars until it doesn’t work very well anymore. This is a pretty extreme solution and also, incidentally, why gastric bypass surgery works so great.)

When people intentionally overeat, as in the overfeeding studies we reviewed, they temporarily gain a little weight, but when they stop overeating, they quickly return to their original weight. When people intentionally undereat, as they do on a diet, they temporarily lose a little weight, but when they stop undereating they quickly return to their original weight. In fact, they usually return to near their original weight even if they keep undereating. The lipostat has a target weight and, when not actively opposed, it will push your body weight to that weight and do its best to keep it there.

There are many signals that the brain uses to measure how much fat the body is carrying. One of the most important is the hormone leptin, which is naturally produced by fat cells. Part of the action of the lipostat is making sure that leptin levels are kept within a desired range, which helps keep us at a desired weight.

Very rarely, people are born with a genetic mutation that makes it so their fat cells no longer produce leptin. The lipostat notices that it isn’t detecting any leptin, and assumes that the body has no fat stores at all, with predictable results. Usually these children are of normal birth weight, but from the first weeks of their lives, they are insatiably hungry. By age two, they weigh more than 50 pounds, and may be as high as 60% fat by weight. They have a truly incredible drive to eat:

. . . leptin-deficient children are nearly always hungry, and they almost always want to eat, even shortly after meals. Their appetite is so exaggerated that it’s almost impossible to put them on a diet: if their food is restricted, they find some way to eat, including retrieving stale morsels from the trash can and gnawing on fish sticks directly from the freezer. This is the desperation of starvation [. . . ] they become distressed if they’re out of sight of food, even briefly. If they don’t get food, they become combative, crying and demanding something to eat.

The lipostat account is extremely convincing. The only weakness in the theory is that it’s not clear what could cause the lipostat to be set to the wrong point. In leptin-deficient children, their body simply can’t detect that they are obese. But most people produce leptin just fine. What is it that throws this system so totally out of balance?

While the lipostat perspective does in a sense explain why people become obese (their lipostat is out of alignment), it’s not really a theory of the obesity epidemic, since it doesn’t explain why our lipostats began getting more and more out of balance around 1980.

Even advocates of the theory are perfectly willing to admit this. In The Hungry Brain, Stephen Guyenet writes:

Many researchers have tried to narrow down the mechanisms by which [diet] causes changes in the hypothalamus and obesity, and they have come up with a number of hypotheses with varying amounts of evidence to support them. Some researchers believe the low fiber content of the diet precipitates inflammation and obesity by its adverse effects on bacterial populations in the gut (the gut microbiota). Others propose that saturated fat is behind the effect, and unsaturated fats like olive oil are less fattening. Still others believe the harmful effects of overeating itself, including the inflammation caused by excess fat and sugar in the bloodstream and in cells, may affect the hypothalamus and gradually increase the set point. In the end, these mechanisms could all be working together to promote obesity. We don’t know all the details yet…

Guyenet favors a “food reward” explanation, where eating “highly rewarding food” causes a mild form of brain damage that turns up the set point of the lipostat. He’s even gone so far as to propose (as an April Fools joke) a collection of boring recipes called The Bland Food Cookbook.

You’ll notice that in all these theories, the factors that damage the lipostat are related to diet. But as we’ve just argued above, the persistent failure to find a solution in our diets strongly suggests that we should start looking elsewhere for the explanation.

2.6    What, Then?

We should start seriously considering other paradigms. If diet and exercise are out as explanations for the epidemic, what could possibly explain it? And what could possibly explain all of the other bizarre trends that we have observed?


[Next Time: A CHEMICAL HUNGER]


A Chemical Hunger – Part I: Mysteries

The study of obesity is the study of mysteries.

Mystery 1: The Obesity Epidemic 

The first mystery is the obesity epidemic itself. It’s hard for a modern person to appreciate just how thin we all were for most of human history. A century ago, the average man in the US weighed around 155 lbs. Today, he weighs about 195 lbs. About 1% of the population was obese back then. Now it’s about 36%.

Back in the 1890s, the federal government had a board of surgeons examine several thousand Union Army veterans who fought in the Civil War. This was several decades after the end of the war, so by this point the veterans were all in their 40’s or older. This gives us a snapshot of what middle-aged white men looked like in the 1890s. When we look at their data, we find that they had an average BMI of about 23 (overweight is a BMI of 25 and obese is a BMI of 30 or more). Only about 3% of them were obese. In comparison, middle-aged white men in the year 2000 had an average BMI of around 28. About 24% were obese in early middle age, increasing to 41% by the time the men were in their 60s.

(Most experts consider measures like body fat percentage to be better measures of adiposity than BMI, and we agree. Unfortunately, nearly every source reports BMI, and most don’t report body fat percentage. Here, we use BMI so that we can compare different sources to one another.)

It’s not just that we’re a little fatter than our great-grandparents — the entire picture is different.


People in the 1800s did have diets that were very different from ours. But by conventional wisdom, their diets were worse, not better. They ate more bread and almost four times more butter than we do today. They also consumed more cream, milk, and lard. This seems closely related to observations like the French Paradox — the French eat a lot of fatty cheese and butter, so why aren’t they fatter and sicker?

Our great-grandparents (and the French) were able to maintain these weights effortlessly. They weren’t all on weird starvation diets or crazy fasting routines. And while they probably exercised more on average than we do, the minor difference in exercise isn’t enough to explain the enormous difference in weight. Many of them were farmers or laborers, of course, but plenty of people in 1900 had cushy desk jobs, and those people weren’t obese either.

Something seems to have changed. But surprisingly, we don’t seem to have any idea what that thing was.

Mystery 2: An Abrupt Shift 

Another thing that many people are not aware of is just how abrupt this change was. Between 1890 and 1976, people got a little heavier. The average BMI went from about 23 to about 26. This corresponds with rates of obesity going from about 3% to about 10%. The rate of obesity in most developed countries was steady at around 10% until 1980, when it suddenly began to rise.

Trends in adult overweight, obesity, and severe obesity among men and women aged 20–74: United States, 1960–1962 through 2015–2016. SOURCES: NCHS, National Health Examination Survey and National Health and Nutrition Examination Surveys.

Today the rate of obesity in Italy, France, and Sweden is around 20%. In 1975, there was no country in the world that had an obesity rate higher than 15%.

This wasn’t a steady, gentle trend as food got better, or diets got worse. People had access to plenty of delicious, high-calorie foods back in 1965. Doritos were invented in 1966, Twinkies in 1930, Oreos in 1912, and Coca-Cola all the way back in 1886. So what changed in 1980?

Common wisdom today tells us that we get heavier as we get older. But historically, this wasn’t true. In the past, most people got slightly leaner as they got older. Those Civil War veterans we mentioned above had an average BMI of 23.2 in their 40s and 22.9 in their 60’s. In their 40’s, 3.7% were obese, compared to 2.9% in their 60s. We see the same pattern in data from 1976-1980: people in their 60s had slightly lower BMIs and were slightly less likely to be obese than people in their 40s (See the table below). It isn’t until the 1980s that we start to see this trend reverse. Something fundamental about the nature of obesity has changed.

Distribution of BMI and obesity prevalence, non-Hispanic white men in the US by time period and age group. Adapted from Helmchen & Henderson, 2003.

Mystery 3: The Ongoing Crisis 

Things don’t seem to be getting any better. A couple decades ago, rising obesity rates were a frequent topic of discussion, debate, and concern. But recently it has received much less attention; from the lack of press and popular coverage, you might reasonably assume that if we aren’t winning the fight against obesity, we’ve gotten at least to a stalemate.

But this simply isn’t the case. Americans have actually gotten more obese over the last decade. In fact, obesity increased more than twice as much between 2010 and 2018 than it did between 2000 and 2008.

Rates of obesity are also increasing worldwide. As The Lancet notes, “unlike other major causes of preventable death and disability, such as tobacco use, injuries, and infectious diseases, there are no exemplar populations in which the obesity epidemic has been reversed by public health measures.”

All of this is, to say the least, very mysterious.

1.1    Weird Mysteries

Then there are the weird mysteries.

Mystery 4: Hunter-Gatherers 

A common assumption is that humans evolved eating a highly varied diet of wild plants and animals, that our bodies still crave variety, and that we would be better off with a more varied diet. But when we look at modern hunter-gatherers, we see this isn’t true. The !Kung San of Tanzania get about 40% of their calories from a single food source, the mongongo nut, with another 40% coming from meat. But the !Kung are extremely lean (about 110lbs on average) and have excellent cardiovascular health.

Of course, variety isn’t everything. You would also expect that people need to eat the right diet. A balanced diet, with the right mix of macronutrients. But again, this doesn’t seem to be the case. Hunter-gatherer societies around the world have incredibly different diets, some of them very extreme, and almost never suffer from obesity.

Historically, different cultures had wildly different diets — some hunter-gatherers ate diets very high in sugar, some very high in fat, some very high in starch, etc. Some had diets that were extremely varied, while others survived largely off of just two or three foods. Yet all of these different groups remained lean. This is strong evidence against the idea that a high-fat, high-sugar, high-starch, low-variety, high-variety, etc. diet could cause obesity.

A Tanzanian hunter-gatherer society called the Hadza get about 15 percent of their calories from honey. Combined with all the sugar they get from eating fruit, they end up eating about the same amount of sugar as Americans do. Despite this, the Hadza do not exhibit obesity. Another group, the Mbuti of the Congo, eat almost nothing but honey during the rainy season, when honey can provide up to 80% of the calories in their diet. These are all unrefined sugars, of course, but the Kuna of Panama, though mostly hunter-gatherers, also obtain white sugar and some sugar-containing foods from trade. Their diet is 65% carbohydrate and 17% sugar, which is more sugar than the average American currently consumes. Despite this the Kuna are lean, with average BMIs around 22-23.

The Inuit, by contrast, traditionally ate a diet consisting primarily of seal meat and blubber, with approximately 50% of their calories coming from fat. This diet is quite low in fruits and vegetables, but obesity was virtually unknown until the arrival of western culture. The Maasai are an even more extreme example, subsisting on a diet composed “almost exclusively of milk, blood, and meat”. They drink “an average of 3 to 5 quarts/day of their staple: milk supplemented with cow’s blood and meat“. This adds up to about 3000 calories per day, 66% of those calories being from fat. (They also sometimes eat honey and tree bark.) But the Maasai are also quite lean, with the average BMI for both men and women being again in the range of 22-23, increasing very slightly over age.

Kitava is a Melanesian island largely isolated from the outside world. In 1990, Staffan Lindeberg went to the island to study the diet, lifestyle, and health of its people. He found a diet based on starchy tubers and roots like yam, sweet potato, and taro, supplemented by fruit, vegetables, seafood, and coconut. Food was abundant and easy to come by, and the Kitavans ate as much as they wanted. “It is obvious from our investigations,” wrote Lindeberg, “that lack of food is an unknown concept, and that the surplus of fruits and vegetables regularly rots or is eaten by dogs.”

About 70% of the calories in the Kitavan diet came from carbohydrates. For comparison, the modern American diet is about 50% carbohydrates. Despite this, none of the Kitavans were obese. Instead they were in excellent health. Below, you’ll see a photo of a Kitavan man being examined by Lindeberg.

Kitavans didn’t even seem to gain weight in middle age. In fact, BMI was found to decrease with age. Many lived into their 80s or 90s, and Lindeberg even observed one man who he estimated to be 100 years old. None of the elderly Kitavans showed signs of dementia or memory loss. The Kitavans also had no incidence of diabetes, heart attacks, stroke, or cardiovascular disease, and were unfamiliar with the symptoms of these diseases. “The only cases of sudden death they could recall,” he reports, “were accidents such as drowning or falling from a coconut tree.”

Mystery 5: Lab Animals and Wild Animals 

Humans aren’t the only ones who are growing more obese — lab animals and even wild animals are becoming more obese as well. Primates and rodents living in research colonies, feral rodents living in our cities, and domestic pets like dogs and cats are all steadily getting fatter and fatter. This can’t be attributed to changes in what they eat, because lab animals live in contained environments with highly controlled diets. They’re being fed the same foods as always, but for some reason, they’re getting fatter.

This seems to be true everywhere you look. Our pets may eat scraps from the table, but why would zoo animals, being fed by professionals, also be getting fatter? Even horses are becoming more obese. This is all very strange, and none of it fits with the normal explanations for the obesity epidemic.

Mystery 6: Palatable Human Food 

Lab rats gain some weight on high-fat diets, but they gain much more weight on a “cafeteria diet” of human foods like Froot Loops [sic] and salami (see also here).

It used to be that if researchers needed obese rats for a study, they would just add fat to normal rodent chow. But it turns out that it takes a long time for rats to become obese on this diet. A breakthrough occurred one day when a graduate student happened to put a rat onto a bench where another student had left a half-finished bowl of Froot Loops. Rats are usually cautious around new foods, but in this case the rat wandered over and began scarfing down the brightly-colored cereal. The graduate student was inspired to try putting the rats on a diet of “palatable supermarket food”; not only Froot Loops, but foods like Doritos, pork rinds, and wedding cake. Today, researchers call these “cafeteria diets”.

Sure enough, on this diet the rats gained weight at unprecedented speed. All this despite the fact that the high-fat and cafeteria diets have similar nutritional profiles, including very similar fat/kcal percentages, around 45%. In both diets, rats were allowed to eat as much as they wanted. When you give a rat a high-fat diet, it eats the right amount and then stops eating, and maintains a healthy weight. But when you give a rat the cafeteria diet, it just keeps eating, and quickly becomes overweight. Something is making them eat more. “Palatable human food is the most effective way to cause a normal rat to spontaneously overeat and become obese,” says neuroscientist Stephan Guyenet in The Hungry Brain, “and its fattening effect cannot be attributed solely to its fat or sugar content.”

Rodents eating diets that are only high in fat or only high in carbohydrates don’t gain nearly as much weight as rodents eating the cafeteria diet. And this isn’t limited to lab rats. Raccoons and monkeys quickly grow fat on human food as well.

We see a similar pattern of results in humans. With access to lots of calorie-dense, tasty foods, people reliably overeat and rapidly gain weight. But again, it’s not just the contents. For some reason, eating more fat or sugar by itself isn’t as fattening as the cafeteria diet. Why is “palatable human food” so much worse for your waistline than its fat and sugar alone would suggest?

Mystery 7: Altitude 

People who live at higher altitudes have lower rates of obesity. This is the case in the US, and also seems to be the case in other countries, for example Spain and Tibet. When US Army and Air Force service members are assigned to different geographic areas, they are more at risk of developing obesity in low-altitude areas than in high-altitude ones. Colorado is the highest-altitude US state and also has the lowest incidence of obesity.

If you look at a map of county-level obesity data in the United States, the Rockies, the Sierra Mountains, and the Appalachians stand out quite clearly: 

County-Level Estimates of Obesity among Adults aged 20 and over, 2009. Map from the CDC.

Similarly, there is a condition called “altitude anorexia” where individuals who move to a high-altitude location sometimes lose a lot of weight all at once (see also here, here, and weight loss results here). This effect also seems to apply to lab rats who are moved to labs at higher altitudes.

In addition, there is some evidence for a similar relationship between altitude and the rate of diabetes, with people living at a higher elevation having lower rates of diabetes than those living near sea level, even when statistically adjusting for variables like age, BMI, and physical activity.

We know that oxygen and carbon dioxide vary with elevation, so you might expect that this is attributable to these differences. But the evidence is pretty thin. Combined with a low-calorie diet, exercise in a low-oxygen environment does seem to reduce weight more than exercise in normal atmospheric conditions, but not by much. Submarines have CO2 levels about 10 times higher than usual, but a US Navy study didn’t find evidence of consistent weight gain. The atmosphere itself can’t explain this.

One paper, Hypobaric Hypoxia Causes Body Weight Reduction in Obese Subjects from Lippl et al. (2012), claims to show a reduction in weight at high altitude and suggests that this weight loss is attributable to differences in oxygen levels. However, there are a number of problems with this paper and its conclusions. To begin with, there isn’t a control group, so this isn’t an experiment. Without an appropriate control, it’s hard to infer a causal relationship. What they actually show is that people brought to 2,650 meters lost a small amount of weight and had lower blood oxygen saturation, but this is unsurprising. Obviously if you bring people to 2,650 meters they will have lower blood oxygen, and there’s no evidence linking that to the reported weight loss. They don’t even report a correlation between blood oxygen saturation and weight loss, even though that would be the relevant test given the data they have. Presumably they don’t report it because it’s not significant. In addition there are major issues with multiple comparisons, which make their few significant findings hard to interpret (for more detail, see our full analysis of the paper).

Mystery 8: Diets Don’t Work 

There’s a lot of disagreement about which diet is best for weight loss. People spend a lot of time arguing over how to diet, and about which diet is best. I’m sure people have come to blows over whether you lose more weight on keto or on the Mediterranean diet, but meta-analysis consistently finds that there is little difference between different diets.

Some people do lose weight on diets. Some of them even lose a lot of weight. But the best research finds that diets just don’t work very well in general, and that no one diet seems to be better than any other. For example, a 2013 review of 4 meta-analyses said:

Numerous randomized trials comparing diets differing in macronutrient compositions (eg, low-carbohydrate, low-fat, Mediterranean) have demonstrated differences in weight loss and metabolic risk factors that are small (ie, a mean difference of <1 kg) and inconsistent.

Most diets lead to weight loss of around 5-20 lbs, with minimal differences between them. Now, 20 lbs isn’t nothing, but it’s also not much compared to the overall size of the obesity epidemic. And even if someone does lose 20 lbs, in general they will gain most of it back within a year.


Hello! If you’re just joining us, check out achemicalhunger.com, the table of contents helps make the series easier to navigate!

[Next Time: CURRENT THEORIES ARE INADEQUATE]