Gradient Descending Through Brinespace


I.

Cholera gives you severe diarrhea, which leads to agonizing, life-threatening dehydration.  

Doctors long realized that cholera patients needed electrolytes, but electrolyte solutions didn’t seem to help. In fact, giving patients electrolytes in IV or in an oral solution often made them worse.

After decades of trial and error, they discovered a mixture of water, electrolytes, and sugar that would treat the dehydration from cholera instead of making it worse. This brine came to be known as oral rehydration solution (ORS), and is now the standard treatment for extreme dehydration. 

One thing that might surprise you about this mix is that sugar is an active ingredient. It’s not just for taste — the brine literally doesn’t work without it. As it turns out, for esoteric biology reasons sodium can only be absorbed in the gut when it’s paired with glucose:

Why did [early attempts] at oral rehydration fail? It seems that the scientist[s] didn’t yet know some of the fundamental biology of how glucose and sodium was absorbed in the body. Work in the late 1950s and early 1960s had established that sugar and sodium ions are absorbed together in the gut through a sodium-glucose cotransport protein. In turn, this sodium and glucose pulls water from the gut into the body.

Another surprise is that you need to get the solution just right. You can’t just pick a random point in brinespace. As researcher Robert Allan Phillips discovered, if you choose the wrong ratio of ingredients, you kill your patients instead: 

The trial was a disaster. When Phillips returned to Manila a week later he was told that five of his 30 trial participants had died. It’s not clear exactly what went wrong with Phillips’ experiment, but we do know that the oral solution he put together had far too much glucose and salt. This made the solution extremely hypertonic — it drew water out of the patients’ cells and exacerbated their dehydration.

Functional solutions for cholera exist only in a relatively small range. Go too far outside that range, and the solution hurts your patients instead of helping them. 

We don’t know how narrow that range really is. But we do know you have to get the mix right, or it doesn’t work.

II.

Any combination of electrolytes in solution can be expressed as a point in high-dimensional brinespace.

We begin with a liter of water, the origin along all dimensions. A simple brinespace might define a brine by the concentrations of sodium and potassium per liter, written as [mg Na, mg K]. 

The point [100, 100] would indicate a brine that contains 100 mg each of sodium and potassium per liter of water. Official concoctions of ORS are more complex, but the simplest make-it-at home version of ORS is located at the point [1150, 0].

But that’s not quite right, is it? ORS contains other ingredients than just sodium and water. Most notable is sugar. If we define a new brinespace of [mg Na, mg K, g sugars], then ORS is located at [1150, 0, 25].

Gatorade is another simple brine. With 270 mg sodium, 80 mg potassium, and 34 g of sugar in a 20 oz bottle, it can easily be defined as the brine at [460, 135, 60] (with some rounding). 

One “stick” of the electrolyte mix LMNT contains 1000 mg sodium, 200 mg potassium, and 60 mg magnesium. We’ll have to add magnesium to our brinespace, which we’ll now define as [mg Na, mg K, mg Mg, g sugars]. They recommend you mix this with “anywhere from 16 to 32oz of water”. Given that 32 oz is approximately a liter, this means that LMNT produces brines approximately along the line from [2000, 400, 120, 0] to [1000, 200, 60, 0].

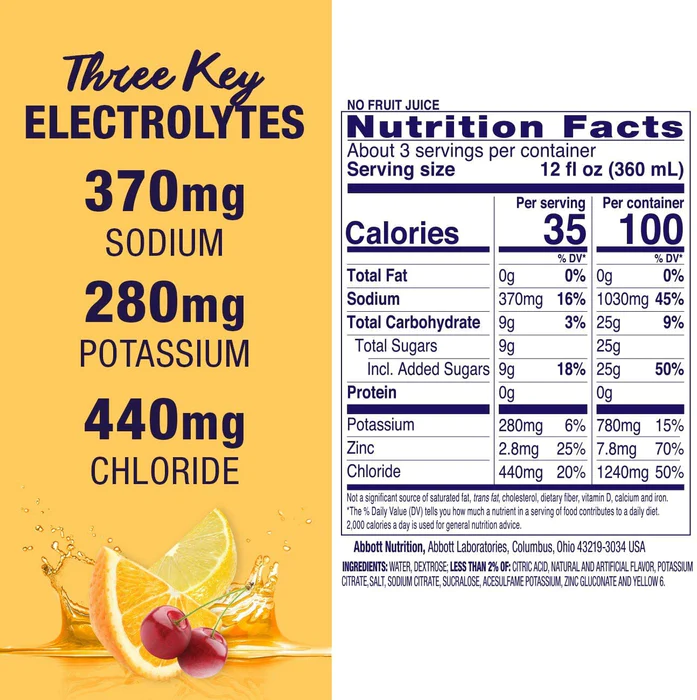
Other electrolyte drinks can be characterized the same way. LiquidIV is located at [1060, 780, 0, 25]. Pedialyte is almost the same (at least in terms of these dimensions), resting near [1030, 780, 0, 25]. Propel (a Gatorade product), has no sugar and can be found at the coordinates [460, 120, 0, 0].

The location of “snake juice” is left as an exercise for the reader.

Even Red Bull is something of a brine. If we define a new brinespace that includes caffeine [mg Na, mg K, mg Mg, g sugars, mg caffeine], then Red Bull is located at approximately [420, 0, 0, 110, 320].  

Red Bull isn’t even that unique for having caffeine. Thirst Quencher 2 (TQ2), the forbidden sequel to Gatorade, itself contains caffeine. While Quaker Oats sued to take ownership of TQ2, and then buried it forever such that it has never seen commercial release, we have what appears to be the patent, which defines TQ2 pretty well. Ignoring the phosphate, glycerol, and pyruvate for the moment, we can use the same brinespace as Red Bull. In terms of this brinespace, TQ2 appears to be at about [600, 80, 0, 40, 150], compared to standard Gatorade at [460, 135, 0, 60, 0].

TQ2 makes it pretty clear that the only sugar it contains is glucose, while in standard Gatorade the sugar is some combination of sucrose (50% glucose and 50% fructose) and dextrose. In case that makes a difference, and assuming for the moment that standard Gatorade contains only sucrose, we might want to define a new brinespace [mg Na, mg K, mg Mg, g glucose, g fructose, mg caffeine], in which case TQ2 is located around [600, 80, 0, 40, 0, 150], with standard Gatorade at [460, 135, 0, 30, 30, 0].

(This makes us wonder if glucose is functionally different than other sugars. ORS recipes specify glucose, which suggests that other sugars might not work. TQ2 claims to be an improvement on Gatorade and also specifies glucose. Does fructose not fill the same functions? Is there no sodium-fructose cotransport protein?)

The astute reader will have noticed that all the ions we’ve been talking about up to this point are cations. What’s up with that? Is there some kind of big prejudice against anions? Of all the mixes we’ve looked at so far, Pedialyte is the only one that lists chloride on its nutrition facts label, though most electrolyte solutions presumably have some chloride, since most use NaCl or KCl. Pedialyte in fact gives a percent daily value of chloride (440 mg is apparently 20% DV). We had no idea chloride even had a recommended daily value. But it is in fact an essential electrolyte — without it, you die. 

Or how about iodine? That’s an essential electrolyte, it’s a anion (as iodide), but it’s never added to electrolyte drinks, never mentioned on nutrition labels. Maybe people don’t want to hear about chloride ions in their Gatorade, because it makes Gatorade sound like it’s chlorinated (which in some sense, it is), but why not iodide? Any electrolyte mix that includes iodized salt will contain both iodide and chloride, and both of them are biologically active.

Anyways, good on the Pedialyte team for being the exception

A brine might contain any number of other ingredients, and these don’t necessarily need to be electrolytes or sugars. 

For example, you could define a brinespace that includes some acids. Ascorbic acid (AKA vitamin C) would be one natural choice — in this case, your brine would cure scurvy. You could also include citric acid. This is certainly found in lemonade, though it’s not clear whether it’s an active ingredient in that context. 

Or how about acetic acid, better known as vinegar? The health benefits are controversial, but there are many cultural drinks that are basically just sugar + acetic acid. The ancient Greeks had oxymel, the Romans had posca. Persians have sekanjabin, England gave us “shrubs“, and New England has switchel. Lots of cultures seemed to settle on this combination independently, and kept with it for hundreds of years. Maybe there’s something to it.

Even Milk is a brine. It contains sodium and potassium, calcium, sugars, even iron. It’s an unusually complex brine, sure, but a brine nonetheless. 

malk

III.

Some brines have health and wellness benefits.

ORS is the clearest example. Brines from the correct region of brinespace provide a fast and effective treatment for the intense dehydration of cholera. Go too far outside of that region of brinespace, and the brines stop working, then start making the patients worse — some brines will even kill them. It doesn’t work if the ratios are off! Finding the correct location in brinespace matters a lot.

While ORS is exceptional, we don’t think it’s unique. For starters, we have anecdotes like this one

The extreme version of “grogginess on waking” is hangovers. If you take Pedialyte for hangovers, you are already brining. The company also believes in this application — they recently released a formulation for just that situation.

Sports drinks are another obvious example. Gatorade makes $7 billion in sales per year. Either Gatorade provides some kind of benefit, or their marketing team deserves a raise.

And there are the direct testimonials. Robb Wolf, the co-founder of LMNT, says

Salt-deprived rats are sad. They loaf around their cages, ignoring the sugar water that usually brings them joy. It’s classic depressed behavior.

I unwittingly ran a similar experiment on myself for the better part of 20 years. I was sweating buckets—unlike pigs, who don’t actually sweat by the way—on the jiu-jitsu mat, but wasn’t consuming enough sodium to replace my losses. I felt low-energy, foggy, and, as I think back, losing passion for my sport. I wasn’t giving my body what it needed, and my mood paid the price. Getting more salt was the remedy.

Compared to other factors, the link between sodium status and mood isn’t well-publicized. I want to change that. I’m not saying salt is a cure for depression, but I do believe it’s worth considering as part of a holistic approach to mood maintenance. Mental health is the fruit of many inputs. And oftentimes many things are out of our control, but getting enough sodium isn’t one of them.

If Robb is right, then some cases of “depression” might just be a chronic lack of electrolytes. This would be simple to test.

Like ORS, Robb also claims that the wrong mix of electrolytes doesn’t work. In our terms, you need to find the correct point, or at least the correct region, in brinespace.

POPULAR PRODUCTS DIDN’T CUT IT. … When I dialed in the formulation I immediately felt my fitness, sleep, and brain functioning on new levels.

Sodium and glucose aren’t the only ingredients where you need to get the mix right. One of our friends, a physician, pointed out that for patients with low potassium (hypoK), if you don’t have enough magnesium (hypoMg), you’ll be hypoK forever unless you fix the hypoMg first, because of “some renal excretion thing I think” (his words). See also this paper, which says: “magnesium replacement is often necessary before hypokalemia and potassium depletion can be satisfactorily corrected with potassium supplements.”

Of course, most regions of any brinespace are going to be unremarkable, or slightly dehydrating. But there are reasons to suspect that some brines, in some situations, are the perfect solution. 

IV.

Here are three candidates for new brines with plausible health benefits:

First, we think there’s evidence that high-potassium brines can cause weight loss.

Ketoade is a term for various concoctions of electrolyte drink, usually high in potassium, that people often drink while on ketogenic diets. People mostly seem to drink this to fight “keto flu”, which may just be the feeling of not having enough electrolytes. But ketoade might also be part of the reason that people lose weight on keto diets. Not from the diet — from the extra potassium. 

When we ran the potassium trial, people took supplemental potassium, usually in water or as part of a concoction. On average, people lost weight, a mean of 0.89 lbs over 29 days (n = 104, p = .014). 

Despite being statistically different from zero, 0.89 lbs obviously isn’t much in practical terms. But people who took more potassium lost more weight on average (r = -0.276, p = .005), which is additional evidence that there’s something here. And three people lost more than 10 lbs, suggesting that there might be specific ways of taking potassium that are especially effective. 

These three participants seem to be more than outliers. For example, here’s one of their reports:

(77174810) First of all – holy shit! It’s amazing how well this worked and it’s also surprising that it’s never really been studied before! Thank you for the analysis and thought that you put into this. For this trial, I basically just ate whatever I felt like, went to a football tailgate party nearly every weekend with lots of beer and foods you would not associate with dieting… and still lost nearly 10 lbs!

I have tried every diet/exercise and variation of CICO, atkins, keto, IF, etc., etc., etc. to try and lose weight. To no one’s surprise, nothing really worked for long and the weight always came back. At the end of 2020 I was over 275. It took me three months of busting my ass to lose 20 pounds and as soon as I started eating “normally” again, I slowly started putting weight back on.

Of interest to our point today, this participant took his potassium in solution. If there is an ideal brine for losing weight, it might look something like this:

(77174810) What I discovered was that mixing [potassium] with Simply Strawberry Lemonade makes it very palatable! I dissolved the KCl and a little sea-salt in about 1 oz of water. Then added about 4-6 oz strawberry lemonade. You could damn near sip it this way! Apple cider was the second best mixer.

But the strongest evidence that high-potassium brines can cause weight loss is certainly Krinn. 

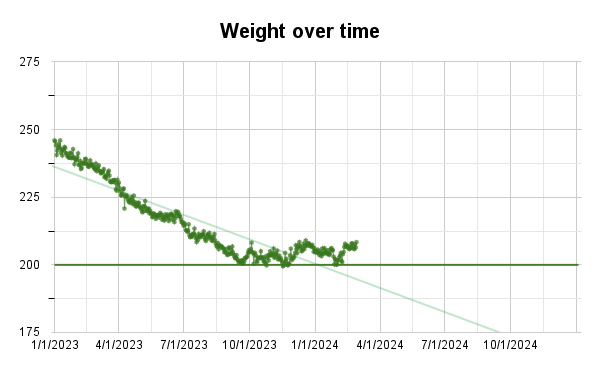
After some success as a participant in the potassium trial (6 lbs lost), Krinn decided to keep going, increasing her potassium intake and searching for a protocol that she could stick to long-term. At the six month mark, she wrote a tumblr post as a report about her progress. You can read her report here and our review of that report here. Here’s how she describes her approach:

I decided to stabilize at about 10,000mg [potassium] per day … because that’s about how much potassium people were getting during the SMTM potato diet community trial. … Aiming for that amount also meant that it would be easier to compare my results to something that worked decently well and to ask questions like ‘is there something special about whole potatoes, or is it mostly the potassium?’ If it’s mostly the potassium, you’d expect my results to be closer to the full-potato-diet results than to the low-dose-potassium results — which is what happened.

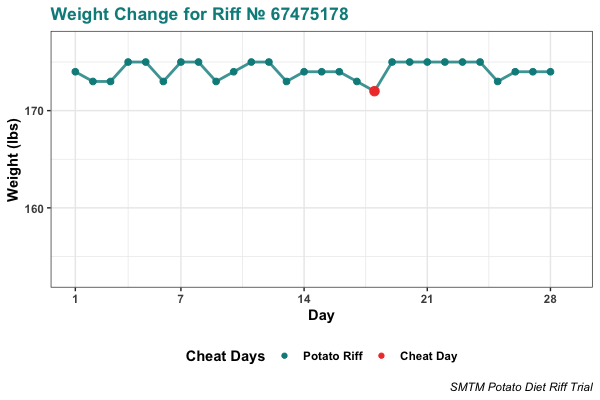
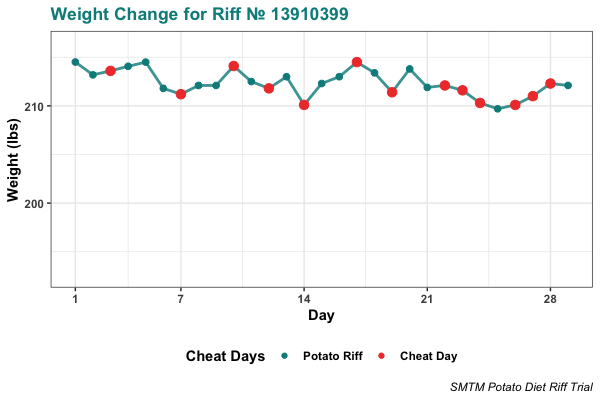
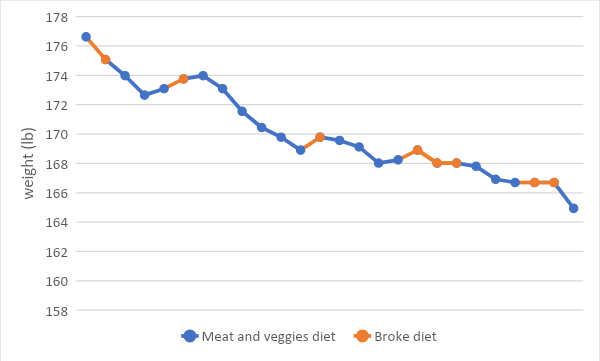
We can also offer a brief update on Krinn’s progress after just over one year (shared with her permission). Take a look at the plot below. As you can see, her weight loss continued until she hit a plateau at just above her target weight, which corresponds to a BMI of 25. She tells us that she’s not sure if this is because the potassium stopped working, or if it’s as a result of external life situation reasons. 

Krinn took her potassium as a brine. Specifically, she mixed potassium chloride with Gatorade. Here are the details:

I used potassium chloride powder (whatever came up first on an Amazon search since all KCl should be alike) mixed with regular Gatorade (i.e. not the sugar-free kind) to make it taste okay (I recommend blue Gatorade, it’s the closest to appealing when kaliated — the yellow lemon-lime was meh and the fruit punch red was awful). I added two heaping teaspoons of KCl powder to a 20oz. bottle of Gatorade and drank that. KCl is about 52% potassium and a heaping teaspoon of it is about 6500mg, so I rounded up a smidge and called that 6600-and-a-bit milligrams of potassium per bottle. On Thursdays and Sundays I have drank 2 full bottles and on other days 1.5 bottles. I recorded this as 10,000mg of potassium on regular days and 13,500mg on Thursdays and Sundays.

Comparing Krinn to the participant we mentioned above, who mixed their potassium chloride with strawberry lemonade, we notice a few things in common. 

Both of their potassium solutions contained sodium — Krinn from the Gatorade, while the other guy added sea salt. Both of them included sugar, from the Gatorade or the strawberry lemonade. Given what we know about ORS, it seems reasonably plausible that sugar might have an important interaction with potassium. And curiously, both included citric acid, since both Gatorade and strawberry lemonade contain some citric acid. 

The biggest difference is the potassium dose — Krinn was getting about 10,000 mg a day from her brine, while the other participant was getting only 3,000 mg/day or so. If there is an ideal weight-loss brine, it probably exists somewhere in the neighborhood of these two approaches. 

(That said, it’s not clear that such high doses of potassium are safe for everyone, and they almost certainly are not safe if you have kidney disease or related diseases like diabetes. Do not try supplementing doses this high without consulting your physician, and absolutely do not try it if you have kidney problems or any conditions that might compromise your kidney function.)

In our review of Krinn’s post, we also noted two things. First, Krinn was getting lots of magnesium on the side, through the rest of her diet. And second, she seems to eat a diet high in stearic acid. These are both ingredients that have attracted some suspicion for possibly being related to obesity, which caught our attention. You could plausibly add magnesium to your brine without any trouble (and some brines like LMNT already include a small amount of magnesium). But stearic acid is a butter-like waxy solid, it would probably not go well in most brines, though it is found in milk. Is dairy a weight-loss brine? Well, ExFatLoss would probably say yes..

Our second brine candidate is that we suspect there might be a brine or brines for IBS. 

ORS was made to treat the dehydration associated with diarrhea, not the diarrhea itself, but even so it was designed to specially calibrate your digestion. “I’ve had IBS-D,” writes u/feelslikehel, “for about 8 years. I’ve been doing the salt and water regimen for about 6 weeks now and it’s not really making me feel less dizzy but I’m finding that my IBS-D is pretty much gone.” If you have IBS with diarrhea, it might be worth mixing up some ORS. If nothing else, it will help keep you hydrated. Also compare: Large increases in sodium intake are recommended for POTS.

Or how about “Hot girls have IBS”? Hot girls tend to have something else in common — we pay a lot of attention to what we put in our bodies. No processed food, nothing that might disrupt the microbiome. Have you been avoiding salt and sugar to help with your digestion? If so, remember that both sodium and glucose are necessary for your body to absorb water from your gut. 

FINALLY

Finally, our third candidate is that there might be a magnesium brine for migraines.

There’s some evidence that oral magnesium supplements can make migraines less intense and less frequent (meta-analysis). This evidence could certainly be more consistent. But as we’ve previously seen, sometimes the right mix can be a big multiplier. Perhaps there is a magnesium brine that would be so much more consistent, or more effective.

But even assuming there does exist some brine that will treat your ailment, or will just help you feel less groggy in the morning, you still need to find it. Or to put it another way, you’d need to discover its location in a high-dimensional brinespace.

IV.

The space of all possible brines is very large. To find other brines with health benefits, we will need to develop new tools.

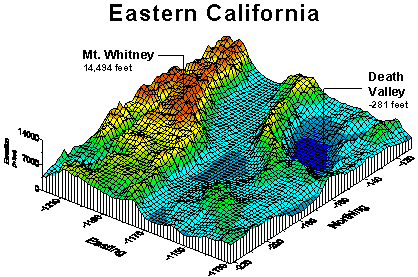
Behold! A 3-dimensional representation of a (hypothetical) high-dimensional brinespace, with height and color indicating “impact on migraines”. The red areas of brinespace are regions of brines that will make your migraines worse; the yellow areas will make no difference; and the blue areas are regions of brines that will make your migraines disappear. 

If everyone’s brinespace is largely the same, then it will take only one courageous migrainenaut to map its murky bottoms. But as we know, people are not much the same. And neither are migraines — if there are two or more kinds of migraines, those brinespaces will have to be mapped separately. Perhaps your neighbor’s biology is very different from yours, or she has the other kind of migraine, and her migraine topography looks like this instead: 

Who knows what these topologies would look like in real life, how deep their local and global minima might go, how much they might differ between people or over time. But that’s the point. We are going into this with a lot of uncertainty, so we should go into this with caution, and with the right tools.

Disregard, this is Eastern California

Software for searching brinespace should be modular.

The first module would be for the brine ontology, the way of defining the brinespace you want to explore. 

Put simply, there are many ways to define a space of possible brines. Some are simple, like the space [mg Na, mg K]. Some are more complicated, like the space [mg Na, mg K, mg Mg, mg Ca, mg Fe, g sugars, mg caffeine]. 

Some brinespaces make distinctions that others do not. For example, the space [mg Na, mg K, g sugars] treats all sugars as alike, or you could say, treats them as indistinguishable. But [mg Na, mg K, g glucose, g fructose] distinguishes between two common sugars and excludes all others. 

Brinespaces can also define their terms in different ways. We’ve been defining these spaces in terms of the mass or volume of the different ingredients (g, mg, L, etc.). But for the scientist mixing brines at home, it might be easier to define these spaces in teaspoons rather than grams, and ingredients like KCl or NaCl instead of the individual elements. This makes it easier to think in terms of making the brine, in terms of operations — how many teaspoons of each ingredient to add to each liter of water.

On the other hand, defining it this way can lead to ambiguous regions of brinespace, and some information may be lost. For example, a brinespace expressed in teaspoons of ingredient salts wouldn’t include the information that adding KCl and NaCl both increase Cl. If chloride ion concentrations are important, this brinespace would obfuscate that information. With that information, it’s clear that you could add baking soda (NaHCO₃) to a brine to add sodium without any additional chloride ions, or add potassium citrate (K₃C₆H₅O₇) to a brine to add potassium without any additional chloride ions.

Finally, any brine ontology should include some kind of safety limits. A brine might reasonably contain 200 mg/L potassium, but 20,000 mg/L potassium would be dangerous. No need to explore those regions. Exactly where to set these limits is up to the architect, but they should set upper limits on all the dimensions, and set them carefully. Options should be included for special populations, like people with heart conditions, who need to avoid high levels of sodium. Lower limits are not needed — if the dimensions are all at zero, you are simply drinking water. Yum. 

Perhaps over time we will find a single large brinespace that is ideal for all purposes. But we might also find that different brinespaces are better for characterizing some searches than others. It’s important that this element be modular, so different brine ontologies can be switched out and tested at ease. 

The second module would be the outcome measure. We imagine searching brinespace for mixes that improve health and wellness, and this is the module where we decide how to measure the elements of health and wellness we want to improve. 

For example, if you were following Krinn’s example and trying to discover a brine that will help you lose weight, you will want a module that measures your weight loss. A simple measure would be “each brine is rated on how much weight you lose over the next day.” But weight loss can be very noisy, so this might be too sensitive. A better measure might be rating each brine on a weighted average of weight change over the next several days.

If you are looking for something else, you want a different measure. For example, if you have “a horrible grogginess when waking up for most of [your] life” like Romeo Stevens did, you might be looking for a waking-up brine, or a sleepytime brine, to make your mornings a little brighter. In this case you might want a simple measure like, “on a scale from 1-10, how good do you feel 10 minutes after drinking your morning brine?” Or you could do some kind of complicated measure where you test your visual acuity, strength, and reaction time. It’s all the same to us.

If you are trying to find a brine to help your migraines, you could take a simple measure like, “on a scale from 1-7, how bad were your migraines this week?” Or you might find a need for a better scale, like a weighted combination of how many migraines you have each day, and how bad each of them was. You might even include some information about specific symptoms or features.

The point is, there will be many different things that people might want to find a brine for — for weight loss, for their migraines, for after a workout, for general clarity and energy. And for each of these targets, there will be many ways to measure success and progress. Some will be simple, some will be complex, some will just be different. You will want your measures to be modular so people can slot them in and out freely, to reach their own goals as they see fit. 

In addition, each module should probably include basic check questions like, “do you like this brine” and “is this brine at all palatable”, as another safety feature. If you find yourself exploring a point in brinespace that you find truly noxious, you should probably just toss that mix and rate it as a failure on all measures.

On the one hand, this approach would exclude potential brines that are disgusting, yet secretly good for you. On the other hand, we doubt that many such brines exist. If a brine is gross, it’s probably bad for you. Your body is in fact designed to deal with these things. And in reverse, if a brine mixture tastes great, that’s an early sign that it might be good for you.

(As a note, you should probably mix your brine with some kind of flavoring. If you drink your brine with water alone, you might accidentally condition yourself to expect that water is dehydrating, something we discovered in the course of our self-experiments.)

Finally, the third module is for the search algorithm and its settings. This is the procedure the software will use for searching the brine ontology or brinespace (the first module you set), and looking for brines that are effective in terms of increasing or decreasing the outcome measure (the second module you set).  

Despite the title of this post, the best kind of search algorithm for brinespace is probably simulated annealing. However, we would love to hear elaboration or correction from anyone with more experience in this area.

We shouldn’t assume that the topology of the brinespace will be static for any outcome. In plain language, we might be aiming at a moving target. The best brine today won’t always be the best brine tomorrow. You will be eating other things, exposed to the environment, and also aging. So the search algorithm should always include some amount of exploration, no matter how well it’s doing. It shouldn’t rest on its laurels. 

Assuming you define your outcome clearly enough, you choose the right kind of search algorithm, and you give the algorithm enough time, it should eventually find you the best possible brine for your outcome (as measured) within the brinespace you defined. 

That’s quite a few assumptions, and assumptions that are easy to get wrong on the first try, or first few tries. If you have spent a lot of time searching with no success, you might want to try different brine ontology modules or different outcome measures, in various combinations. If the software is especially clever, it might be able to help you with this. 

But a long search with no success might also mean that there’s no brine that will help with your problem. This is possible and in fact likely in many cases. There is no brine that can cure a broken heart — in fact, high levels of sodium are dangerous for those with heart conditions. But for some problems, the ideal brine or brines may yet be out there.

Special thanks to Krinn and Potassium Participant 77174810 for their pioneering work in the exploration of brinespace.

Philosophical Transactions: Adam Mastroianni says “please squirt lemon juice on my brain”

Previous Philosophical Transactions:


Hi SMTM,

I’ve now had the pleasure of watching many people encounter A Chemical Hunger for the first time. Some of them get wide-eyed with wonder, and some of them make the same expression that babies make when they taste lemon juice.

Those with the lemony reactions are always certain they know why the obesity epidemic happened. Often, their explanation is something like this:

We have an obesity epidemic because food became more enticing and so people eat more of it. It’s tastier, more available, more varied, more indulgent, etc. We live in a world where you can get hot salty french fries anytime, anywhere, and that’s why we’re fatter than our forefathers.

Let’s call this the McDonald’s Hypothesis. I understand the appeal of this theory because I believed it myself. It conjures up images of, say, spindly 1930s Dust Bowl migrants sipping thin stew to stave off starvation, juxtaposed with portly 2020s Americans horking down chicken McNuggets. When you put it like that, the obesity epidemic seems to make perfect sense.

But that’s not actually the comparison that needs explaining. The obesity epidemic isn’t something that happened, it’s happening. It started pretty suddenly in the 1980s, and it hasn’t stopped since. As you point out, not only did obesity increase from 2000 to 2008, but it increased faster between 2010 and 2018. For the McDonald’s hypothesis to be true, people would have to start horking down chicken McNuggets starting in 1980, they’d have to hork more nuggets every single year since then, and their nugget-horking rate would have to be increasing in recent years.

Now my intuitions are all screwed up, because that doesn’t seem true at all. Extremely tasty food was already omnipresent when I was a kid, and it doesn’t seem to have gotten tastier or more omnipresent since then. I especially don’t get the sense that food was tastier in 2018 than it was in 2015. There was already a McDonald’s in the next town over, and it’s not like they’ve opened five more since then. In fact, McDonald’s predates the obesity epidemic by decades, and the number of franchises in the US has declined slightly in recent years.

Or think of it this way: is the food in the supermarket more enticing now than it was five, ten, twenty years ago? If anything, it seems easier to get “healthy” stuff, as well as local and organic food, as this article confirms. (It also mentions a new trend of smaller grocery stores that provide less variety.) But the McDonald’s hypothesis would predict the opposite––more and more foods so enticing that I can’t help but gulp them down.

Here’s one notable example where food has gotten demonstrably less tasty. McDonald’s used to make their fries in beef tallow, which was apparently delicious. Then a rich guy named Phil Sokolof had a heart attack, blamed McDonald’s fries, and launched a $15 million campaign against them. McDonald’s caved and replaced the beef tallow with vegetable oil in 1990, and then switched the oil again in 2007 to eliminate trans fats. Malcolm Gladwell famously pines for the original fries: 

When I was a teenager and I went to McDonald’s all the time, I went there because of the fries. And then at a certain point, the fries didn’t taste the same. They sucked. I go back there now and they’re not the fries I grew up on.

[…]

What I do in the show is I go to the leading food research and development house in the country—place called Mattson—and I had them … do a taste test. And they made french fries just like McDonald’s would. The old-fashioned way using beef tallow, and then they made a precise replica of the modern fries, and we did a blind taste test. It’s no contest. I mean, it’s like you’re eating two completely different foodstuffs. It’s phenomenal. It blows my mind that McDonald’s would do this. So they know it better than anyone what they had to give up when they shifted from beef tallow. They were throwing away the franchise. And they must have done taste tests. And they must have said, “Oh my God, we’re taking something that’s an A+ and we’re taking it down to a B-, and even though our brand and our livelihood depends on this food item, we’re going to throw it away.”

This isn’t conclusive or anything. The point is that the McDonald’s Hypothesis seems obvious at first, and then it seems way less obvious as soon as I have to compare it to the actual facts that need explaining.

The natural fallback position from the McDonald’s Hypothesis is the Something in Food Hypothesis. In this theory, it’s not that food is tastier, or more abundant, or varied, or anything like that. It’s that there’s Something in Food now that wasn’t there before, something that’s making us fatter. McDonald’s french fry oil now tastes worse, but maybe it screws with your weight through some other mechanism. Anyone who retreats from the McDonald’s Hypothesis to the Something in Food Hypothesis should notice that they’re now in the neighborhood of the theories in A Chemical Hunger that seemed so ridiculous mere moments ago.

Another common backup theory is the Couch Potato Hypothesis: people are getting fatter because they move around less. But again, why did they suddenly start doing that in 1980, and move around less every single year since then? Why was that the year of The Great Sitting Down? Why didn’t it happen in 1953 when the majority of Americans got a TV, or in 1960 when the majority of Americans got a car, or in 2000 when the majority of Americans got a computer and started using the internet, or in 2013 when the majority of Americans got smartphones? Why is it happening faster in recent years? I guess TikTok and Netflix could be improving their algorithms every year and getting you to sit still for longer, but is that really a bigger deal than getting a car or a computer in the first place? And remember, this is adult obesity we’re talking about. Did 45-year-olds move around less this year than they did last year? With even 30 seconds of reflection, the Couch Potato Hypothesis starts to seem a little ***half baked***.

A situation like this is a good test of your epistemic immune system. If you’ve never really thought about the causes of the obesity epidemic and your immediate reaction to a new explanation is “NO WAY, IMPOSSIBLE, REJECT, I ALREADY KNOW THIS ONE,” your mental t-cells are probably too active. That doesn’t mean the new explanation is right, just that it’s a little silly to scrunch up your face at it.

The solution isn’t to be more gullible. The world is full of crazy people saying crazy things; we’re right to be skeptical. In fact, the solution is to be more skeptical, and to direct a healthy dose of that skepticism toward your own thoughts, because that’s the only way to realize when your certainty-to-evidence ratio is out of whack.

Most of my beliefs are unconsidered and unsupported. I’m not ashamed of that––who’s got the time to consider and support every single thing they think? I scrutinize the few things I care about and make my best guess on the rest. Every time I see someone react to a new hypothesis like they’ve just tasted lemon juice, it’s a helpful reminder that I need to file my guesses under “Guesses” and not under “EXTREMELY CERTAIN AND WELL-KNOWN THINGS THAT I KNOW.”

~*~*~*little is known, but much is believed*~*~*~

Sincerely,
Adam

Lady Tasting Brine

A few weeks ago we spent some time sitting around tasting different alkali metal salts with Adam Mastroianni

To us, the difference between NaCl (sodium chloride, also known as normal table salt) and KCl (potassium chloride) seems very obvious, but Adam said they taste about the same to him.

Since this can be tested empirically, we ran some quick studies to learn more. Inspired by the design of R. A. Fisher’s lady tasting tea experiment, we decided to test batches of 8 samples at a time in randomized, single-blind designs. 

TFW

Study 1

For the first study, eight cups were prepared, labeled A through H. We tested four samples of ¼ tsp dry NaCl and four samples of ¼ tsp dry KCl, randomly assigned to the eight cups. Testers were always blind to what salt was in what cup, but the experimenter was not blind.

Adam started by tasting the eight cups in order, and guessing which salt was in each cup. After tasting, he guessed that his accuracy was between 4/8 and 8/8. 

In fact, Adam’s accuracy was 6/8 — he incorrectly identified Cup D as KCl when it was actually NaCl, and he incorrectly identified Cup H as NaCl when it was actually KCl. Otherwise he correctly identified which salt was in which cup (Table 1).

Following this, the eight cups were emptied, cleaned, and re-stocked with four of each NaCl and KCl again, in a new random order.

Then, one of the SMTM authors (Raccoon #3) tasted the eight cups in order, guessing which salt was in each cup. After tasting, the author estimated their accuracy was either 7/8 or 8/8. 

In fact, Raccoon #3 got 8/8 correct, always identifying KCl as KCl and NaCl as NaCl (Table 2). If Fisher were there, he would have rejected the null hypothesis. 

Study 2

The second study was a replication of the first, except that the ¼ tsps of salt were each dissolved in one cup of lukewarm water, yielding 8 cups of two different salt solutions, four of each, in a random order, single-blind.

Again, Adam went first. Adam started by tasting the eight cups in order and guessing which salt was in each cup. After tasting, he estimated that his accuracy was between 4/8 and 7/8. 

In fact, Adam’s accuracy was once again 6/8 — he incorrectly identified Cup C as NaCl when it was actually KCl, and he incorrectly identified Cup F as KCl when it was actually NaCl. Otherwise he correctly identified which salt solution was in which cup (Table 3).

At this point one of our friends, who we will identify as RG, arrived at the apartment and also wanted to try the solutions. Since she was not present while Adam was tasting, we figured she could try his brines.

RG tasted the eight cups in order, guessing which salt was in each cup, and at the end estimated that her accuracy was 3 or 4 out of 8. In reality, her accuracy was 5/8. Like Adam, she misidentified Cups C and F, and she also misidentified Cup A as NaCl instead of KCl (Table 3).

Following this, the eight cups were emptied, cleaned, and re-stocked with NaCl and KCl solution, again four of each in a new random order.

Raccoon #3 tasted the eight cups in order. They guessed that the first three cups were NaCl, but when they reached the fourth cup, they commented that they must have been wrong, that Cup D was NaCl and the first three had to have been KCl. Based on this inference, at the end this author guessed an accuracy of 5/8. 

This one is hard to score. On the one hand, as written their accuracy was indeed 5/8. However, they realized their mistake on the first three cups as soon as they reached Cup D but before being unblinded, so you could also rate their accuracy as 8/8. See Table 4 for details.

First Potato Riffs Report

Eating a diet of nothing but potatoes (or almost nothing but potatoes) causes quick, effortless weight loss for many people. It’s not a matter of white-knuckling through a boring diet — people eat as much (potato) as they want, and at the end of a month of spuds they say things like, “I was quite surprised that I didn’t get tired of potatoes. I still love them, maybe even more so than usual?!” And some people lose a similar amount even when eating only 50% potato.

Why the hell does this happen? Well, there are many theories. To help get a sense of which theories are plausible, try to find some boundary conditions, or just more randomly explore the diet-space, we decided to run a Potato Diet Riff Trial. In this study, people volunteer to try different variations on the potato diet for at least one month and let us know how it goes. For example, they might eat nothing but potatoes and always cook their potatoes in olive oil. Or they might eat nothing but potatoes and leafy greens. Or they might eat nothing but potatoes and always eat their potatoes with ketchup. 

The hope is that this will help us figure out if there are other factors that slow, stop, or perhaps accelerate the rate of weight loss we saw on the full potato diet. This will get us closer to figuring out why potatoes cause weight loss in the first place, and might get us closer to curing obesity. We might also discover a new version of the diet that is easier to stick to or causes even more weight loss, or both. 

In the two months since launching the riff trial we’ve heard back from ten riffs. More people have their riffs underway or are planning to start soon, so there are more riff trial results in your future. But let’s see what we’ve learned so far. 

First we’ll review the overall results, and talk about our interpretation. Then, at the end we’ve included the actual riff proposals and reports from all ten participants, if you want to read about them in more detail.

Unless otherwise indicated, weight loss numbers are over a period of about 28 days, comparable to the original Potato Diet Community Trial. 

Potatoes + Dairy

The most common riff to date has been one version or another of Potatoes + Dairy, five out of the ten reports so far. Let’s take a look!

72682326 ate Potatoes + Dairy Fat (butter, heavy cream, sour cream), plus a little chocolate, and lost 11.8 lbs. “This is a new low weight for me,” she adds, “I’d say going back 15 years.”

(All these plots have a span of 24 lbs on the y-axis so they can be compared directly.)

05035476 ate Potatoes + Dairy and lost 12.9 lbs. 

69159819 ate Potatoes + Dairy, mostly as mashed potatoes (prepared as “5 pounds of potatoes with 1-2 sticks of butter, plenty of milk and cream mixed in, and cheese on top”) or potatoes roasted in butter, and had coffee with lots of cream. He lost 9.7 lbs, and described the experience as “truly decadent”. This report is interesting because this participant had the lowest starting BMI (just 26.6) of all the reports so far, and because previous attempts at the full-potato diet didn’t work for him. 

38440610 ate Potatoes + Cheese. “My reasoning is that I thought it would be very funny if cheesy potato would work,” he explained in the signup form, “so I wanted to try.” He ate a wide variety of cheeses (feta, cheddar, parmesan, emmental, maasdamer, etc.) and lost 5.2 lbs. 

67475178 ate Potatoes + Dairy + Milk Chocolate, and lost no weight. Despite this, she reports being amazed that the scale didn’t move, given how much potatoes, butter, cheese, and chocolate she was eating. “I have lost an inch of my waist (maybe less bloated?),” she says, “despite eating copious amounts of milk chocolate daily.”

Obviously this is a small sample size, but so far it looks like Potatoes + Dairy works about as well as the original potato diet, where people lost an average of 10.6 lbs over a similar span of time. So tell your friends, “I need to eat more gratin de pommes à la dauphinoise, I’m trying to lose weight!”

Given this, it’s pretty ironic that our one strict rule in the original potato diet was “no dairy”. Oops!

Sustained Weight Loss

78175908 ate Potatoes + Ketchup + Protein Powder (“derived from milk”) and lost 9 kg (about 19.8 lbs) in the process. He does mention that he doesn’t like potatoes, but says that satiety and energy levels were good overall. 

87411834 ate Potatoes + Lentils in a “stew/soup” with butter, along with a few other minor interventions, like “two Gatorade Zeros each with an additional 1 teaspoon of Potassium Chloride per day” as inspired by Krinn. He lost 17.2 lbs over 29 days.

(PSA: Be careful adding more potassium when doing a potato diet because you are already getting a ton of potassium from the potatoes. At some point you will be getting too much, which is dangerous. How much is too much? It’s hard to tell! Again, be careful.)

In addition, here are two plots he provided of the same data: 

40711007 did a riff that can only be quoted: “Potato + Carrot (for vitamin A) + Fish (for B12 & protein) + Marmite (for B12) + salt (I hear it can be lacking if you just eat potato) + olive oil (…honestly it’s the fat source that I had lying around when I decided to commit to the bit) + various seasonings (it’s how I make soup taste of things) + Apples (I’m only about 90% that I’d be getting enough C from potatoes) + sugar-free fizzy drinks.” Despite this list of modifications, he lost 8.5 lbs, “and that was with four explicit cheat days, as well as at least two days with an unwise amount of deep frying even by the measure of ‘amounts of deep frying’.”

None of these riffs seemed to stop the potato effect. In fact, the first two might have accelerated it. Both of them outperformed the average weight loss in the original Potato Diet Community Trial (though they didn’t outperform the extremes; the greatest amount lost in the original study was 24.0 lbs). 

It’s irresponsible to speculate too much from just two examples, but both of them do include more protein. It’s possible that more protein improves the potato diet. It’s also possible that this is just noise. 

Flopped

13910399 ate Potatoes + Toast with Margarine, the toast being for breakfast and an afternoon snack. He lost only 2.4 lbs. It may be that this riff doesn’t work, but there are complicating factors — he had a cold at one point during the study, took a lot of cheat days, and all the potatoes he had were boiled. 

27482609 ate Potatoes + Beef, mostly grass-fed, and using butter as cooking oil. He lost only 2.0 lbs. 

Both of these participants lost weight, but neither of them lost very much. Again, we should be careful about speculating from just two examples, but this definitely makes us curious whether toast, margarine, or beef blocks the potato effect in general.

If you are interested in trying a potato riff (instructions to sign up are below), we’d be very interested to see riffs of Potato + Bread/Toast, Potato + Margarine, or Potato + Beef. 

Even better would be for someone to try 100% potato for 2-4 weeks, to confirm that they lose weight on the normal potato diet. Then they would add toast, margarine, or beef for another 2-4 weeks and see if they stop losing weight. If they do, they can do another 2-4 weeks of just potato and see if they start losing weight again. This could provide strong evidence that the added food somehow stops the potato diet from causing weight loss as normal. 

Interpretation

We’re interested in potatoes because we want to try to figure out the cause and cure for obesity. But you may be reading this because you’re looking for a way to lose weight. In a practical sense, if you’re trying to lose weight, you might want to start by trying Potatoes + Dairy. It seems to work about as well as the normal potato diet, and it’s probably easier to stick to. If it doesn’t work for you, you can always switch to original potato diet. 

Some people think the potato diet causes weight loss because it is a mono diet, a diet where you eat mostly or entirely one food. We already found this interpretation unlikely, and the riff trials provide even more data against it. Potatoes + Cheese isn’t a mono diet. Neither are Potatoes + Dairy, Potatoes + Lentils, Potatoes + Ketchup + Protein Powder, or Potatoes + Carrots + Fish + … + Sugar-Free Fizzy Drinks. Yet all of these diets caused weight loss, for at least one person who has tried them. If you still think another mono diet would work just as well, then please do a riff of your own and send us the results.

Some people think the potato diet causes weight loss because it is boring. This is often linked to Stephan Guyenet’s perspective that very palatable (read: delicious) foods lead to overeating and weight gain. From this perspective, the potato causes weight loss because it is high-satiety and low-palatability, i.e. filling yet bland. If this were true, adding delicious foods like butter and cheese to potatoes should stop or at least slow their weight-loss powers. Right? Fuckin’ wrong! 

Participant 72682326 ate potatoes, various dairy fats, and sometimes chocolate. She described the experience as “I feel like I’m stuffing myself with delicious carby potatoes”, and lost 11.8 lbs over 28 days. Participant 69159819 ate potatoes and dairy, lost 9.7 lbs, and described the experience as “truly decadent”. Participant 78175908 specifically added ketchup “for enhanced palatability” and still lost 19.8 lbs. Read the rest of the reports below to see similar details. Any kind of blandness/deliciousness/palatability hypothesis predicts the opposite: adding tasty foods to the potato diet should make it much less effective, and anyone who is having a decadent time shouldn’t lose weight. Busted.

Given this evidence, we find it hard to take the mono diet or palatability explanations very seriously. If there’s anyone out there who still defends either of these interpretations, we’d love to hear what you’re thinking.

Sign Up Now

Signups for the potato riff trial are still open! And they will probably stay open all year. If you want to help out, or just try it for yourself, you can read the original blog post here and sign up at the bottom. Feel free to replicate one of the riffs described above, try an extension, or invent your own riff. It’s up to you.

We’ll be back in a couple months when we have a new batch of riff trials big enough to report. For now, chill out and enjoy the full riff reports below.‎ ‎:) 


72682326 – Potato + Dairy Fat

Riff

Potato + dairy fat 

Report

Hi there – 

I almost can’t believe that 4 weeks have gone by already but here we are. I started at 216 and today I’m at 204.2… I had 6 substantial deviation days, 2 of which were in the past week (family funerals are rough on diet experiments!)

Before I comment on the last for week, I’ll offer a little history about me. I’ve been obese pretty much my whole adult life. I’m 48F, 5’5”, hourglass-ish (ie low-ish WHR), and with one exception when I was in my early 30s, never was able to get my weight reliably below 250. By early 2022, I was up to 270 and had been in that vicinity for at least a couple of years. Before the pandemic I had gotten down just below 250 but the pandemic showed up and I gained back everything I’d lost and maybe a little more. On Feb 22, 2022 (2/22/22, I’m a fan of palindromes) I decided to get serious and lose weight, no matter what. Over the course of 2022, I lost about 50 pounds using what I refer to as my change-up diet(when I get bored, I change it up, so I cycled through CICO, low fat, high fiber, keto, vegetarian, a very brief carni stint, etc etc.) Early in 2023, I came across r/SaturatedFat and r/StopEatingSeedOils on reddit and then was kind of off to the races on that whole thing.  I was having a hard time losing (and even maintaining) at that point and had some luck maintaining the weight loss on TCD. But I wanted to lose more. It was in April/May 2023 that I came across Exfatloss’s stuff and his ex150 experiment so I did that in May/June 2023, starting at 220 and ending at 206. I then had a ton of work travel and various other life events (aka summer in Wisconsin) that made it difficult to keep losing. I stayed under 210 for the most part until some work and personal stress in September/October when things started trending up again, leading to a bit of a freak out and my plan to do a potato spin off (saw someone comment somewhere on Reddit that potatoes + fat was working for them, so I figured what the heck, because I love potatoes and it’s one of the foods I’ve missed the most while doing a fair amount of low carb eating.) About a week in I told Exfatloss what I was up to and he told me about your potato riff and that’s when I messaged you. 

Sorry that was a lot but I just wanted to kind of lay that all out. Here are my thoughts on the last 4 weeks. 

My starting weight. The scale said 216, yes, but average wise my weight going in to this was more like 214, and it was a recent 214 from a previously lower average weight of 210ish. But I was definitely in a gaining trend that I wanted desperately to reverse. 

My ending weight. This is a new low weight for me, I’d say going back 15 years. Back then the low weight that I hit was a brief victory, I got there via keto and I probably stayed that weight for a couple of weeks, if that, then lost the keto battle and put the weight back on and then some. 

The food I ate: basically, I’d have coffee with heavy cream for breakfast and then potatoes and dairy fat (butter, heavy cream, sour cream) for lunch and dinner. I’d usually target eating about 200-250g of potatoes per meal depending on how hungry I was. I’d add enough fat to make it taste good. I’d also be liberal with salt and other seasonings. I would eat slowly so that if I started to feel full, I’d stop before I felt sick (I had a day where I was in a rush and ate too fast/too much and felt terrible the rest of the day.) If I felt like I needed something sweet, I’d have a square of dark chocolate or a Lindt 70% cacao truffle.  

The weight I lost. As I mentioned above, I previously got down to 206 on ex150 back in May/June. My weight loss efforts always take a couple of times to stick so I’m super excited about this weight loss, it makes me think that I can keep losing. I loved the food on ex150 but that way of eating was pretty difficult to incorporate into my life. I’d say that I love this way of eating about as much and it’s easier to make work for me. Easier to make work -> easier to stick with it. 

Speaking of keto. I mentioned it in my notes on the spreadsheet but there were days that I was in ketosis (my wife has a finely tuned nose for keto breath, for better and for worse.) I was really surprised by this. I know I’m not in major keto because I haven’t dropped all the water weight like I did on ex150. I feel like I’m stuffing myself with delicious carby potatoes, so how is that happening? I have a couple of thoughts on that. 

1) the lion’s share of the potatoes I’m eating are yellow or red potatoes that have been cooked/cooled/reheated, so are the carbs lower than I think because of resistant starch, and/or does resistant starch have some magical quality that we haven’t quite sussed out yet

2) is the high quantity of saturated fat and/or low quantity of protein making it easier to get in to ketosis. 

3) something else I’m not thinking of 

Couple of last thoughts: I’m so excited about these results and my plan is to continue to eat like this for the foreseeable future (holidays might be tricky, crossing that bridge when I get there, one meal at a time). A goal I had for this year was to get to onederland, but it was not happening and I decided not to make myself crazy over the holidays by trying to lose weight. I was just going to ride it out in that average 210-215 weight zone and then attack it again in 2024. Now I’m feeling like I could maybe get to that point yet this year. I’m elated at this prospect. 

That was a lot, hopefully not TMI. Is there anything else you’d like to know?

Thanks for doing this! I’m looking forward to seeing other people’s riffs.

05035476 – Potatoes + Dairy

Riff

potato plus dairy b/c i like those things and I read the ice cream hypothesis…would be very interesting if the combo helped wait loss b/c of all the negative pub on dairy in diets

Report

Hi There!

Finished my potato diet! Very happy with the results, some cheat days at the end that kept my weight a little bit up.  Think I have Stockholm Syndrome now and am keeping up with the taters. Best diet ever.

Hope my data can help.  Kept to potatoes plus dairy, didn’t go hard on the dairy, just supplemented my potato intake.  Tried to keep it low in BCAA, but some seed oil hash browns and fries included in there.

Mood and digestion was all great during the diet.  Only cranky one was my wife having to cook for herself ‎:)

69159819 – Potatoes + Dairy

Riff

My intent is to try potatoes + dairy. This riff is particularly interesting for a few reasons. From a lifestyle perspective, this seems like a relatively accessible way to do the potato diet. I love mashed potatoes (the most delicious way to eat potatoes), most of the toppings I put on baked potatoes are dairy foods, and I don’t see any reason I couldn’t roast potatoes with butter instead of oil. Additionally, the last time I tried the potato diet (as an unregistered personal experiment), I think the olive oil I relied on to roast my potatoes upset my stomach, so I’m interested if this approach eliminates that issue.

Potatoes + dairy is also interesting to me from an ancestral health perspective. My family comes almost exclusively from the British Isles, and I recently read a book (“Highland Folk Ways”) that provided a detailed description of the diet the Highland side of my family would have followed. The historic Highland diet was ridiculously high in both dairy and potatoes! If anyone is able to thrive on just potatoes and dairy, it should be me. If I don’t lose weight/feel good (especially if a future riff without dairy does work for me), that would be particularly valuable information for my personal health.

Beyond those more personal factors, dairy seems pretty controversial in health/fitness/nutrition circles, which makes it interesting. More than I decade ago, when I was first learning about nutrition, I remember reading the strength coach Mark Rippetoe talk about putting scrawny high school boys on the Gallon of Milk a Day (GOMAD) diet, and he proposed that milk was uniquely anabolic. (I seem to recall that the proposed mechanism was Insulin-Like Growth Factor (IGF-1), but further details elude me now.) When you’re trying to put muscles on a high school kid, anabolism is good, but not so much if you’re trying to lose weight. At the same time, dairy is a staple of plenty of non-obese cultures (most of Northern Europe, for example, which is where I am genetically from). Anyway, I’ve noticed that I’m confused about dairy, and that makes it exciting.

I intend to start the day after American Thanksgiving (November 24). Thanksgiving is a big potato holiday in my family, so I’ll have plenty of leftovers to get started with. I will continue up to December 24, the next major date that has food traditions associated with it. I intend to use a mixture of russet, gold, and red potatoes. My major foods will be mashed potatoes (made with lots of milk and butter), potatoes roasted in butter, and baked potatoes with dairy toppings (butter, sour cream, cheese, etc.). I will not restrict incidental dairy in my coffee (I often put a small amount of cream or milk, or have the occasional latte), but I do not intend to eat tons of supplementary dairy (e.g., no ExFatLoss-style whipped cream desserts).

Report

I just took my 4 week weight measurement for the potatoes + dairy riff.

Overall results were surprisingly good – almost 10 pounds of weight loss despite eating massive amounts of both potatoes and dairy. Even assuming that some of the initial weight loss was water, it was impressive. I’ve included some implementation details below to add some context, or in case others want to try to replicate the riff.

Mashed potatoes were the MVP meal – 5 pounds of potatoes with 1-2 sticks of butter, plenty of milk and cream mixed in, and cheese on top, generally lasting 4-5 meals. It was truly decadent. I suspect that I ate that for something like 35-40 total meals, with potatoes roasted in butter making up another 10-15 meals. I generally did coffee with lots of cream (2-4 mugs/day) for breakfast, then had potatoes for lunch and dinner at normal times (roughly 12 and 6, but I made no effort to manipulate the times I ate, I just ate when I was hungry). Rarely (something like 5 meals, each indicated on the sheet) I would eat french fries from a restaurant, mostly for social reasons.

Compared to my previous personal experiment with the potato diet, the dairy makes this so much more accessible for me. First of all, it means fewer overall potatoes, since I was getting quite a bit of satisfaction from the hefty amounts of dairy. While I’m very excited to eat non-potato food (my wife commented last night that I have begun to stare longingly at other people’s food), I’m actually not tired of potatoes. (I actually ate leftover potatoes for lunch, despite technically ending my diet yesterday.) Second, having the dairy also pushed me to prepare almost all of my potatoes from an unprocessed state, rather than trying to justify frozen potatoes, potato chips, and various forms of fried potatoes.

The original potato diet did not seem to work for me. Besides the presence of dairy, the other major confounding factor is the preparation method – in my previous attempt, I mostly ate roasted potatoes (probably 50% peeled, 50% unpeeled, roasted with olive oil). In the dairy riff, a majority of my meals were mashed potatoes, which started with peeling and boiling. During this iteration, I noticed that when I ate roasted potatoes, my weight plateaued or went up the next day (I actually started recording that in my notes part way through). I assumed that was just water retention (maybe I just salt roasted potatoes more heavily?), but it was a very consistent pattern. I’ll also note that this argues against the “boiling potatoes removes the potassium, so boiled potatoes won’t work as well” theory from the original riff intro post!

Let me know if you have any other questions, and thanks for organizing this whole thing! I’m excited to see the results of other riffs.

38440610 – Potatoes + Cheese

Riff

My riff is potatoes and cheese. My reasoning is that I thought it would be very funny if cheesy potato would work, so I wanted to try. My plan is to do the 4 weeks, I have no idea how I will feel afterwards so it’s hard for me to say if I will continue. I know from the past two years, in which I recorded my weight to track weight-loss, that I have a much harder time loosing weight in spring time (or even just holding my weight). If this works now, I will repeat it in the spring to see if it still works then. 

Side note: I just did a quick google search if it’s common to gain weight in spring and a quick search suggest the polar opposite. Might just be because I am lazy and not very social, while others are especially active during spring.

Anyhow there is one caveat for me in this: My goal is to loose weight so if this riff turns out horribly (I feel like a good cut-off point is if I gain 10 lbs total at any point relative to my starting weight) my plan is to abort this riff and transition to the traditional potato (pure-tato?) diet. I plan to document everything so hopefully it will still be useful fore someone. If the pure-tato diet also does not work for me, at least I will have suffered for science T^T

Report

thanks for organizing this riff trial. It was a great experience and a lot of fun.

I think generally potatoes + cheese works. I wasn’t very strict to begin with and when I cheated it reset my progress quite a bit.

After week two I started to get fed up with potatoes and also was pretty stressed in general. I think for me the resulting mental state was the biggest hurdle.

Even though I tended to get satiated more easily on the potato + cheese diet in general, in that time I ate more than ever and still felt hungry.

I’m stopping for now because it will be a pain during the holidays and I’m also planning to move flats in January which would make it increasingly difficult to adhere to the diet.

But I like the idea of continuing N=1 experiments after things settled down a bit.

Yours,
participant 38440610

67475178 – Potatoes + Dairy + Milk Chocolate

Riff

Potatoes + dairy + milk chocolate for at least four weeks. I have chosen dairy as I would enjoy the potatoes more with butter and cheese and I’m curious as to the weight loss effects if any. Chocolate because I’m curious about that as well. 

Report

Hi I have completed the four weeks off my riff! I have lost no weight, but I have lost an inch of my waist ( maybe less bloated?). Despite eating copious amounts of milk chocolate daily. My blood pressure has also gone down a bit from 138/95 to 137/87 I’m not sure if that’s of any significance. 

I was amazed I didn’t put any weight on! I ate a variation of potatoes for every meal with either butter and cheese or both. Followed by some milk chocolate or a yogurt mixed with cream. Usually the potatoes were microwaved in the skin. 

78175908 – Potatoes + Ketchup + Protein Powder

Riff 

+Ketchup +100g protein per day (150g powder, made from milk)

Personal Experience with the Potato Diet Riff (November 1st to 28th)

Introduction

  • Diet Overview: Engaged in a modified version of the Potato Diet from November 1st to 28th, adding ketchup and protein powder.
  • Purpose: To explore the effectiveness and adaptability of the Potato Diet while maintaining muscle mass and energy levels.

Riff Details

  • Ketchup Addition: Included ketchup for enhanced palatability.
  • Protein Supplementation: Consumed 150 grams of protein powder daily, providing an additional 100 grams of protein from 563 kcal. This was to prevent muscle loss, given the low protein content in potatoes. 

Results

  • Weight Loss: Achieved a significant reduction in weight, from 87 kg to 78 kg over 28 days, with a more rapid loss observed initially.
  • Hunger and Convenience: Generally, hunger was not an issue; however, the diet’s convenience was sometimes challenging, particularly during busy periods.
  • Potato Preparation: Utilized jarred potatoes (425 grams per jar), rinsed and microwaved for a minute, served with ketchup.
  • Energy Levels: Maintained stable energy throughout the diet, contrasting previous diet experiences that involved reduced eating.

Observations

  • Non-Palatability as a Factor: Personal dislike for potatoes and the unpleasant taste of the protein powder negatively impacted the diet experience.
  • Beverage Consumption: Primarily drank water, with occasional sugar-free pop.

Conclusions

  • Efficacy: The diet was effective for weight loss, even with the modifications.
  • Muscle Maintenance: The high protein intake likely contributed to preserving muscle mass during the diet. No measurements were made.
  • Satiety and Energy: Satiety was generally good, and energy levels remained stable.
  • Private factor: For privacy reasons, I’ve omitted a factor that may be important. Please don’t update too strongly on my results.
  • Palatability Challenges: The diet’s success might be hindered by the non-enjoyable nature of the foods consumed, suggesting a potential trade-off between effectiveness and enjoyment. 

87411834 – Potatoes + Lentils

Riff

“Potato Stoop” – basically a stew/soup of potatoes, onions, celery, red lentils and butter cooked in an Instant Pot (so I’m retaining the broth and hopefully the potassium). I’ll likely add in some supplementing with potassium chloride later when I receive it from Amazon. I’m hoping to stick with it for several weeks.

Rationale: lentils will add some protein and fiber (maybe a good thing?), and the rest is to help make it tasty and “not just potatoes”. I’ll also add salt, pepper, and various hot sauces to keep it from becoming too same-y and bland.

Report

Hey,

I’ve reached the four week mark and wanted to give an update on how things have been going and why I’ll continue with this for a while longer! It doesn’t feel like it’s been four weeks…

Background

I’m a 47 year old cishet white male with a sedentary lifestyle (IT consultant) living in Canada. Over the last few years I’ve gained “The Covid 19” and then some, so this was a good opportunity to try and lose weight for myself and For Science!

Protocol

First up, some details on what I’ve been eating. My eventual-standard recipe has been:

  • Approx. 5 lbs yellow potatoes (i.e., eyeball half a 10 lb bag from the supermarket)
  • 3 cups water
  • 1 cup dry lentils – more on this shortly
  • 1/4 cup butter

I cut the potatoes into pieces with a maximum dimension of around an inch; half go into an instant pot, then the water, then the lentils sprinkled on top, the other half of the potatoes (so now we have a half-submerged raw potato sandwich with dry lentil filling) and the butter on top. This cooks in the Instant Pot at high pressure for 11 minutes, preferably with natural release. I then “finish” things by using a wooden spoon to roughly mash the potatoes and combine in the lentils. Serve with hot sauce of choice. Do it all over again in a couple of days.

Aside Number One: Laziness aka “recipe optimization”

Originally I was also sauteing a finely diced onion and chopped celery first before doing the above steps – this added significantly to the prep time and didn’t add enough value to the experience, so I dropped it. I’ve also tried adding some herbs to the recipe but they didn’t do much for it either. Sometimes simpler truly is better. This recipe’s prep time is about five minutes.

Aside Number Two: Lentil options

At first I was using red lentils – they are a better aesthetic option as they dissolve into the cooking water and have little effect on the colour of the end product, maybe even brightening it a little. When I ran out of those I switched to green lentils – they also taste good but the colour of the result is not as inviting. Opinions will likely differ though, and it’s something I’ve adjusted to.

Aside Number Three: Potassium

I read Krinn’s experiences with Potassium supplements with great interest and decided to include this in my protocol. Starting in the middle of week two, I’ve been drinking two Gatorade Zeros each with an additional 1 teaspoon of Potassium Chloride per day. Sadly, the Costco multipack here in Canada doesn’t include “blue”.

Adherence

There have been two days when I’ve been “off” the diet. The first was an all-day industry conference, so I was eating the delicious catered food at the event. The second was after a very long day, I had an alcoholic beverage and then pigged out on the leftovers from my youngest (bagel, chicken fingers, etc…).

I’m allowing myself a “small” quantity of potato chips as part of the diet, as the meals don’t have any crunch to them and I miss that texture. I also will have things like fresh berries. All that said, I’m staying conscious of what I’m eating and staying away from what I would consider my “typical” diet.

In terms of mealtimes, I’ve sort of fallen into a 16-hour fasting period with an 8-hour feeding window. I typically have my first meal at around 11:30 in the morning, and the food day is over by 7:30PM. My potassium supplementation is generally aligned to these times as well.

This hasn’t been a hardship to adhere to because I’m giving myself some grace from being completely strict. Does that make this “riff-ish”? Perhaps, but I also feel that, outside a medical context, people are typically going to be mostly-good at sticking to a strict eating program. I would say I’m achieving the main goal, that the majority of my calories are coming from my riff. Maybe I’d have a different perspective if I was doing a more fun riff like “potatoes and Snickers bars” ‎:)

Results

I’ve been extremely pleased with how this has gone. This first graph shows progress so far (in kilograms, the native measure of my scales) – on the first day I lost almost 3kg, which I assume is water weight. The three bars are the daily weigh-in (blue), a three-day average (orange) and a seven-day average (gray). The smoothed curves show a pretty consistent weight reduction over time after the first day’s outlier reading.

I find the sawtooth peak/drop pattern intriguing in the raw data, but prefer the smoothed data for looking at overall progress.

I also found it useful / inspirational to pull a seven-day rate of change graph for these readings:

It’s a bit of a mess because the lines all overlap, but you can see from the smoothed curves that I’m typically down between 1 and 1.5 kg (i.e. two to three pounds) compared to the reading from a week before. There hasn’t yet been a sign of a decline in the rate of change.

Next Steps

As the graphs indicate, I plan on continuing this for a couple more weeks – at that point it’ll be the holiday season and I will be fully participating in seasonally appropriate food consumption! After that I will resume the diet; it’s working, I feel good doing it, and I don’t feel like I’m missing out.

Thanks for inspiring me to give this a shot!

40711007 – Misc.

Riff

Potato + Carrot (for vitamin A) + Fish (for B12 & protein) + Marmite (for B12) + salt (I hear it can be lacking if you just eat potato) + olive oil (…honestly it’s the fat source that I had lying around when I decided to commit to the bit) + various seasonings (it’s how I make soup taste of things) + Apples (I’m only about 90% that I’d be getting enough C from potatoes) + sugar-free fizzy drinks (realistically if I try to fully abstain from Treats(TM) I might indulge further than planned on other days).

Report

Hello Slime Mold Time Mold,

This morning was the 28th measurement. As I believe you can see from the data (I suppose I’m assuming you have at least read-access to the spreadsheet that you made and then gave me a copy of), in that time I shed a net total of about 8.5lb from my body mass, and that was with four explicit cheat days, as well as at least two days with an unwise amount of deep frying even by the measure of “amounts of deep frying”.

Among other things this is enough evidence for me that on the order of 2 litres a day of aspartame juice sugar free fizzy drinks is not enough on its own to thwart the potato diet. While I would by no means recommend that anyone, ever, rely on crisps (known as “chips” in America) as a main source of any nutrient, even salt – they were close to a logistical necessity during office days, and even with far more packs a day than I’d normally have used, they weren’t a consistent factor in weight gain days.

Going forwards, obviously I’m not going to be able to stick to the exact riff rigorously over Christmas, however “getting most of the calories from taters” seems to have worked pretty well as a medium to long term stratagem – at least until the trend line stops going down. Of course, I’m most certainly adding onions and swede to the list of explicitly allowed foods (can’t really make soup without onions; can’t make tatties and neeps without the neeps), and probably chicken too as it’s a cheaper protein source compared to even the cheapest tinned fish (certainly if you measure by just grams of protein per unit legal tender). Which is to say, I’ll still be taking data, but “had chicken” is no longer going to get a tick of “majorly broke diet”.

Looking forward to analysis of the data – here’s hoping something more useful was got at this stage, beyond “you can add dietary sources of A and B12 with different macro profiles to the potatoes without totally wrecking the diet” and “in a shock not seen since the Pope was confirmed to be Catholic, excessive consumption of deep fried food is correlated with weight gain”.

Kind regards
Mr Cavern

13910399 – Potatoes + Margarined Toast

Riff

My plan is to follow the potato diet but have toast with margarine for breakfast and afternoon snack. When I tried the potato diet for the first time, I had a lot of bread cravings, so it would be great if I could have it and still lose weight. I’m trying out the margarine to see if consuming seed oils hinders weight loss.

Additionally, I’ll also have mandarins and soy milk in small quantities, which are not part of the main plan, but I had them during my first attempt at the potato diet and still lost weight without any issues.

I will follow the diet for 4 weeks (unless I feel unwell or start gaining weight rapidly), and if I see that it works well, I will continue it for a longer period.

Report

I was very motivated at the start, but at the end I was cheating a lot. Also, I got a cold or something last week and I lost some weight due to that. The days I was sick have a note on the “Observations” row. And maybe relevant, all the potatoes I ate were boiled.

27482609 – Potatoes + Beef

Riff

Potato + Beef. My plan is to make potatoes the majority of my food intake, since my normal diet is very high in meat. It wouldn’t be much of a trial for me if I allowed no potato and unlimited beef. I’m not exactly sure how exactly what the restriction will be; perhaps a pound of steak and then as much potato as I want.

I will be using butter as a cooking oil, writing down how much I use per day, and I may also have beef liver on occasion.

I’d like to get back into my gym routine during the trial, and I’m not very much in the mood to experiment with a low protein diet. I also have a freezer full of grass-fed beef and I’d like to actually eat it.

Report

I’ve put my four weeks in, so I’m done. I’m sorry to say this will not be the most insightful or interesting trial you receive, but here it is. I’ve left my few thoughts and comments in the spreadsheet itself.

General notes from the spreadsheet:

I had intended to record mass of potato and steak, but I ended up messing that up enough that it wasn’t worth recording. As you can see, I was not perfect at measuring myself in the morning, either. Sorry about that.

I generally ended up eating equal parts beef and potato, sometimes large majority potato, very rarely large majority beef.

Common recipes include diced potatoes with beef, mashed potatoes with beef, sliced and fried potatoes with steak.

Philosophical Transactions: Neoncube on The Meat and Veggies Diet

Previous Philosophical Transactions:

Neoncube recently sent us some emails about a self-experiment where he ate mostly meat and veggies. The exchange is reproduced below, lightly edited for clarity.


Neoncube’s First Email

Dear Slime Mold Time Mold,

I’ve followed your writings with great interest, and now I’m enthused to write to you about the rather astounding success that I’ve had with a “meat and veggies” diet, where I lost 6% of my body weight in one month!

The story

Everyone had told me that when I hit 30 years old, I’d get fat, but I was still surprised when it actually happened. I’d always been skinny, and keeping off weight wasn’t something that I’d had to worry about much. Two years after I hit 30, though, I was 176lb (80kg), with a BMI of 25 and the beginnings of a belly.

Despite all this, I still wasn’t taking my weight very seriously. Things finally came to a head when I attended an aerobics class where I had to exercise in front of a full length mirror for an hour. The hour was rather torturous. Neither my physique nor my stamina were what I had imagined. I was fat and out of shape, and something needed to change.

After my shock, I decided to depart on a meat and veggies diet. My sister had used this diet and “lost so much weight that [she] had to stop”, and the person who had told her about the diet (my brother) has never been anywhere close to fat.

It seemed there was hope! And thus, I began the meat and veggies diet.

The diet

The rules of the diet were simple: Eat only meat and veggies, all day, every day. No sugar, no carbs, no fruit, and no dairy. The meat should be lean, and the veggies should be cooked. Try to eat a good mix of veggies.

For me, this meant something like this:

Breakfast: Chicken breast.
Lunch: Lean meat and veggies.
Dinner: Lean meat and veggies.
Afternoon snack: Chicken breast(s)
After-dinner snack: Chicken breast!

That might sound a bit boring, and truth be told, it was, but the insane amount of weight loss per day made for strong motivation to keep going!

Pictures

Breakfast, afternoon snack(s), and after dinner snack(s) generally consisted of one or two prepackaged, preseasoned, microwaveable chicken breasts. These are available in all of the convenience stores in Taipei, which made my life a lot easier! My favorite flavors were “smoke flavoring” and “black pepper” (pictured below).


Lunch was meat and veggies. I often would get chicken breast and another type of meat, as in the picture below. The leanness of the meat was, at times, arguable! Perhaps eating slightly fattier meat sometimes was a good thing, though? 

For dinner, I generally ate the same meal, at the same restaurant, every day, because it was really good and relatively filling! The vegetables were different every day, depending on what the restaurant had on hand:

Looking at the above picture, you can see that I was pretty flexible with my definition of “veggies.” I considered cooked potatoes and cooked sweet potatoes to be fine.

I didn’t eat any tomatoes that were included in my meals, because I don’t like tomatoes, but I did sometimes eat tofu, considering it a sort of protein, although I later regretted this.

Dinner came with a small bowl of miso soup and a small block of spongy cheese cake, which I happily ate. This didn’t seem to affect the diet.

Results

The graphs below are provided in both pounds and kilograms.

I started my diet around 177lb (80.1kg) and ended around 165lb (74.8kg). Over 30 days, I’d lost 11.5lb (5.3kg), for an average loss of ~0.4lb (0.177kg) per day!

I did take a five day vacation during the diet, where I gained 2.5lb (1.1kg), but amazingly, I lost it all again the first day that I returned to the diet!

I feel like the vacation clutters the graph a bit, so here’s another version with it omitted:


If we don’t count the vacation, then I only dieted for 25 days and averaged a loss of 0.5lb (0.18kg) per day. I’m not sure that’s a fair way to look at the data, but it’s interesting to consider.

Analysis

On the very first day, I broke the diet (lol) and had some bread with lunch but still lost weight.

Other than the first day, I gained weight whenever I broke the diet. This was a bit surprising. I would have imagined that eating curry rice for lunch, spicy tofu rice for dinner, or a strawberry cream puff as an afternoon snack would have resulted in less significant weight loss for the day, but instead it made me gain weight. Not only that, but every time I broke the diet, it took another day or two to start losing weight again! Another way to say this is that pretty much every time I broke the diet, even minorly, it derailed my weight loss for about three days.

On days where I actually stuck to the diet, though, I lost 0.7lb (0.3kg) per day, which was insane.

Feelings

I’d like to talk about how the diet felt.

The diet felt hard. I often felt like my blood sugar was low, causing me to break out in sweat. My energy was lower than normal. Sometimes I had heart palpitations. I’d get heat flashes a couple of times a day, and my body temperature sometimes felt higher than normal.

The saving grace was that losing 0.7lb every day that I kept to the diet was very motivating. I’d be tempted to quit nearly every day, but I’d convince myself to at least wait until the next morning. On days where morning came and I’d lost a ton of weight, I had good motivation to keep going, and on mornings where I hadn’t lost any weight, at least I knew it was probably because I’d recently broke the diet.

The general flow of the diet felt something like this: Diet hard for several days. Feel as though I just could not continue and eat some carbs. Resume the diet but not lose weight for 2-3 days. Start losing weight again. Repeat.

Although my overall memories of the diet were that it was hard and I often wanted to quit, I also remember having a few positive feelings. Having a goal and working hard towards that goal felt really good. It’d been a while since I’d had a goal that I’d worked hard towards. I also remember having feelings of being “healthy” and “clean,” although those feelings were usually soon overshadowed by hunger.

Other thoughts

Especially in the afternoon, I’d often experience strong feelings of anger or sadness and would break out in cold sweat. In my experience, these are signs of having low blood sugar. The solution was simple: Even if I wasn’t hungry, eat a couple of chicken breasts.

I think this bears repeating: If you attempt this diet, you may find yourself getting very emotional, perhaps even dangerously so. Please be very careful, and go eat if you’re feeling terrible! And if you feel like you’re dying, consider stopping the diet!

During the diet, I drank much more caffeine than normal, mainly black coffee, very strong black tea, and very light green tea. In my experience, caffeine can act as a blood sugar regulator, and that may have been particularly important during this diet.

Back when I was skinny, I used to consume a lot more caffeine, and I remember thinking several times during the diet “This is how I felt during college!” Perhaps there’s something to be said for eating little and drinking lots of caffeine.

I was also amazed at how much fuller eating large amounts of cooked veggies made me feel. Indeed, I think there is much potential for designing a diet centered around eating a massively increased amount of cooked veggies.

Future improvements

If I were to do this diet again, I’d probably try to avoid tofu. It felt like every time I ate tofu, I either gained a bit of weight or didn’t lose as much as I should have. I didn’t keep good enough notes to be sure of this, though.

Thanks

Thanks be to God, always!

Thanks to my brother for teaching my sister this diet, and thanks to my sister for teaching it to me! And thank you to Slime Mold Time Mold for publishing this! 🙂

Closing thoughts

Although I did lose an insane amount of weight during the meat and veggies diet, I’m not sure I’d advise other people to try it. There were several times where I literally felt like I was dying (did I mention the heart palpitations?), and I think it’s possible that if I hadn’t broken the diet as many times as I did, I might not have made it.

I did learn quite a bit from this diet, though. Chicken breast is now my go-to breakfast food and snack, and I try to work a lot more cooked veggies into my diet.

If you do attempt this diet (or a variation of it), I’ve created r/meatveggiesdiet for people to share their experiences, or feel free to use the #meatveggiesdiet hashtag on Twitter/Instagram. Again, I’m not recommending that people try this diet, but if you do, it might be good to have a support group!

Finally, I’d like to include some more pictures of what I generally ate each day. Eating lean meat and veggies doesn’t have to be boring!

Chicken breast with black pepper seasoning:

Chicken breast with green onion (scallion) sauce:

Steamed/boiled ground pork (This was one of my fattier meals, and I didn’t eat this often):


SMTM’s Response

Hi Neoncube! 

Amazing, this is so cool! We did have a few questions:

First, what do you normally eat? This looks kind of like it works by elimination, so it would be interesting to know what you are eliminating. A lot of bread? Omelettes? Rice? Tofu? 

Second, we can’t remember, have you tried the potato diet before? It would be interesting to know whether or not that works for you, given that meat + veggies works.

Your Friends,
SLIME MOLD TIME MOLD


NeonCube’s Response

Yay, I’m glad you like it! ^_^

About a year ago, I tried the potato diet for 13 days (with a few cheat days), losing 2.3kg (5lb). The potato diet and the meat and veggies diet had some similarities, with me experiencing heat flashes, sudden depression/anger, and general feelings of weakness during both diets.

It’s interesting that you mention this possibly being an elimination diet. I’d done some thinking along those lines, too, although most of my thinking for this diet had focused on a different question: Why did this diet make me lose weight so quickly? I have a few theories:

  • Protein is a complex molecule. Perhaps every time I ate, a significant portion of the meal’s energy was spent on breaking down the protein in the meal.
  • Perhaps the diet allowed me to run a caloric deficit without putting my body into starvation mode.
  • Perhaps a diet of all meat and veggies is lacking something that the body needs, and it has to tap into its fat stores to get that crucial element.

Let me gather some pictures of what I used to eat. I think that’ll be more entertaining and informative than just descriptions.

Here they are, pictures of what I often ate before starting the meat and veggies diet!

Breakfast was the same every day: A light, unfilled piece of bread called a “cow horn”:

My favorite lunch was curry (chicken, carrots, and potatoes) and rice:

Dinner varied a lot, but one of my mainstays was this Mexican rice bowl. I may have been adding grated cheese and guacamole:

I also split something like this with my girlfriend a couple of times a week (tofu, stir-fried beans, Kung Pao chicken, and 1-2 bowls of rice):

For dessert, the convenience stores have soft-serve ice cream:

Shaved ice was also another option. Pictured here: Unsweetened ice with chocolate syrup, cereal flakes, bananas, sweetened condensed milk, and pana cotta.

P.S.

A random thought: I drank a fair amount of Chinese bitter tea (“kucha” – 苦茶) during this diet. Specifically, I drank about 3/4cup of it once every 2-3 days, pretty much always immediately after dinner. I think bitter tea is supposed to be somewhat of a dieting drink. For me, it seemed to have a stabilizing effect on my blood sugar levels, and it also had the effect of very quickly inducing bowel movements. (I can’t find much English information about bitter tea, but Wikipedia has an article about Theacrine, which is apparently the tea’s active ingredient. Interestingly, that article says that Theacrine is similar to caffeine, which I also found helped me regulate my blood sugar levels).


SMTM’s Response to the Response

This is great! 

One other question: We’re wondering if this diet would work in other places (like the USA) or if it would only work in Taiwan. The other people you mention who had success with this approach are your brother and your sister (already interesting since they’re close genetic relatives) — do they live in Taipei, or did they try the diet while living somewhere else? 


Neoncube’s Response to the Response to the Response

Good question! Both my brother and sister were in the U.S.A. when they did diets like this one. My brother was in Boise, Idaho. I’m not sure which part of the U.S. my sister was in.

I do know of one non-relative who’s done this diet: My Taiwanese ex-girlfriend. I didn’t mention her, because when she did the diet, she went hardcore and combined the meat and veggies diet with intermittent fasting. If I remember correctly, she ate just two meals each day, both consisting of meat and veggies, with the meat often being chicken breast or fish. I think she would also drink a liter of Coca-cola when she felt her energy was low, and she might have done some light snacking, as well. She did this for at least six months and was still doing it the last time that we spoke. I honestly don’t know how she did it. She did lose a ton of weight, though.

Potato Diet Riff Trial: Sign up Now, lol

When we finished the Potato Diet Community Trial, we found ourselves in a pickle. The diet worked — people lost 10.6 lbs on average over only four weeks — and we had basically no idea why. No idea what parts of the protocol were essential, and what parts were optional. 

We had no idea what would make it work better. We had no idea what might make it work worse. And we had no idea of the boundary conditions. We told everyone to avoid dairy, but was that really necessary? Is the potato diet very strict, and you need to stick closely to the original protocol? Or is it very lax? When does it stop working, and why? 

Since then, we have investigated a few of these questions. We tested our main hypothesis about the mechanism (potatoes give you high doses of potassium) and the results provided some support for that hypothesis. We tried a 50% potato AKA half-tato diet based on some case studies, but the results were underwhelming. And we’ve encouraged people to do self-experiments that try to get at the same questions. One example is friend-of-the-blog Krinn, who tried higher doses of potassium and consistently lost weight.

We could keep going like this, running one study at a time. But honestly, that would take forever. The problem is that you can easily come up with 100 different hypotheses for what’s going on. Ok, so you run 100 different studies to test each one. But studies take a long time to run — let’s say 6 months per study. Congratulations, you’ve just locked yourself into 50 years of studying nothing but iterations on the potato diet. There has to be a better way. 

So today we’re introducing a new kind of study we call the riff trial. Let’s see how it works!

Variations on a Meme

In a normal study, everyone follows pretty much the same protocol. In some kinds of studies, like randomized controlled trials, participants are randomly assigned to a small number of very similar protocols.

Instead of making protocols standard, the riff trial makes protocols different. In a riff trial, you start with a base protocol, and every participant follows a different variation. Everyone tests their own riff on the original protocol, and you see what happens. 

To give credit where credit is due, the blogger known as ExFatLoss did something like this first. He ran a study where 10 people signed up to try his ex150 protocol. In practice, however, most people tried minor riffs on the original protocol, like adding an “illegal” carrot salad, and they still generally lost weight. This is a better test of the robustness of his protocol, and it’s a more efficient way to explore the design space. 

Now it’s our turn. Today we are starting a Potato Riffs Trial, and we’re looking for people who want to try their own riff on the potato diet. 

A riff trial takes advantage of the power of parallel search. Some riffs will work better than others (or at least differently), and parallel search helps you find these differences faster, especially if the differences are big.

Or if you prefer, it uses the power of evolution. The original protocol goes out with mutations and we see how they do in the face of natural selection. If you want, you can even run a second riff trial on the most successful riff(s), to explore the space even further. In this way, the riff trial is the atomic gardening of study design.

Some riffs will be more compelling than others. If you do a riff and lose weight on that version of the potato diet, this suggests the potato diet is robust to that difference. If you do a riff and don’t lose weight, that’s tricker, because we know the potato diet doesn’t work for some people — maybe you are just one of those people. 

But even when individual riffs don’t prove much, together they can be suggestive. If ten people try potatoes + bacon and they all gain weight, that’s pretty strong evidence that bacon is the anti-potato. You could also account for this by doing a few weeks of the original potato diet to demonstrate that it works for you under normal conditions, and then starting the riff to see if anything changes.

A riff trial is scientific fun for friends and family. If a husband and wife living in the same house try different potato riffs, and have different results, we know the differences aren’t a result of their environment, since they live in the same house and sleep in the same bed and so on. If adult siblings living in different cities try the same potato riff and have different results, the differences are probably due to differences in their cities, since the siblings are closely related and are doing the same protocol.

This is also a way to put your money where your mouth is, so to speak. We love all y’all people on the internet, but some of you talk a lot and experiment very little. Science needs to be more competitive — not in the sense of arguing (bleh!) but in the sense of people actually doing studies to go after their disagreements rather than just theorizing about them. This is your chance to get your hands dirty.

And as always, this is a chance to PLAY with your ideas, to PLAY WITH SCIENCE, to JOIN the INTERNET HIVE MIND and MESS AROUND WITH YOUR FRIENDS. This can be your way to help welcome the 21st century scientific revolution you so desperately crave.

Science is a freaking blast!

Tl;dr, we’re looking for people to volunteer to eat almost nothing but potatoes (depending on your riff) for at least four weeks, and to share their results. You can sign up below. For more detail, read on! 

Potato Riffs

As a reminder, here is our version of THE POTATO DIET (more detail can be found in the original post):

  • Drink mostly water. You can also have other beverages like tea or coffee. Just don’t take them with cream or sugar and try not to get too many calories from your drinks. 
  • Eat potatoes. Start with whole potatoes and cook them yourself when you can, but in a pinch you can eat potato chips or fries if you need to. You can calculate how many potatoes to eat (a potato is about 100 calories, so if you need 2000 kcal/day, eat about 20), but we think it’s better to eat the potatoes ad libitum — make a lot of potatoes and just eat as much as you want.
  • Perfect adherence isn’t necessary. If you can’t get potatoes, eat something else rather than go hungry, and pick up the potatoes again when you can. 
  • Seasonings are ok. Do what you can to keep yourself from getting bored.
  • Oil is ok.
  • Take a daily B12 supplement, since potatoes don’t contain any. We like this version but use whatever you like. Take vitamin A if you’re not eating sweet potatoes. A multivitamin would also be fine as long as it contains B12. 

Your mission, should you choose to accept it, is to try the potato diet plus some kind of variation of your choice for at least four weeks. You can try any riff you like, but for inspiration, here is a list of ideas:

  • Whole foods
    • Potatoes + Avocado
    • Potatoes + Bananas
    • Potatoes + Cashews
    • Potatoes + Fruits
    • Potatoes + Leafy Greens
  • Unwhole/Processed Foods
    • Potatoes + Snickers
    • Potatoes + Hot Dogs
    • Potatoes + Soda
    • Potatoes + 10% Ultra-Processed Foods
  • Various Fats
    • Potatoes + Butter
    • Potatoes + Olive Oil
    • Potatoes + Sunflower Oil
  • Grains
    • Potatoes + Bread
    • Potatoes + Rice
  • Protein
    • Potatoes + Tofu
    • Potatoes + Chickpeas
    • Potatoes + Beans
    • Potatoes + Eggs
    • Potatoes + Ground Beef
    • Potatoes + Chicken
  • Food Suspects
    • Potatoes + White Sugar
    • Potatoes + Honey
    • Potatoes + Chocolate
    • Potatoes + Cream
    • Potatoes + All Dairy
    • Potatoes + Ketchup
    • Potatoes + Tomato Sauce
  • Preparation
    • Potatoes (baked only)
    • Potatoes (boiled only)
    • Potatoes (roasted only)
    • Potato Soup SOUP ONLY
  • For Humor Only

Before you sign up, let’s highlight some riffs we might be especially interested in:

Mono-Diet

Some people think the potato diet causes weight loss because it is a mono diet, a diet where you eat mostly one food. We think this is wrong! If it were true, 1) any other mono diet would also work, and 2) the half-tato diet wouldn’t work because you eat more than one thing. But the half-tato diet does seem to work, at least for some people. Also there was so much cheating in the original potato diet (by design!) that we’re not sure even most of those would could as a mono diet really:

So one very simple riff you can do is the potato diet plus some other food of your choice. Potatoes and apples. Potatoes and lettuce. Potatoes and carrots. If the mono-diet hypothesis is true, adding these other foods should stop the potato diet from working. If it keeps working, that’s a major problem for the mono-ness hypothesis. 

Deliciousness

Some people think the potato diet causes weight loss because it is bland. We think this is wrong too. First of all, potatoes are delicious. Second of all, this doesn’t make any sense. Why would that happen.

However, one riff you could do is potatoes plus one or two foods you think are especially delicious. This seems like a good deal. You get to eat potatoes and one or more of your favorite foods, as much as you want for a whole month, and you might lose weight for your trouble. If you do lose weight eating potatoes and a favorite food, that’s a major problem for the blandness hypothesis. Also it makes sense.

Potatoes + Whole Foods or Unwhole Foods

Some people think the potato diet causes weight loss because potatoes are whole foods — they are totally unprocessed, unadulterated, torn directly from the bosom of Mother Earth. This might be part of it, though it makes us wonder what it might be about “whole foods” that would make them cause weight loss. 

Anyways, one way to test this would be to try eating potatoes plus some other whole food, like almonds or bananas. If the whole food hypothesis is correct, this should cause as much weight loss as the normal potato diet, maybe more.

Or you could do the opposite, and try eating potatoes plus some highly-processed food, like snickers bars or Big Macs. If the whole food hypothesis is correct, eating these processed foods should make the potato diet much less effective. But if you lose weight on potatoes + gummy worms, that’s evidence against the whole foods hypothesis.

...yes

Potatoes + Cream

ExFatLoss has lost a lot of weight on a diet that is mostly heavy cream. When he recruited ten other people to try the same thing, most of them lost weight too. If potatoes cause weight loss, and cream causes weight loss, maybe potatoes and cream together will cause even more weight loss? 

Worth trying, at least, especially since in the original Potato Diet Community Trial, we asked people to avoid dairy. Maybe that was the wrong move. You could also do potatoes + light cream or potatoes + milk, to see if milkfat matters. Or just a general potatoes + dairy, where you eat both potatoes and any dairy products ad libitum

Potatoes + Various Fats

Some people think that seed oils are the cause of the obesity epidemic, and/or are bad for you in general. From this perspective, the reason the potato diet works is that it cuts all the seed oils out of your diet — you’re too busy eating potatoes. As we’ve previously argued, we don’t find this theory very convincing. But it’s easy enough to test. We wrote:

It would be easy to run a variation of the potato diet where half the participants are randomly assigned to eat their potatoes with butter, and the other half are randomly assigned to eat their potatoes with sunflower oil. (Or substitute these for whatever fats the seed oil theorists think are best and worst.) If the seed oil theory is correct, then the participants eating potatoes + butter should lose weight much faster than the participants eating potatoes + sunflower oil. If the seed oil theory is wrong, there should be basically no difference.

This would be a good subject for riff trials. If they want to, some people can sign up to eat olive oil with all their potatoes, some can sign up to eat butter with all their potatoes, some can sign up to eat canola oil, etc. Then we can see if there are big differences between people who choose different fats. 

If seed oil theorists are really confident in their theory, they should sign up and demonstrate that seed oils kill the potato weight loss effect, and other fats don’t.

Potatoes and Suspected Blockers

The potato diet may work by adding things to your diet, like huge doses of potassium. But it may also work by removing things from your diet. (It might also do both.) This suggests that there may be some foods that “block” the potato weight loss effect. You can test this in a riff by trying the potato diet plus one of these foods, to see if it keeps working or not.

One prime suspect is tomato and tomato products like ketchup. Ketchup came to our attention as a result of some anecdotes from the original Potato Diet Community Trial, stories where people felt that eating ketchup kept them from losing weight. As Jack Peterson noted, tomatoes blocking the effect “would explain why no one ever noticed [the weight loss properties of potatoes] prior to Chris Voigt’s stunt: because potatoes are usually eaten with ketchup”. And we were surprised to see that in the Half-Tato Diet Community Trial, weight loss was correlated with tomato consumption, r(36) = 0.37, p = .021 (also significant when removing the extreme outlier, r(35) = 0.36, p = .031). Plot here:  

So you could try a potato diet with ketchup in particular, or with tomato products in general. If you still lose weight, that would show that tomato isn’t necessarily a blocker. If you don’t lose weight, that’s pretty interesting. You could also try alternating weeks with and without tomatoes, to see if you can make the effect turn on and off at whim. Whee! 

Tomatoes are our top bet, but other possible blockers might be: wheat, bread, grains more generally, maybe meat. Carbs stand out because on the potato diet you are getting a lot of carbs. So even if you do take a cheat day, you probably won’t be cheating with bread, because you probably won’t crave that. Some people think sugar might be a blocker, so you could try potatoes + white sugar (but maybe not together, ew). Eggs or goji berries might also be blockers because they seem to be high in lithium. So one kind of riff would be trying potatoes and one of these foods and seeing how it goes. 

Potatoes + Chocolate

CuoreDiVetro recently published a self-experiment where they followed a very simple form of the potato diet, replacing one meal per day with a meal of just potatoes, supplemented by additional doses of potassium chloride (based off of a potassium:sodium ratio hypothesis that has been floating around). This worked very well for them at first — then they discovered that it appeared to work even better when they included chocolate, like so:

I bought dark baking chocolate (100% cacao) with a high concentration of potassium (just in case it was the potassium). I made my hot cacao by melting ~36g of dark chocolate (containing roughly 750 mg of K) in roughly one cup (250ml) of milk (containing roughly 350 mg of K) and sweetening it to taste. 

According to CuoreDiVetro, they lost weight four times faster when they were eating one hot chocolate per day in addition to their meal of potatoes.

This could be something about chocolate in particular. But it might also be yet another pointer to stearic acid, a waxy fat common in foods like tallow, lard, butterfat, and cocoa butter, which for some reason keeps showing up in weight loss research. If you’ve heard of this fat before, it’s likely from Fire in a Bottle (FIAB), a website/program/theory which argues that a diet high in stearic acid can cause weight loss. This is sometimes called The Croissant Diet (TCD), presumably in the hopes of confusing readers — you do not actually eat nothing but croissants. In fact, you don’t have to eat any croissants at all. But you do ideally eat lots of foods high in stearic acid, sometimes supplementing with additional stearic acid, and some people seem to lose weight when they do this.

There are other reasons to think that stearic acid might be involved. ExFatLoss and co must be getting a lot of stearic acid from the huge quantities of milkfat they’re consuming. And Outlier 17 from our Half-Tato Diet Community Trial, who lost way more weight than anyone else in the trial, often took straight stearic acid as a supplement. 

So you could supplement stearic acid on top of your potatoes and see what that does. Or you could try potato + chocolate, which seems more delicious. But to each their own. 

You could also try CuoreDiVetro’s riff exactly, or riff further off that riff. It appears to be 1) one meal per day as a meal of just potatoes, 2) potatoes are salted with 3.2 g KCl, 3) avoid adding NaCl (normal table salt) to potatoes, 4) at least one hot cacao per day, per the recipe above, and 5) otherwise eat as normal. This is really several riffs away from the main protocol and might not be as illuminating, but would give another similar data point for comparison. 

Preparation

We think the potato diet might cause weight loss because of the super high doses of potassium you get when you eat tons of potatoes. We also hear that boiling potatoes removes a lot of their potassium, because it drains out of the potato and into the boiling water. If this is the case, then eating nothing but boiled potatoes would probably cause much less weight loss than eating nothing but baked or roasted potatoes, which should still have all their potassium. Unless you boiled your potatoes as a soup and then drank all the broth.

Doing a riff where you only ate one kind of preparation, whether those be boiled, baked, fried, steamed, roasted, mashed, or souped potatoes, might illuminate this question. But it might be kind of boring.

Half-Tato Accelerator

Many people lose weight on the half-tato diet, like M, Nicky Case, Outlier 17, and CuoreDiVetro. We say “half-tato”, even though many of these people were getting less than 50% of their food from potatoes. But when we ran a community trial of the half-tato diet, most people barely lost any weight.

What gives? Maybe there’s some extra step required to make half-tato work. If we could figure out that extra step, people could lose weight with much less hassle. So if your riff seems to be working on full-tato, you could switch to half-tato and see if it keeps working just as well. Or you could try various riffs on half-tato and see if any of them serve as the switch. 

Get Confused

They say that the most exciting phrase to hear in science is not “Eureka!” but “That’s funny…” So the best thing that could happen would be if you find something really weird. For example, it would be very weird if people found that taking iron supplements makes the potato diet totally ineffective… unless you take iron supplements AND magnesium supplements, in which case it starts working again (we have no reason to think this would happen, just a wild hypothetical). If that happened and it were robust, it would be very surprising, and trying to puzzle it out would get us closer to an answer.

So if you have some other weird potato diet riff you want to try for some reason — we say, go for it!

Sign Up

Ok researchers, time to sign up.

The only prerequisites for signing up are: 

  • You must be 18 or older;
  • In generally good health, and specifically with no kidney problems;
  • Willing to do some version of the potato diet, as described above, for at least four weeks, and;
  • Willing to share your data with us — you can publish it as a philosophical transactions post on our blog if you like, or publish it somewhere else on your own.

As usual, you can sign up to lose weight, lower your blood pressure, get more energy, or see one of the other potential effects. But you can also sign up to help advance the state of medical science. This study will hopefully get us much closer to understanding why the potato diet causes weight loss. It might lead to a practical weight-loss intervention that’s much easier than the 100% potato diet, and it might lead to curing obesity for good.

And beyond that, running a study like this through volunteers on the internet is a small step towards making science faster, smarter, and more democratic. Imagine a future where every time we’re like, “why is no one doing this?”, every time we’re like, “dietary scientists, what the hell?”, we get together and WE do it, and we get an answer. And if we get a half-answer, we iterate on the design and get closer and closer every time. That seems like a future worth dreaming of. If you sign up, you get us closer to that future.

Eating this much potato may sound a little daunting, but people who have tried it say that it is much easier than they expected, and delicious to boot. Here’s our suggestion: If you are at all interested in trying a potato diet riff, go ahead and sign up and start collecting your data. Collect your baseline measurements for two weeks, then try the first day or two of the potato diet and see how it feels. If you hate it and have to stop, we would still love to have that data.

If at any point you get sick or begin having side-effects, stop the diet immediately. We can still use your data up to that point, and we don’t want anything to happen to you.

We are mostly interested in weight loss effects for people who are overweight (BMI 25+) or obese (BMI 30+), but if you are “normal weight” (BMI 20-25) you can also sign up. 

And for everyone, please consult with your doctor before trying this or any other weight loss regimen. 

We realize that anyone who starts a potato riff soon will overlap with Thanksgiving and/or Christmas. So you’re welcome to wait and sign up later, we will keep signups open at least through January, maybe longer. But also, it’s not a problem if you overlap with the holidays, and it might be a good way to see how robust your riff is. Someone doing an “I ate potatoes and whatever holiday treats I wanted” would honestly be an amazing study.

In general, signups will be open for a while, and it’s all rolling signups. Pick out a riff and join whenever.

If you were part of previous SMTM studies, please feel free to sign up for this study as well! Just mention it, and provide any previous subject numbers, when you’re signing up.

How do you decide what riff to choose? Here are three approaches to consider:

  1. Follow what you like. Do you like steak a lot? Maybe that’s a sign that your body needs more steak. Even if not, you would probably enjoy it. So why not sign up for a steak and potatoes riff? You might lose weight, and even if you don’t, you’ll be making an important scientific contribution while eating delicious foods you enjoy. 
  2. Put your money where your mouth is. This is a chance to test your theoretical bone to pick, whatever that might be. If you think the potato diet works because it is low sugar, then potatoes + sugar shouldn’t work. You can try that and test your idea. If you think the potato diet works because it is a seed oil elimination diet, then potatoes + sunflower oil shouldn’t work, while potatoes + coconut oil should work as normal. You can recruit three friends and test it. You might be surprised. 
  3. You can choose “randomly”. What sounds funny? What is no one else doing? Go with that. 

Anyways, to sign up: 

  1. Fill out this google form, where you give us your basic demographics and contact info. You will assign yourself a subject number, which will keep your data anonymous in the future. You will also tell us what riff(s) you’re interested in. 
  2. We will clone a version of this google sheet and share the clone with you. This will be your personal spreadsheet for recording your data over the course of the diet.
  3. On the first day, weigh yourself in the morning. If you’re a “morning pooper”, measure yourself “after your first void”; if not, don’t worry about it. We don’t care if you wear pajamas or whatever, just keep it consistent. Note down your weight and the other measures (mood, energy, etc.) on the google sheet.
  4. Do your version of the potato diet for at least four weeks.
  5. When you reach the end of the diet (whether you’re ending the diet early, reaching the end of 4 weeks, or reaching the end of a longer span), send us an email. Let us know if you want to publish your results yourself (in which case send us a link to your post) or if you want to publish your results on SMTM as a philosophical transactions post (in which case send us a detailed email about your protocol, results, and thoughts).
  6. Remember that it is ok to end the study early if you need to, for example if you get sick. It’s also fine to reach the end of 4 weeks and keep going if you’re having a good time. Just make your intentions clear in the comments on your data sheet and send us an email whenever you decide to finish, we’d love to hear from you.

We plan for this to be somewhat more relaxed and more casual than our previous studies, so please understand if we take a few days to sign you up or get back to you about anything.

As always, if you think this is an interesting idea, please tell your friends!

How Much Lithium is in Your Twinkie?

1. Introduction

How much lithium is in your food? Turns out this is harder to answer than you might think.

You might be interested in this question because clinical doses of lithium (50-300 mg/day) are a powerful sedative with lots of nasty side effects. Many of these side effects also show up in people taking subclinical doses (1-50 mg/day). Even trace doses (< 1 mg/day) seem to have some effects. And the EPA is concerned about exposure to levels as low as 0.01 mg/L and 0.06 mg/L

There are lots of different methods you can use to estimate the lithium in a sample of food. This usually involves some kind of chemical liquefication (“digestion” in the parlance) paired with a tool for elemental analysis. You need digestion to analyze food samples, because some analysis techniques can only be performed on liquids, and as you may know, many foods are solids or gels. Mmmmm, gels. *HOMER SIMPSON NOISES*

Most modern studies use ICP-MS for analysis of metals like lithium, combined with digestion by nitric acid (HNO3). ICP-MS is preferred because it can analyze many elements at once and it is considered to be especially sensitive. HNO3 is preferred because it is fast and cheap compared to alternatives. 

Studies that use HNO3 digestion with ICP-MS tend to find no more than trace levels of lithium in their food samples — only about 0.1 mg/kg lithium in most foods, and no foods above 0.5 mg/kg. Examples of these studies include Ysart et al. (1999), which surveyed 30 elements in a wide variety of UK foods and found no more than 0.06 mg/kg lithium in any food; Saribal (2019), which measured the levels of 19 elements in cow’s milk samples from supermarkets in Istanbul, and found less than 0.04 mg/L lithium in all samples; and Noël et al (2006) which surveyed the levels of 9 elements in “1319 samples of foods typically consumed by the French population”, finding 0.154 mg/kg or less lithium in all foods (though they reported slightly higher amounts in water).  

But as we’ve reviewed in previous posts, the literature as a whole is split. Studies that use other analysis techniques like ICP-OES or AAS, and/or use different acids like H2SO4 or HCl for their digestion, often find more than 1 mg/kg in various foods, with some foods breaking 10 mg/kg. Examples include studies like Ammari et al. (2011), which found 4.6 mg/kg lithium in spinach grown in the Jordan Valley; Anke, Arnhold, Schäfer, and Müller (1995) which found more than 1 mg/kg lithium in many German foods, including 7.3 mg/kg lithium in eggs; and in particular we want to mention again Sievers & Cannon (1973), which found up to 1,120 mg/kg lithium in wolfberries (a type of goji berry) growing in the Gila River Valley.

1.1 State of the Art Isn’t Great

From the existing literature alone, it’s hard to say what concentrations are present in today’s food. Different papers give very different answers, and often seem to contradict each other. It’s hard to get oriented.

We don’t want to give the impression that there’s a consensus to be boldly defied, or that there are two opposing camps. It’s more like this: hardly anyone has even tried to do a decent job of even looking for lithium in food or taking it seriously, and we are here to smack them and tell them to pay attention to something that has been ignored. This is not a well-studied question. It is a subject that has been the topic of few papers and even fewer authors. It is a small literature and very confused.

Hardly anyone can even be bothered to look for lithium. When it does appear in a study, half the time it feels just tacked on to a list of things that the authors actually care about (like in the France study above). Many of these studies are really looking for toxic metals like lead and cadmium, which are obviously important things to check for in our food. But this makes lithium an afterthought. And when authors don’t care, fundamental issues of analysis can easily be overlooked. The assumption seems to be that you can just throw everything into the same machine and get a good measurement for every element without any extra effort. But as we’ll see in a moment, that may not be the case. 

As we hinted at above, the analytical methods may be the root of the problem. Studies that use HNO3 digestion with ICP-MS report minor trace levels of lithium in food. Studies that use other forms of digestion or other analytical techniques report much higher levels, often above 1 mg/kg. This makes us think that the different analyses are the reason why these papers get such different estimates. However, we couldn’t find any head-to-head comparisons in the literature, and it isn’t clear if the problem lies with ICP-MS, HNO3 digestion, or both.  

1.2 Effects of Lithium

This is more than a purely academic question: lithium is psychoactive, and exposure through our food could have real health effects. 

Clinical doses, which usually range between 56 mg and 336 mg elemental lithium per day, act as a mood stabilizer and sedative. These doses also cause all kinds of nonspecific adverse effects, including confusion, constipation, headache, nausea, weakness, and dry mouth. 

Some people take subclinical doses of lithium (usually 1-20 mg or so), and when we went on r/Nootropics and asked people what effects and side-effects they experienced taking doses in this range, people reported a whole bundle, the 10 most common being: increased calm, improved mood, improved sleep, increased clarity / focus, brain fog, “confusion, poor memory, or lack of awareness”, increased thirst, frequent urination, decreased libido, and fatigue. 

Even the trace amounts of lithium in our drinking water (< 1 mg/L) may have some effects. A epidemiological literature with roots dating back to the 1970s (meta-analysis, meta-analysis, meta-analysis) suggests that long-term exposure to trace levels of lithium in drinking water decreases crime, reduces suicide rates, reduces rates of dementia, and decreases mental hospital admissions, and this is supported by at least one RCT. The EPA is even concerned about exposure to levels as low as 0.01 mg/L and 0.06 mg/L, describing them as “concentrations of lithium that could present a potential human-health risk”, though they don’t say why.

1.3 Measurement

Trusting your methods is the basis of all empirical work. The disagreement in the existing literature is important because we don’t have a good sense of how much lithium is in our food. It’s concerning because it suggests we might not know how to measure lithium in our food even when we try! This looks like a crisis of methods either way. 

High enough levels of lithium in our foods would be dangerous, so we should know how to take a piece of food and figure out how much lithium is inside it. But there isn’t much research on this topic, and it looks like different methods may give very different answers — if this is true, then we don’t know how to accurately test foods for lithium. And it’s likely that lithium levels in the environment are increasing due to both lithium production and fossil fuel prospecting — see Appendix B for more. 

As an analogy, we should know how to measure mercury levels in fish in case it’s ever a problem — our chemists should be able to check fish samples periodically and get a good estimate of the mercury levels, an estimate we feel we can rely on. Because if we can’t measure it, then we don’t know if it’s a problem. High levels could slip by undetected if our methods aren’t right for the job.

1.4 Head-to-Head

Before we can really figure out how much lithium there is in food, we need to find analytical methods that have our full confidence. And the simplest way to test our methods is a head-to-head comparison. 

This seemed easy enough, so we set up a project with research nonprofit Whylome to put a set of foods through different digestions and put the resulting slurries in different machines, and see if they give different answers. By comparing different digestions and analytical methods on a standard set of food samples, we should be able to see if different techniques lead to systematically different results.

Based on the patterns we saw in the literature, we decided to compare two analysis techniques (ICP-MS and ICP-OES) and three methods of digestion (nitric acid, hydrochloric acid, and dry ashing). Details about these techniques are in the technical report, and in the methods section below.

We originally wanted to compare more analysis techniques (AAS, flame photometry, and flame emission methods) but weren’t able to find a lab that offered these techniques – they are somewhat oldschool and not in common use today. More on this below.

It turned out that the type of analysis didn’t make much difference, but the way in which samples were digested for analysis was surprisingly impactful. And the technique that’s most commonly used today seems to underestimate lithium, at least compared to alternatives.

This project was funded by a generous donation to Whylome from an individual who has asked to remain anonymous. General support for Whylome in this period was provided by the Centre For Effective Altruism and the Survival and Flourishing Fund

Special thanks to all the funders, Sarah C. Jantzi at the Plasma Chemistry Laboratory at the Center for Applied Isotope Studies UGA for analytical support, and to Whylome for providing general support. 

The technical report is here, the raw data are here, and the analysis script is here. Those documents give all the technical details. For a more narrative look at the project, read on. 

2. Methods

The basic idea is to test a couple different analytic approaches on a short list of diverse foods. 

Most modern analyses use either ICP-MS or ICP-OES. Some of these papers find low concentrations of lithium in food; some of them find high concentrations. We wanted to compare these two techniques to see if they might be the cause of the differences in measurements.

Based on what we had seen in the literature, we decided to compare two analysis techniques (ICP-MS and ICP-OES) and three methods of digestion (nitric acid, hydrochloric acid, and dry ashing), fully crossed, for a total of six conditions. 

2.1 Food

As this is our first round of testing, we wanted a diverse set of foods that could give us some sense of the American food environment in general. Therefore we were looking for a mix of foods that were animal-based and plant-based, highly-processed and unprocessed, a mix of fruits, vegetables, dairy, carbs, and meats. We also made sure to include some foods that previous literature had suggested could be extremely high in lithium (like eggs and goji berries), to see if we could confirm those results. Twinkies made the cut because they’re highly processed and highly funny.

In the end, we settled on the following list:

  • Milk 
  • Carrots 
  • Eggs 
  • Ketchup 
  • Spinach 
  • Corn syrup 
  • Goji berries 
  • Twinkies 
  • Ground beef 
  • Whey powder  

All foods were purchased in August of 2022 at grocery stores around Golden, Colorado. Foods were immediately dried, blended, and divided into tubes for further processing, with weight measurements taken at each step of the process. 

For example, this is how we prepared the eggs. A carton of twelve eggs were cracked into a stick blender, and blended until well-mixed. A subset of the resulting egg blend was then dehydrated, enough to produce all of the needed material with some to spare. The dried egg (more like flakes at this point) was crushed and mixed well. All samples were taken from this egg powder. Three samples each were submitted to every method of analysis, so every result is an estimate of the concentration of the target element averaged across the whole carton. Put another way, our sample size was one (1) carton of eggs, not 12 eggs separately. As the egg blend was well-mixed, all samples should in principle have the same concentration of elements, suggesting that any variation between samples is the result of analytic noise rather than variation between different eggs or different cartons.

the aforementioned eggs post-dehydration (but before crushing/powderizing)

The member of the team who prepared the samples had this to say:

Making a “Twinkie puree” out of a bowl of twinkies, and then precisely weighing it out into drying trays and placing it in a dehydrator, is probably the strangest thing I have ever done in the name of science. My trusty stick blender really struggled with twinkies, and I had to take a pause because the overworked motor started to make a burning smell. “Twinkiepuree” has unusual visco-elastic properties which make it worth the effort.

Samples were analyzed in triplicate, and each replicate was done entirely separate (its own digestion and its own analysis of the resulting post-digestion solution). Order was randomized, to minimize the risk of “carry-over” from one analysis to the next.

2.2 Digestion

In the literature, most analyses that found low levels of lithium used digestion by nitric acid. To see if this might be the cause of the differences in results, we decided to compare nitric acid digestion to some other digestion approaches. In the end we settled on two other kinds of digestion: 1) digestion with hydrochloric acid, and 2) “dry ashing”, where samples are burned at high temperatures, then the ash is dissolved in nitric acid.

Dry ashing is a good complement to these acid digestion techniques because while oily foods are very chemically resistant to oxidizers, they are also very flammable. Greasy foods full of hydrocarbon chains that may not perfectly come apart in an acid are likely to be fully broken down by incineration. Incineration causes organic compounds to exit the sample as CO2 gas, but elements like sodium, potassium, magnesium, and lithium are non-volatile and remain behind in the ash.

2.3 Analysis

Both ICP-MS or ICP-OES generate a tiny cloud of high-energy plasma, the “inductively-coupled plasma” of the acronym. And both methods inject a cloud of liquid droplets into that plasma. The difference is that ICP-OES examines the light that is emitted by the plasma as the liquid sample hits it, while ICP-MS examines the actual particles of matter (ions) that are emitted by the plasma as the sample hits it, by directing those ions towards a sensor.

3. Results

The first surprise was that hydrochloric acid digestion visibly failed to digest 6 of the 10 foods. Digestions were clearly incomplete and significant solid matter was still visible after the procedure. The 6 foods were carrots, ketchup, spinach, corn syrup, goji berries, and twinkies. This is an interesting mix since it includes fibrous, sugary, and oily foods, so there’s no obvious trend as to what worked and what didn’t.

Without complete digestion, the measurements we got from ICP-OES couldn’t be expected to be at all accurate. So while we have these results, they probably aren’t meaningful, and we discontinued hydrochloric acid digestion for all other samples.

The main results are all ten foods in four conditions: ICP-MS after HNO3 digestion, ICP-OES after HNO3 digestion, ICP-MS after dry ashing, and ICP-OES after dry ashing.

Little difference was found between the results given by ICP-MS and ICP-OES, other than the fact that (as expected) ICP-MS is more sensitive to detecting low levels of lithium. However, a large difference was found between the results given by HNO3 digestion and dry ashing.

In samples digested in HNO3, both ICP-MS and ICP-OES analysis mostly reported that concentrations of lithium were below the limit of detection. The highest numbers given by this technique were in spinach, which was found to contain about 0.2-0.3 mg/kg lithium, and goji berries, which ICP-MS found to contain up to 1.2 mg/kg lithium.

In comparison, all dry ashed samples when analyzed by both ICP-MS and ICP-OES were found to contain levels of lithium above the limit of detection. Some of these levels were quite low — for example, carrots were found to contain only about 0.1-0.5 mg/kg lithium. But other levels were found to be relatively high. The four foods with the highest concentrations of lithium, at least per these analysis methods, were ground beef (up to 5.8 mg/kg lithium), corn syrup (up to 8.1 mg/kg lithium), goji berries (up to 14.8 mg/kg lithium), and eggs (up to 15.8 mg/kg lithium). 

These results are summarized in greater detail in the technical report, and in this figure: 

4. Which technique is more accurate? 

We think that dry ashing (which gives the higher estimates for lithium) is probably more accurate, and here are some reasons why. 

Reason #1: Many water samples contain some lithium, and some water samples contain a lot of lithium — sometimes more than 1 mg/L, and occasionally a lot more than 1 mg/L. Unlike food samples, water samples require no digestion, so measurements of water samples are probably quite accurate. 

Most food is grown using water and contains some water [CITATION NEEDED]. It would be strange if food, which is made out of water (plus some other things) always contained less lithium than the water it is made out of. More likely, there’s something else that can interfere with the analysis when foods aren’t completely digested. 

Reason #2: The analysis lab we used has a “buy one element, get one free” deal, so for all of the foods we submitted, we requested sodium analysis (Na+) on top of the lithium (Li+). We figured, why not, it doesn’t cost any extra.

If there were something unusual about the lithium analysis, you’d expect sodium to behave differently. Specifically, you’d expect each analytical method to find similar levels of sodium in every food. So we compiled the sodium data and ran the same analysis as lithium. And sure enough, it does. Here’s a comparison of the results for lithium and sodium:

(Note that the y axes are different scales. There is way less lithium than sodium in these foods, so when analyzing lithium we are much closer to the limits of quantitation.)

If you were validating the equivalence of sample prep procedures based on Na+, you’d say “looks good, great agreement between ashing and HNO3 digestion.” This isn’t at all true for Li+. Why? We have no idea. But it further supports the suspicion that Li+ is more slippery for some reason, an excellent comparison that highlights just how strange the lithium results are. 

This also seems to rule out various “operator error” explanations. If someone were dropping vials or putting them in the machine backwards or something, you would see weird patterns for both lithium and sodium results. The fact that the sodium results look totally normal suggests that something weird is happening for lithium in particular.

Reason #3: Imagine taking pictures with a camera. If you point the camera at something dark, the resulting picture comes out dark. If you point it at something bright, the resulting picture comes out bright. This is a good sign that the camera is working as intended, and that you’re operating it correctly. If your pictures always come out dark, something is probably wrong. Maybe you forgot to take off the lens cap.

We see something similar in these data. Dry ashing sometimes gives low measurements, like in milk and carrots, which it always found to contain less than 0.6 mg/kg lithium. Dry ashing sometimes gives high measurements, like in eggs and goji berries. There’s a lot of noise, but we know that it can produce numbers both large and small. 

In comparison, HNO3 digestion always gives tiny numbers. Most of the time it finds that lithium levels are below the limit of detection. When it does seem to detect an actual amount of lithium, the levels are always low, never above 1.2 mg/kg. These numbers look less like actual estimates and more like a problem with the instrument. A cheap digital camera can’t take a good picture at night, even when it’s working perfectly well.

Reason #4: Several parts of the literature hint that spectroscopy techniques are a bad way to measure lithium in food. These comments are often vague, but it seems like people already have reason to think that these methods underestimate the amount of lithium.

For example, Drinkall et al. (1969) mention that they chose to use AAS (“the Unicam SP90 Atomic Absorption Spectrophotometer, [with] a propane-air flame”) because of their concern about “spectral interference occasioned by elements other than lithium” in spectroscopy techniques.

Manifred Anke, who did more work on lithium levels in food than maybe anyone else, makes this somewhat cryptic comment in his 2003 paper:

Lithium may be determined in foods and biological samples with the same techniques employed for sodium and potassium. However, the much lower levels of lithium compared with these other alkali metals, mean that techniques such as flame photometry often do not show adequate sensitivity. Flame (standard addition procedure) or electrothermal atomic absorption spectrophotometry are the most widely used techniques after wet or dry ashing of the sample. Corrections may have to be made for background/matrix interferences. Inductively coupled plasma atomic emission spectrometry [another name for ICP-OES] is not very sensitive for this very low-atomic-weight element.

We can also point to this article by environmental testing firm WETLAB which describes several potential problems in lithium analysis. “When Li is in a matrix with a large number of heavier elements,” they say, “it tends to be pushed around and selectively excluded due to its low mass. This provides challenges when using Mass Spectrometry.” They also indicate that “ICP-MS can be an excellent option for some clients, but some of the limitations for lithium analysis are that lithium is very light and can be excluded by heavier atoms, and analysis is typically limited to <0.2% dissolved solids, which means that it is not great for brines.” We’re not looking at brines, but digested food samples will also include many heavier atoms and some dissolved solids, and might face similar problems. 

The upshot is that various sources say something like, “when testing foods, you have to do everything right or you’ll underestimate the amount of lithium”. We can’t tell exactly what these sources think is the right way to do this kind of analysis, but everyone talks about interference and underestimation, and no one mentions overestimation. This makes us suspect that the lower HNO3 digestion numbers are an underestimation and the higher dry ashing numbers are more accurate.

ICP techniques can detect all the elements from lithium to uranium, which means that lithium is just on the threshold of what can be detected. It wouldn’t be terribly surprising if lithium were an edge case, since it is on the edge of detection for ICP analysis. Interference might push it over the edge of the threshold. And interference would only lead to mistakenly lower measurements, not mistakenly higher measurements. This suggests the higher measurements are more accurate.

Reason #5: There are a few cases where teams have used HNO3 digestion and still report high concentrations of lithium in food, in particular Voica, Roba, and Iordache (2020)

This suggests that maybe there’s some trick to HNO3 digestion that can make it give higher, more accurate results, numbers that are consistent with dry ashing. Maybe these teams know something we don’t.

𐫱

All of these are reasons to suspect that the higher dry ashing numbers are more accurate. However, the truth is that at this point, nobody knows.

Given this uncertainty, it could be that neither technique is accurate. The true levels of lithium in these foods might be in between, or could be even higher than what was detected by dry ashing. 

Using other analysis techniques like AAS or AES or FAES would be a good way to triangulate between these two conflicting methods. Unfortunately we have not been able to find a lab that offers AAS or other alternative methods of chemical analysis. Can anyone help us?

Accuracy aside, one thing that stands out is that none of these techniques are very precise. For three samples of the same well-blended corn syrup, dry ashing with ICP-OES gives estimates of 0.7155 mg/kg, 1.5892 mg/kg, and 8.1207 mg/kg lithium. HNO3 digestion with ICP-OES generally doesn’t report any lithium at all, but for spinach, it gives estimates of 0.3914 mg/kg, 0.2910 mg/kg, and 0.3595 mg/kg. These are for three identical samples of well-blended spinach. In theory they should be the same! But all four techniques appear to have relatively low precision across the board. 

5. What does this mean for analytical chemistry? 

Two different analytical techniques gave two very different answers when looking at the exact same samples. This seems like an anomaly worth investigating.

These unusual findings may result from the fact that lithium is the third-lightest element and by far the lightest metal. It’s a real weird ion, so this may just be lithium being lithium. But even so, if the nitric acid completely digests a sample and gives a clear, homogeneous solution, it would seem like there is nowhere for Li+ to hide. From first principles, you’d expect this to work.

It’s also possible that this points to a more consistent limitation of common analytical techniques. Certainly it would be a problem if the techniques we used to estimate mercury in fish, or arsenic in rice, consistently underestimated the concentrations of these metals. 

It may be smart to run similar studies to compare analytical techniques for estimating other metals in foods, to make sure there aren’t any other hidden surprises like this one. If work along these lines turns up many similar surprises, well, maybe that means we don’t understand analytical chemistry as well as we think. 

6. Next Steps

We would like to test a lot more samples, and get a better sense of how much lithium is in all kinds of different foods. 

But before we can do that, we have to figure out this mystery around different analytical techniques. It doesn’t make sense to go out and use one method to test a thousand different foods when we don’t know if that method is at all reliable or accurate.

So first off, we will be trying to figure out which technique is most accurate, and if we can, we’ll also try to figure out why these different analytical techniques give such strikingly different results. 

There are a few ways we can do this:

  • We can add known amounts of lithium to food samples in a spike-in study. 
  • We can also spike-in elements that might be interfering with lithium detection. 
  • We can try other kinds of digestion or other analytical techniques (like AAS) as a tiebreaker, and see if they agree more with the HNO3 numbers or the dry ashing numbers. 
  • Or we can study more samples — it’s possible that a food containing 1000 mg/kg would register above the limit of detection for both techniques. 
  • If you have any other clever ideas, please let us know! 

In the meantime, here are some ways you can help:

If you have access to the necessary equipment, please replicate our work. We’ve included all the checks we could think of, but it’s still possible that there was some mistake in our procedure, something backwards about the results. Independent labs should confirm that they get similar results when comparing HNO3 digestion to dry ashing in ICP-MS and ICP-OES analysis. 

An even bigger favor would be to extend our work. If you are able to replicate the basic finding, it would be jolly good to tack on some new foods or try some new analytical techniques. Do you have access to AAS for some reason? Wonderful, please throw an egg into the flame for us. 

If you’re not an analytical chemist but you are a person of means who is both curious and skeptical, you could conceivably hire a lab to replicate or replicate and extend our work. If you’re interested in doing this, we would be happy to advise.

And if you want to help fund more of this research, please contact us. You can also donate to Whylome directly.

Thanks again to our anonymous donor, to Sarah Jantzi, and to Whylome for supporting this research. 

Finally, thank you for reading!


APPENDIX A: Wait what is the background for this study?

Hello, we are SLIME MOLD TIME MOLD, your friendly neighborhood mad scientists. 

We started getting into this question because in our opinion, the evidence suggests that exposure to subclinical doses of lithium is responsible for the obesity epidemic — you can read all about it in Part VII and Interludes C, G, H, and I of our series, A Chemical Hunger. 

We also understand that not everyone finds this evidence convincing. That’s ok. Even if you don’t think lithium causes obesity, this project is still important for other reasons: 1) lithium might have other health effects, so 2) we should be able to test food for lithium concentrations so we can know how much we’re consuming and act accordingly. And in general, this looks like it might be a gap in analytical chemistry. We should know how to analyze things; so let’s close that gap.

APPENDIX B: Where is all this lithium coming from?

We’ve already written quite a bit about this, so if you want the full story, you should read those posts: in particular Part VII, Interlude G, Interlude H, and Interlude I of A Chemical Hunger

But the short version is this. Starting around 1950, people started mining more and more lithium and never looked back, and some of what we mine eventually ends up as contamination. Lithium goes in batteries, which end up in landfills. It also goes in the lithium grease used in cars and other heavy machinery, which ends up in runoff. Deeper aquifers often contain more lithium, so drilling deeper wells may have also increased our exposure. 

Graph showing world lithium production from 1900 to 2007, by deposit type and year. The layers of the graph are placed one above the other, forming a cumulative total. Reproduced from USGS.

But the biggest contributor is probably fossil fuels. Coal often contains lithium, which can contaminate groundwater through coal ash ponds. Oil and natural gas extraction often creates oilfield brines or “produced water” that can contain incredible concentrations of lithium. In theory these brines are safely disposed of, but in practice they often contaminate groundwater, are spilled in quantities of hundreds of thousands of gallons, or are spread on roads in their millions of gallons as a winter de-icer

Oh and sometimes people use oilfield brines to irrigate crops. Yes, really.

Philosophical Transactions: Jon on One Year Post-Potato-Diet

Previous Philosophical Transactions:

Jon was a participant in our Potato Diet Community Trial. He recently sent us an email with an update on how he’s doing, which is reproduced below with his permission.


I don’t know if you wanted a 1 year followup.

So last year at this time I’d just come off my first potato diet and it seemed like the weight was staying off at least partially out of sheer cussedness and a desire to see my much-touted diet work out as well as I’d hoped. Where am I at a year later?

At the end of that first potato diet I was at 168, having lost about 15 pounds from my start of 183.6. Last time I weighed myself I was at around 172. That’s practically within water-weight of that 168! And that 172 is approximately stable compared to a month ago or whenever I last weighed myself!

In the last year I’ve done a couple more tries at the potato diet, neither of which were as successful as that first one. But I think when it comes down to it the potato diet knocked my basic set-weight down by about 11 pounds! The biggest ongoing change in my diet is having tater tots and sausage for breakfast almost every day, generally replacing cereal in the old regime.

Anyway, absurdly pleased by that result–potato diet wasn’t a magic bullet for me but it halted the inexorable upward slide of my weight, got me down a little bit and has kept me stable for a year.

Even though it never worked as well again (probably lack of accountability from not being part of a study) the potato diet was still life-changing and has improved my health long term! Please let me know if you need any more data, I’m happy to provide it! Thanks,

Jon 

Vacation Study Ideas


There are lots of stories where an American goes on vacation for a few weeks, to Europe or Asia or wherever, and loses a significant amount of weight without any special effort. 

(Though sometimes it’s not weight, it’s something else like acne breakouts or digestive issues.)

There are also some stories that are exactly the opposite: someone from Europe or Asia or wherever goes on vacation to America for a few weeks, and GAINS a significant amount of weight without any changes. 

Some stories describe what are almost simple ABABA-style experiments, where a person goes back and forth from America to other parts of the world and sees their weight reliably yo-yo as they move from country to country. We shared one such story in Part X of A Chemical Hunger, this account from Julius: 

I currently live in Seattle but have moved around a lot. I’ve made 6 separate moves between places where I drank the tap water (mostly USA/UK/Hungary) and places I haven’t (South East Asia, India, Middle East). Whenever I’ve spent significant time in bottled water countries I lost weight (up to 50 lbs), and each time, save one 3 month stretch in Western Europe, I gained it back in tap water countries. I also lost weight for the first time in the States (20 lbs) this year around the time I switched to filtered water.

We can also share this story, from another reader (lightly edited per his request):

I quit my job and moved to northwest Thailand. I lived there for about 1.5 years and lost 100lbs. At the end, I was thinner than I’d ever been as an adult, even in Germany, just under 200lbs (or ~90kg). I didn’t do much if any exercise and I typically ate as much as I wanted.

Then I moved to SF and gained the 100lbs back within 2-3 years. I worked out while I was still thin, but, again, it didn’t stop the gaining and eventually became impractical as I was too fat to run. Peaked around 300lbs once again.

So then I thought, it’s the work stress. So I quit my job once more, and I moved to Las Vegas, where I lived for an ENTIRE YEAR without a job. And didn’t lose any weight. 

During these last few years, I would often vacation in Thailand for 1-3 months, and always lose weight without trying. Typically, if I was there for at least 1 month, I’d see some noticeable fat loss on the order of a few pounds, and feel my belt get looser.

Even right now, as I’m visiting with my family back in Germany, I am visibly and belt-feel thinner after only 3 weeks of being outside the US, despite zero exercise and eating a ton of salami and cheeses.

Anecdotes are fun, but so far there hasn’t been any systematic study. If this vacation weight loss effect is real, it seems like it would be good to know. It would give us a powerful tool for causing weight loss (just take a trip to somewhere leaner than where you’re living right now), and it would help us get closer to finding out what causes obesity. 

In particular, it would provide more evidence for the contamination hypothesis, since losing weight on vacation is a pretty strong hint that something about the environment is to blame. Most of the anecdotes above seem pretty confident their weight loss has something to do with the “unprocessed” foreign food, but there are reasons to think it might be some other part of the foreign environment. And if we could study vacation weight loss in a systematic way, we might be able to narrow things down.

Systematic

Happily, the plural of anecdote IS data, so these anecdotes do start us off with data we can use. 

But this data is not very systematic, and may not be representative. In particular, if you go on vacation to Europe and you lose no weight, you probably don’t post about it on social media, and you probably don’t email us to tell us about the weight you didn’t lose. 

We can correct for this by trying to collect data in a more systematic way. We can also try to come up with a design that lets us account for some alternative explanations (more on this in a bit). 

We have a few ideas for study designs, but we’re not sure what kind of design would be best. We’ll describe general ideas for designs below, and please, let us know what you think.

If any of the designs seem good, we might run one of these studies at some point. But it’s somewhat of a shame for us to be running so many of these internet studies. No one should have to take our word for these things — it would be better if the work/knowledge/expertise were spread around the community. 

So if you want to help run one of these studies, or if you want to take point and run it yourself, let us know and we can talk about collaborating. Or you can just take the design and run with it, we’re not your mom.

Walking

But first: Some people are skeptical that there is something special about vacation. The most common alternative they offer is some form of, “it’s all the extra walking”.

But there are some problems with this response. For starters, it assumes that all these people are walking more, but you don’t always walk more on vacation than you do at home. Some people have very active day jobs, and there’s nothing stopping you from sitting quietly in your hotel room for a week straight. 

It ignores the other details people often mention in these stories, like that they also ate much more and ate “worse” than normal on vacation. From a simplistic CICO perspective, this extra food should balance out the extra walking.

And if extra walking on vacation were the cause of vacation weight loss, then extra walking ANYWHERE should cause weight loss. This would mean that slightly more mild cardio is a good treatment for obesity in general. But “slightly more mild cardio” doesn’t work as a treatment for obesity, so it’s clearly not the cause of vacation weight loss. 

More importantly, many people who lost (or gained) weight on vacation make it clear that they don’t think it was the extra walking. Yes, they are not totally neutral parties, but no one is a totally neutral party, and they are the only ones with firsthand knowledge of their own cases.

There may be other reasons to doubt that extra walking is to blame. Friend-of-the-blog dynomight is skeptical that the walking explanation survives back-of-the-napkin math:  

But all this debate is really for nothing. We can just check. 

For starters, it’s easy enough to ask people to count steps. Their phones make estimates automatically. We can see if people are walking more on vacation and if how much extra walking they do is at all related to how much weight they lose. 

We can compare Americans who go on vacation to Europe with Europeans who go to vacation in America. Maybe both groups walk more than average while they’re on vacation, but if the Americans lose weight in Europe and the Europeans gain weight in America, that would suggest that the extra walking has little to do with the weight change. 

We can also compare between states. Different US states vary widely in their obesity rates, from 25% in Colorado to more than 40% in Kentucky. If it’s something about the environment, then people from Kentucky should lose weight when they vacation in Spain, but people from Colorado might not. Similarly, we can look at people taking vacations in different US states. Europeans might gain weight in Mississippi but might not gain weight in Massachusetts. 

We could even do something ludicrous like: “take identical obese twins, send one twin on vacation to Italy and have the other twin stay in America and try to match their walking distance as closely as possible.”

With the right design, it should be relatively easy to tell if walking is to blame. It’s fine if somehow it turns out that extra walking is the real cause of vacation weight loss, but clearly this is somewhat controversial — we should do a study and see. 

Design #1: Existing Cohort Study

First, we could use data that someone else has already collected.

Programs like the Fulbright Program and the Peace Corps send young people to different countries around the world. These programs are already doing a controlled study on the vacation weight change effect, they just don’t know it. For example, the Philippine-American Fulbright Commission takes young people from a fat country (America) and sends them to a lean country (the Philippines), and also takes young people from a lean country (the Philippines) and sends them to a fat country (America), in both cases for about a full year. 

These programs may already be recording students’ weights before and after their trip abroad, perhaps for medical reasons. If so, all the data we need already exists out there in some database. If not, all that would be required would be convincing the program, or even just some of the students, to start recording their weights before and after the exchange.

This is pretty much the ideal experiment. It’s systematic — we will get information from everyone, whether or not they gain or lose weight. The sample size is huge. And the data may already exist.

The problem is that we don’t know if there’s any way for us to GET this data. We haven’t had any luck trying to get in touch with Fulbright or any of these other programs, and we doubt they would be willing to make this data public.

If anyone thinks they could put us in touch with anyone on the Fulbright Philippines Board of Directors, or anyone at a similar organization (the American armed forces might have similar data), we would love to do this analysis. But barring that, we’ll have to come up with ways to collect our own data. 

Design #2: Retrospective Vacation Study

Second, we could collect vacation information that already exists.

People have gone on many vacations over the course of human history [citation needed]. So for this design, we would systematically collect all the existing vacation stories we can.

This could be as simple as setting up a google form and asking people to submit stories about their past vacations (or other international trips, like exchange programs or briefly being an expat). The form would include just a few simple questions — how long the trip was, how much they weighed before, how much they weighed after, where they went, etc. Then we could look at this data to see if there’s any support for the vacation effect. 

You might want to limit this (and the designs we talk about below) to trips that are at least two weeks long, because one week probably wouldn’t be enough to get a clear signal. 

The upside of this design is that you might be able to get a lot of data pretty quickly. But there are some downsides.

First off, people may not remember how much they lost, how long they were gone, or other details of the trip. In short, the measurements will be noisy.

Second, you can’t ask people to collect specific data, or ask them to collect it in specific ways, because the vacation has already happened. If people happen to have measurements of how much they walked on their vacation, that would be great, but most people won’t have collected that data. 

Finally, there’s bound to be a selection effect. People who lost weight on vacation are probably more likely to respond than people who gained weight. This isn’t totally damning since we can still see things like 1) whether people lost more weight on longer vacations, 2) whether people lost more weight when they traveled to leaner countries, or 3) whether younger people lost more weight than older people. But it is a limitation. 

So it would be easy to run this study, and maybe informative if we got enough responses, but there are some problems with this kind of design.

Design #3: Prospective Vacation Study

Third, we could collect vacation data as it’s being created.

People continue to go on vacations today; in fact, many people are planning vacations right now. So another option would be to ask people to sign up to report on any vacations they’re about to take, and provide us a little data about the before and after. 

The design would be pretty simple: first a pre-vacation survey, where people tell us about the vacation they’re about to go on, where they’re coming from, where they’re going, how long it will be, and how much they weigh right now. We’d also ask them to give us some measure of their average activity, maybe their average steps per day over the last three months — something easy that should already be captured by their phone.

Then when they get back, there’d be a post-vacation survey, where people could tell us what their weight was after the vacation. We’d also ask them for their average steps per day while on vacation, so we could get a sense of if they are walking more or less than normal. We could also ask them to report subjectively on measures like whether they exercised more or less than usual, and whether they ate more or less than usual.

This would help keep selection effects somewhat in check. No one knows before a vacation whether they will gain or lose weight — they can’t decide whether or not to sign up for the study based on their weight change, because it hasn’t happened yet. 

If we have a high attrition rate, with lots of people filling out the first part but not filling out the second, this could be a sign that people who gain weight don’t come back and report their weight gain. But if the attrition rate is low, that suggests there isn’t much post-hoc selection. 

We can also do comparisons just within the people who respond. Maybe the attrition rate is high, but if all the Americans going to Europe report losing weight, and all the Europeans coming to America report gaining weight, we can be fairly sure that’s not just selection. 

The downside is that this approach would be pretty slow. There are lots of vacations, but we have to wait for people to come to us one by one as they jet off on their various trips. 

This design is also not very controlled. We don’t get to pick the vacations and we don’t get to pick the vacationers. It’s a convenience sample, and while it might still be revealing, there are limitations. 

Design #4: Controlled Vacation Experiment

Fourth, we can go out of our way to create the data we want.

It’s within our power to make vacations happen under controlled conditions — recruit some people who are obese and who can spend a month or two abroad (perhaps they have a remote job), and send them to a lean country for a couple weeks to see what happens. As with the other designs, you could have them track their exercise and other confounders if you want.

This is a version of what we have previously called “Slime Mold Time Mold’s Excellent Adventure”. 

We were originally concerned that even if things were perfect, weight loss would be pretty slow. Even if you sent people to Japan for a month, they might not lose weight quickly enough for you to reliably detect the change. We thought that you might have to send people abroad for closer to a year, just to pick up on the effect.

But the results of the Potato Diet have convinced us that under the right conditions, quite a lot of weight loss can happen in just a few weeks. So now we think that a vacation study of 2-4 weeks might actually be informative. 

And you may not need very many people. It’s still not clear how many people lose weight on vacations, but if the effect is consistent enough, you could find strong evidence with just a few participants (yet another n of small opportunity). If five obese people go to Italy for a month and all of them drop 10 lbs while sitting around and eating spaghetti alla carbonara ad libitum, that would be strong evidence, even with the small sample size.

The ideal countries to send people to would probably be Vietnam (leanest country in the world, about 2% obese), Bangladesh, India, Nepal, Japan, or South Korea (all less than 5% obese). There are many relatively lean countries in South America and Europe, but even Albania is more than 20% obese, so you would probably get a weaker effect. 

This wouldn’t be too expensive. It costs around $4,000-$5,000 to send someone to a lean country for a month, so you could likely send around 10 people to one of these countries for a month for less than $50,000. Not pocket change, true, but cheap in the grand scheme of scientific studies. Given that many people enjoy vacations [citation needed], you might even be able to get people to pay for half of their trip.

It might make sense to run one of the other studies first to see if they back up the anecdotes, before spending all this money. But the other study designs aren’t nearly as controlled. If you’d be interested in funding this study, or helping us arrange all the travel details (booking hotels and flights is not our strong suit), please let us know. Or you can ignore us, recruit 10 obese volunteers, and send them to Myanmar all on your own. Just let us know what you find out! 

Similarly, anyone who is at all overweight could run this as an N=1 self-experiment, or get a few friends and run it as an N of small. You just need to be in a position to spend a few weeks in one of these lean regions.

The main drawback is that the small sample size would keep you from making interesting comparisons. Sending 10 obese Americans on a one-month trip to a small Asian country could make a strong case for the vacation effect, but it wouldn’t let us answer questions like the following: do young people lose weight faster on vacations than old people? Do other demographics (like ethnicity) have an impact? Do people lose weight faster in Peru (19% obese) than in Spain (27% obese)? Do people with BMI < 25 also lose weight on vacations? 

This would be another reason to run multiple studies with different designs. Sending people on a planned vacation gives you a lot of experimental control with the limitation of a small sample size, while other designs can give you a large sample size at the cost of experimental control. Both could tell us a lot, and they’d be stronger together — triangulation is the name of the game. 

Final Notes

As far as we know, no one has ever done a vacation study like this, so any study at all would be interesting. It doesn’t have to be perfect — we should start by getting our toes wet. 

We’re talking about these designs like they’re all about obesity, but this approach doesn’t have to be used to study obesity. You could also use it to study, say, migraines. Lots of people think they are gluten or lactose intolerant — but are they still gluten or lactose intolerant if they’re eating bread or milk in, say, Italy? Might be interesting to find out. 

As always, we are happy to help with designs and methodology. If you want to run one of the studies described above, please contact us

Your Mystery: What’s the Deal With A̶i̶r̶p̶l̶a̶n̶e̶ ̶F̶o̶o̶d̶ Iodine and Longevity?

[This is one of the finalists in the SMTM Mysteries Contest, by a reader writing under the pseudonym Lee S. Pubb. We’ll be posting about one of these a week until we have gotten through all the finalists. At the end, we’ll ask you to vote for a favorite, so remember which ones you liked.]

Background

Element 53, iodine, is a mineral essential to human health largely because it is utilized in the production of thyroid hormones.[1] For much of recorded human history, societies the world over suffered from the iodine deficiency disorder known as goiter–swelling in the neck resulting from an enlarged thyroid gland. It was common in regions where topsoil was regularly eroded (e.g., by flooding), as topsoil is rich in iodine, normally leading to its uptake in food crops. It’s also abundant in foods derived from the ocean, as ocean water contains iodine.

While Chinese doctors are said to have prescribed the consumption of animals’ thyroid glands to treat goiter as early as the 7th century, it was only in the early 20th century that large-scale research was done on iodine supplementation. It was found that sufficient levels of iodine consumption eliminated goiter in the vast majority of cases, and we began iodizing salt soon after. (Which is why I had to give this lengthy background on goiter, instead of just saying “that giant lump in your friend’s neck”.) The FDA recommends that Americans consume 150 mcg of iodine a day, and expect that the vast majority of Americans will achieve this through salt consumption.

(Very likely the reason you don’t have a goiter.)

That said, while the level of iodine supplementation present in modern-day table salt is clearly sufficient to greatly reduce the incidence of goiter, that doesn’t necessarily mean that it’s the ideal level for overall thyroid health.[2] (The FDA’s upper limit is set nearly 8 times higher than the RDA, at 1,100 mcg, suggesting that considerably more than the recommended amount isn’t expected to be deleterious to human health.) The thyroid largely regulates metabolism, and you may be familiar with some mysteries raised about human metabolism over the past century.[3] There are also a number of diseases directly associated with thyroid function, and these are pretty common in the present day (especially among women), with around 20 million patients in the United States estimated to have some kind of thyroid disorder. Thyroid functioning is screened for by doctors via blood tests measuring thyroid hormone concentration. Common disorders include hypothyroidism, in which an abnormally low level of thyroid hormone is produced, and hyperthyroidism, in which too much is produced.

INTERESTING!:

The Blue Zones are regions around the world renowned for their high proportion of centenarians, people living to the age of 100 or later. These are Okinawa, Japan; Sardinia, Italy; Nicoya, Costa Rica; Ikaria, Greece, and Loma Linda, California. These zones are now getting the shit studied out of them by anthropologists, doctors, etc., so we can try and figure out why they live so long and hopefully use it to improve human healthspan elsewhere.

You will not be surprised, given the background I just provided, to find out that iodine appears to be related to the mystery of the blue zones.

In the study Association of endemic goitre and exceptional longevity in Sardinia: evidence from an ecological study, the authors note “The spatial analysis revealed that the goitre rate (p < 0.0001), the proportion of inhabitants involved in pastoralism (p = 0.016), the terrain inclination (p = 0.008), and the distance from the workplace as a proxy for physical activity (p = 0.023) were consistently associated with population longevity at an aggregated level in the 377 municipalities.” Which is to say, a higher goiter rate in a municipality was the measure they studied that was most clearly associated with greater longevity. This association had an extremely–to my mind, an almost outrageously–low p-value.

 The study goes on to say that, “from a worldwide perspective, the finding of an epidemiological association between goitre prevalence and longevity does not seem to be limited to Sardinia, but partially shared also by other populations where long-lived subjects are numerous. Most of the Longevity Blue Zones in the past were niches of endemic goitre as well. In Costa Rica, where the Nicoya LBZ was identified in 2007 (Rosero-Bixby 2008), high prevalence of endemic goitre has been reported since the 1950s (Perez et al. 1956) possibly aggravated by a gross excess of calcium ingested with drinking water (Boyle et al. 1966). In another LBZ, Ikaria island, the iodine level in spring water is remarkably low (Pes and Poulain 2014).”

So great, restrict iodine and you’ll live forever, right? AGING SOLVED! WE DID IT, YOU’RE WELCOME, aging is just iodine damage.

…Except.

Another Blue Zone is Okinawa, where most of the population routinely consumes nutritionally large quantities of seaweed–one of the richest natural sources of iodine. How much iodine are they consuming? I don’t have great numbers on Okinawa itself, but mean consumption of iodine in Japan is estimated at around 1-3 milligrams a day–that’s 1,000-3,000 micrograms of iodine. Remember that the FDA puts the RDA of iodine at just 150 micrograms, and the UL at 1,100 micrograms! Apparently, many Japanese people are consuming considerably more than the “tolerable upper intake level” for iodine. Centenarianhood is apparently their reward. Japan has 86,000 centenarians (.06% of their population, the highest percentage in the world), and a life expectancy of 84.62 years, second only to Hong Kong (the population of which, as of 2011, had a high risk of iodine deficiency).

These studies, taken together, suggest that having a moderate iodine intake leads to early death. As the Buddha said, “seek extremes in all things and maybe you can live to be a hundred”.

It is difficult not to propose any explanations for this, but that is the task that has been assigned to me, so, there you have it. Low iodine is correlated with longevity. High iodine is correlated with longevity. The thyroid is truly the most mysterious organ.


[1] If that first sentence surprised you, you’re in good company; iodine is “the heaviest element commonly needed by living organisms.”

[2] Plus, there’s bound to be population variance–I, for one, use kosher salt in my cooking, because Alton Brown told me to, and it’s not iodized. I’m surely exposed to iodized salt via processed foods and restaurant meals, but I do consume those somewhat rarely, at least compared to the number of meals I prepare at home.

[3] Iodine was once used to treat flour, oxidizing it to allow gluten to more easily form bonds and create the texture all us non-celiacs love in bread and pizza. But around the same time we began to study iodine supplementation, we invented potassium bromate, and started brominating flour instead to achieve the same effect–potassium bromate produced a very white flour that rapidly oxidized. Iodine is a necessary mineral, though, and bromine isn’t. So there was likely a point in recent American history where iodine consumption in bread decreased. You’re also really not supposed to consume the potassium bromate, but the thought is that baking temperatures sublimate the bromine–ah fuck I guess you really *shouldn’t* eat raw cookie dough? fuck.